Economics in a COVID-19 World: Global and Local Challenges - GIFLEX 19 GENNAIO 2021

Page created by Gerald Porter
 
CONTINUE READING
Economics in a COVID-19 World: Global and Local Challenges - GIFLEX 19 GENNAIO 2021
Economics in a COVID-19 World:
        Global and Local Challenges

                     GIFLEX 19 GENNAIO 2021
                                  Fadi Hassan
                                  BdI, CEP-LSE

Email: fadi.hassan1@outlook.com
Twitter: @fdhassan
Economics in a COVID-19 World: Global and Local Challenges - GIFLEX 19 GENNAIO 2021
This time is really different                             CHAPTER 1    GLOBAL PROSPECTS AND POLICIES

Table 1.1. Overview of the World Economic Outlook Projections
(Percent change, unless noted otherwise)
                                                                             Difference from June   Difference from April
                                                         Projections          2020 WEO Update1           2020 WEO1
                                             2019     2020        2021         2020        2021       2020        2021
 World Output                                 2.8     –4.4           5.2         0.8       –0.2       –1.1         –0.5
  Advanced Economies                          1.7     –5.8          3.9         2.3       –0.9         0.3        –0.6
  United States                               2.2     –4.3          3.1         3.7       –1.4         1.6        –1.6
  Euro Area                                   1.3     –8.3          5.2         1.9       –0.8        –0.8         0.5
    Germany                                   0.6     –6.0          4.2         1.8       –1.2         1.0        –1.0
    France                                    1.5     –9.8          6.0         2.7       –1.3        –2.6         1.5
    Italy                                     0.3    –10.6          5.2         2.2       –1.1        –1.5         0.4
    Spain                                     2.0    –12.8          7.2         0.0        0.9        –4.8         2.9
  Japan                                       0.7     –5.3          2.3         0.5       –0.1        –0.1        –0.7
  United Kingdom                              1.5     –9.8          5.9         0.4       –0.4        –3.3         1.9
  Canada                                      1.7     –7.1          5.2         1.3        0.3        –0.9         1.0
  Other Advanced Economies2                   1.7     –3.8          3.6         1.1       –0.6         0.8        –1.0
  Emerging Market and Developing Economies    3.7     –3.3          6.0        –0.2        0.2       –2.1         –0.5
  Emerging and Developing Asia                5.5     –1.7          8.0        –0.9        0.6       –2.7         –0.5
    China                                     6.1      1.9          8.2         0.9        0.0        0.7         –1.0
    India3                                    4.2    –10.3          8.8        –5.8        2.8      –12.2          1.4
    ASEAN-54                                  4.9     –3.4          6.2        –1.4        0.0       –2.8         –1.5
  Emerging and Developing Europe              2.1     –4.6          3.9         1.2       –0.3        0.6         –0.3
    Russia                                    1.3     –4.1          2.8         2.5       –1.3        1.4         –0.7
  Latin America and the Caribbean             0.0     –8.1          3.6         1.3       –0.1       –2.9          0.2
Economics in a COVID-19 World: Global and Local Challenges - GIFLEX 19 GENNAIO 2021
The worst crisis since WWII
Economics in a COVID-19 World: Global and Local Challenges - GIFLEX 19 GENNAIO 2021
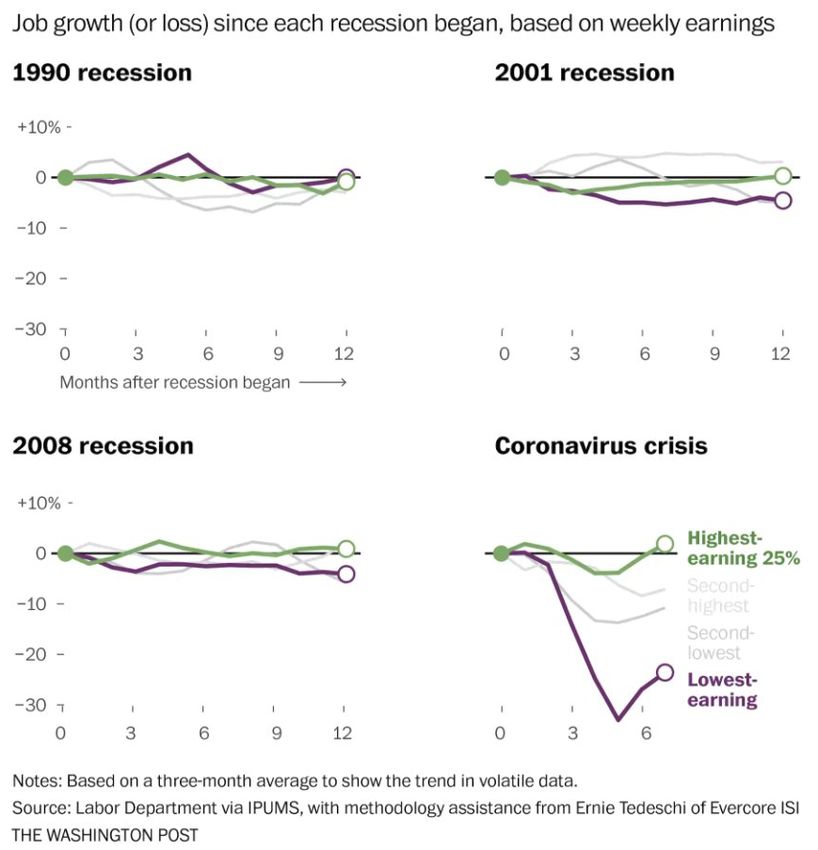
The most global crisis on record
Economics in a COVID-19 World: Global and Local Challenges - GIFLEX 19 GENNAIO 2021
The most unequal crisis
Economics in a COVID-19 World: Global and Local Challenges - GIFLEX 19 GENNAIO 2021
Have we reached the limit for fiscal space?
Economics in a COVID-19 World: Global and Local Challenges - GIFLEX 19 GENNAIO 2021
…but strategies are different                            CHAPTER 1      FISCAL POLICIES TO ADDRESS THE COVID19 PANDEMIC

Figure 1.10. Composition and Evolution of Fiscal Support, April 2020 versus June 2020
(Percent of GDP)
     1. Germany                                                              2. China
          Health                        Household support                               Health sector              VAT exemption on
          Temporary VAT cuts             ud et support to firms                          Corporate income tax and   consumer services
          Facilitating the recovery     Preserving employment links                     fee relief                 Reduction of social
          Others                          uity in ection in specific                     Public investment          security contributions
           i uidity support to firms     sectors                                         Guarantees                 Transfers
                                                                      35
                                                                                                                         3.4                   3.5
 8

 6

 4                                                                    15
                                                           3.9                    1.3                                                          1.5

                                                                      5

       Spending and       Liquidity                     Ne fiscal              Spending and Liquidity               Spending and Liquidity
          revenue          support                       package                revenue      support                 revenue         support
         measures       (right scale)                    une                   measures                             measures
      re ious fiscal support pril                                                 Emergency lifelines                 Facilitate the recovery

Sources: Fiscal Monitor Database for Fiscal Measures in Response to the COVID-19 Pandemic (https://www.imf.org/en/Topics/imf-and-covid19/Fiscal-
Policies-Database-in-Response-to-COVID-19); and IMF staff estimates.
Note: Ne fiscal packa e for ermany announced in une contained measures for                The numbers indicate the si e of the fiscal support in
percent of            -     corona irus disease       ; T alue-added ta
Economics in a COVID-19 World: Global and Local Challenges - GIFLEX 19 GENNAIO 2021
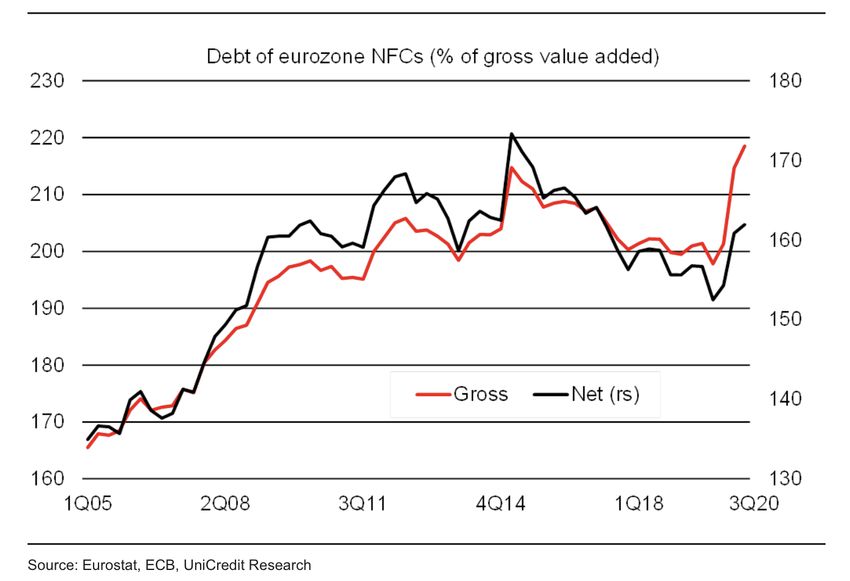
Firms’ financial vulnerability in perspective
Economics in a COVID-19 World: Global and Local Challenges - GIFLEX 19 GENNAIO 2021
10
                                  15
                                       20
                                            25
                                                 30

                     0
                         5
            1999Q1
            1999Q4
            2000Q3
            2001Q2
            2002Q1
            2002Q4
            2003Q3
            2004Q2
            2005Q1

Italy
            2005Q4
            2006Q3
            2007Q2
            2008Q1
            2008Q4
            2009Q3
            2010Q2
Germany     2011Q1
            2011Q4
            2012Q3
            2013Q2
                                                      Household Saving Rate

            2014Q1
            2014Q4
Euro Area

            2015Q3
            2016Q2
            2017Q1
            2017Q4
            2018Q3
            2019Q2
            2020Q1
                                                                              The potential role of households savings
Economics in a COVID-19 World: Global and Local Challenges - GIFLEX 19 GENNAIO 2021
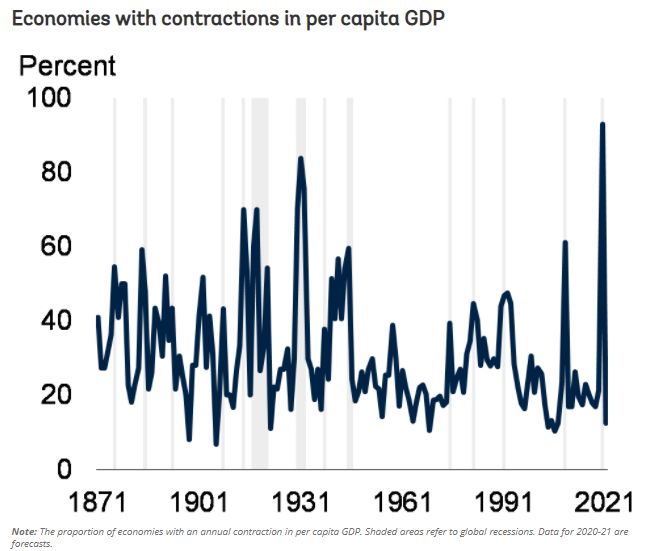
ese e valutazioni sulle condizioni economiche
                    (valori percentuali)     Whose crisis?
onomica dell’Italia                    (b) valutazioni sulla variazione del reddito familiare
mesi (1)                             secondo la condizione occupazionale del capofamiglia
                          45   100                                                                    100
                          40   90                                                                     90

                          35   80                                                                     80
                               70                                                                     70
                          30
                               60                                                                     60
                          25
                               50                                                                     50
                          20
                               40                                                                     40
                          15   30                                                                     30
                          10   20                                                                     20
                          5    10                                                                     10
                          0     0                                                                      0
 eggiorerà   peggiorerà              dipendente   autonomo    disoccupato     pensionato     totale
 evemente    nettamente

gio                                                il reddito nel 2020 è aumentato
embre                                              il reddito nel 2020 è rimasto invariato
                                                   il reddito nel 2020 è diminuito
Attese di reddito e risparmio
                                                                         (valori percentuali)

              Whose crisis?
 (a) attese di reddito in base alle condizioni economiche attuali                          (b) attese di risparmio in

80                                                                            80     80

70                                                                            70     70

60                                                                            60     60

50                                                                            50     50

40                                                                            40     40

30                                                                            30     30

20                                                                            20     20

10                                                                            10     10

 0                                                                             0      0
     nel 2020 il reddito      nel 2020 il reddito               totale                    nel 2021 il reddito nel 2021 il re
            diminuito               diminuito                                             aumenterà rispetto resterà inva
                                                                                               al 2020         rispetto al 2

               nel 2021 il reddito aumenterà rispetto al 2020                                la famiglia spenderà meno
                                                                                             da parte qualche risparmio
               nel 2021 il reddito resterà invariato rispetto al 2020                        la famiglia spenderà tutto il
                                                                                             risparmiare nulla
               nel 2021 il reddito diminuirà rispetto al 2020                                la famiglia spenderà più de
                                                                                             risparmi o indebitandosi
or market reallocation when         essary to prevent bankruptcies, particularly in hard-hit
mporary tax deferrals and           strategic firms, they could delay sectoral reallocation that
 ty, but there is a risk they  Central banks are doing their best
                                    is crucial for the recovery. Direct or guaranteed loans

 General Government Debt            Figure 1.3. Central Bank Purchases of Government Debt
                                    (Percent of central government marketable securities or debt issued since
                                    February 2020)
                           Great
                       Lockdown             AEs      EMMIEs                                             75
                                                                                                71
                     Global
 Advanced         Financial
 conomies            Crisis
                                                                                         57
                                                                           50     51

                                                                   39
                                                              34

                                                     23
                                             20

merging market                        11
 economies

   60   70   80   90 2000 10   20     ZAF    IDN    TUR    MYS     HRV    GBR    POL     USA    ECB    JPN
Operations, TLTRO3): sono stati assegnati 50                                                             €STR

miliardi a controparti dell’area dell’euro, di cui 11

The ECB is providing a big support
                                                                                       Fonte: BCE e Refinitiv.
a quelle italiane (tav. 5). Il totale dei fondi erogati                                (1) A partire dal 2 ottobre 2019 €STR è un nuovo tasso di riferimento overnight
con queste operazioni è salito, rispettivamente, a                                     per il mercato monetario della zona euro; per il periodo precedente nel grafico
                                                                                       viene riportato il tasso pre-€STR. Dal 2 ottobre 2019 e fino alla fine del 2021 il
1.749 e 350 miliardi.                                                                  tasso Eonia è calcolato come €STR incrementato di 8,5 punti base.

                                                                                                                                                            Tavola 4
                                               Titoli detenuti nell’ambito dell’APP e del PEPP
                                                                         (miliardi di euro)

                                    Titoli privati (1)             Titoli pubblici (1)        Titoli pubblici italiani (2)          Titoli pubblici italiani
           VOCI
                                                                                                                              acquistati dalla Banca d’Italia (2)

APP
 Dicembre 2019                             477                            2.103                           364                                   327
 Dicembre 2020                             567                            2.342                           411                                   370
PEPP
 Novembre 2020                               48                              650                          118                                   107

Fonte: BCE e Banca d'Italia.
(1) Valori di bilancio al costo ammortizzato. – (2) Differenza tra i valori a prezzo di acquisto e gli importi nominali rimborsati.

                                                                                                                                                            Tavola 5
                                              Operazioni di rifinanziamento dell’Eurosistema
                                                                         (miliardi di euro)

                                                                                                Area dell’euro                                  Italia
                                      VOCI
                                                                                         Importo              Numero                  Importo            Numero
                                                                                                           di controparti                             di controparti

Rifinanziamento totale al 31 dicembre 2020 (1)                                             1.793                                       374

  Rifinanziamento nell’ambito delle TLTRO3                                                 1.749                                       350
    di cui: ultima operazione regolata a dicembre 2020 (lordo)                                 50               156                     11                   25
            ultima operazione regolata a dicembre 2020 (netto) (2)                             37                                        6

Fonte: BCE e Banca d’Italia.
(1) Include il totale delle operazioni di rifinanziamento principali e a più lungo termine, ossia LTRO a 3 mesi, TLTRO2, TLTRO3 e operazioni di rifinanziamento
The Good, the Bad, and the Ugly

GLOBALIZATION
year to be downgraded. Consensus estimates now put the decline in world market-weighted GDP
in 2020 at -4.8% compared to -2.5% under the more optimistic scenario outlined in the WTO's

       The global trade slowdown
April forecast. GDP growth is expected to pick up to 4.9% in 2021, but this is highly dependent on
policy measures and on the severity of the disease (Table 1).

Chart 1 - World merchandise trade volume, 2000-2021
Indices, 2015=100

 140
 130
 120
 110
 100
  90
  80
  70
  60
  50
  40

              Merchandise trade        Trend 1990-2008         Trend 2011-2018
100
                                   110
                                         120
                                               130

         60
              70
                   80
                        90
2007Q1
2007Q3
2008Q1
                                                     Index, 2015=100

2008Q3
2009Q1
2009Q3
2010Q1
2010Q3
2011Q1
2011Q3
2012Q1
2012Q3
2013Q1
2013Q3
2014Q1
2014Q3
                                                                                                                                     -7-

2015Q1
                                                                                                                                                    PRESS/862

2015Q3
2016Q1
2016Q3
2017Q1
2017Q3
                                                                       Chart 4: World services trade activity index, 2007Q1-2020Q2

2018Q1
2018Q3
2019Q1
                                                                                                                                      Big impact on service trade

2019Q3
2020Q1
(Chart 3). The steepest declines were in Europe and North America, where exports fell 24.5% and
21.8%, respectively. By comparison, Asian exports were relatively unaffected, dropping just 6.1%.

Large geographic heterogeneity
During the same period imports were down 14.5% in North America and 19.3% in Europe but just
7.1% in Asia.

Chart 3: Merchandise exports and imports by region, 2012Q1-2020Q2
Volume index, 2012Q1=100
 140

 130

 120

 110

 100

  90

  80
       2012Q1

                2012Q3

                         2013Q1

                                    2013Q3

                                              2014Q1

                                                       2014Q3

                                                                2015Q1

                                                                         2015Q3

                                                                                  2016Q1

                                                                                           2016Q3

                                                                                                    2017Q1

                                                                                                             2017Q3

                                                                                                                      2018Q1

                                                                                                                               2018Q3

                                                                                                                                          2019Q1

                                                                                                                                                   2019Q3

                                                                                                                                                            2020Q1

                                                                                                                                                                     2020Q3
                                  North Ameri ca                                     Europe                                             As i a
                                             Exports                                       Exports                                        Exports
                                             Imports                                       Imports                                        Imports

Source:         WTO and UNCTAD.
the pandemic as countries secured essential products from foreign suppliers. Although it is not
shown in Chart 6, trade in personal protective equipment (PPE) recorded explosive growth, up

                                 Covid related products gained
92% in the second quarter and 122% in May, a dramatic example of the positive contribution that
trade has made to overcoming the pandemic.

Chart 6: Year-on-year growth in world manufactured goods trade by product, 2020Q2
% change in US$ values

                           30                                                                April        May       June    Q2
                                                                                                                                                            19
                           20                                                                                                                                                     13
                                                                                                                                                                             12        11
                           10                                                                                                                                    4   5   6
                                                                                                                2
 Year-on-year growth (%)

                            0
                                                                                                                           -1
                           -10                                                                                                         -4              -5
                                                                                                     -7                                           -8
                                                                           -11                                                              -12
                           -20                                                                                       -14         -14
                                                               -17                     -19                -18
                                                   -20                                       -21
                           -30         -26                                       -26

                           -40
                                                         -42         -42
                           -50
                                             -51
                           -60
                           -70
                                 -70
                           -80
Sono scese                          Nelle maggiori economie avanzate, dove i prezzi al consumo già c
It comes after a difficult year
  le aspettative
  di inflazione
                                      di sotto degli obiettivi delle banche centrali (fig. 3), le aspettative
                                      a lungo termine desumibili dai rendimenti sui mercati finanziar

                                                                        Figura 2
                             Andamento                                                                   Inflazione al consumo
                      del commercio mondiale (1)                                                nelle principali economie avanz
                (dati trimestrali; variazioni percentuali)                                    (dati mensili; variazioni percentuali sui

  10                                                                             10    3,5

   8                                                                              8    3,0

                                                                                       2,5
   6                                                                              6
                                                                                       2,0
   4                                                                              4
                                                                                       1,5
   2                                                                              2
                                                                                       1,0

   0                                                                              0    0,5

  -2                                                                             -2    0,0
         1°    2°    3°    4°    1°    2°    3°    4°    1°    2°    3°    4°                      2017                2018                 201
       trim. trim. trim. trim. trim. trim. trim. trim. trim. trim. trim. trim.
               2017                     2018                    2019                            area dell'euro     Giappone       Regno Unito

  Fonte: elaborazioni Banca d’Italia su dati di contabilità nazionale e doganali.     Fonte: Refinitiv.
  (1) Dati destagionalizzati; variazioni percentuali sul trimestre precedente, in     (1) Per l’area dell’euro e il Regno Unito prezzi al consum
  ragione d’anno.
It’s part of a turn in globalization trend
The COVID crisis will reshape the globalization…
      …but most likely through an acceleration of
      preexisting trends
  i) The US-China conflict has not been resolved.
      • What will Biden do?
      • What will the EU position be? (See CAI)
 ii) Companies can no longer take it for granted that tariff
 commitments enshrined by WTO rules will prevent sudden surges
 in protectionism.
      • Will GVCs be reshaped?

 iii) What will happen to multilateralism? (e.g. The WTO dispute
 mechanism has stopped working).
Disruption of multilateralism
The importance of GVCs

Source: Authors’ elaboration of OCED Inter-Country Input Output Tables (available online at
GVCs products
Likely change in risk management
• Just-in production strategy was one of the key bones of global
  production.
• Low probability events with high disruption potential did not
  weigh much into production strategies.
• The pandemics, together with past experiences on data
  breach, natural disasters, and the feared consequences of
  climate change, might expose firms to what once were
  considered tail events.
• This may lead to a new way of thinking, in which resilience will
  feature as prominently as efficiency. For GVCs may imply:
   i) A certain degree of redundancy in production may be optimal
   ii) There can be onshoring of critical goods, which countries may want to
   hold reserves domestically.
Global supply chains will not be the same in the post-COVID-19 world
                                                                                                                                                                         Beata Javorcik

                                                                              Someone will gain
Figure 3                                                                      Which countries will take advantage of rethinking of global value chains?

                                                                '!"                      B#@+$3&'"()*,-#+()E+6+'"@/+&                           G-,",$+')&%",+7)9+,)2+('7)/-6)&2"/+

                                                                             !"#$%&'&(")*$%"+,-&.,+"/#              01,.$%"/#&'&21"*."&2*3-4%+#               533-&2*3-4%+#
                                                                             6"%1$7,*8&'&,94$2.,7+                  63+3*&:,1$%/,#&'&3+1,*&+*"7#23*+          ;+1,*&."74("%+4*$7<
                                                                             =,>+$/,#?&"22"*,/?&(33+@,"*            A,
To Not be Forgotten

WHERE WERE WE?
From fastest growing into a sleeping beauty

         GDP, real growth rate (average per year)

                   1970s      1980s      1990s      2000s

  Italia            3.7         2.5         1.4      0.6

Germania             2.9        1.9         2.1      1.0

 Francia             3.7        2.3         1.9      1.3

 Fonte: EU-Klems
It looks like a lob, but it’s the Italian economy
The Italian turnaround
                                                                  GDP per capita, USA % (PPP)

                                              90%

                                              80%

                                              70%

                                              60%

                                              50%

                                              40%

                                              30%
                                                    1950
                                                           1955
                                                                  1960
                                                                         1965
                                                                                1970
                                                                                       1975
                                                                                              1980
                                                                                                     1985
                                                                                                            1990
                                                                                                                   1995
                                                                                                                          2000
                                                                                                                                 2005
                                                                                                                                        2010
                                                                                                                                               2015
   Fonte: Hassan and Ottaviano, forthcoming
Growth accounting
   • We can decompose GDP growth also as

GY/P = GA                 +   α GK             +   (1 - α) GL
GDP growth   TFP growth       Capital growth        Labor growth
It’s the TFP, stupid!

    Dati: EU-Klems
The Great Unlearning

   Dati: EU-Klems
TFP, what affects it?

      • Institutions: they affect the working environment
        of firms.
      • Investments in IT and R&D: they influence the
        general level of technology and innovation.

      • Allocation of resources: how capital and labor are
        allocated across firms.

      • Managers: they affect the general efficiency of
        firms
Women and the labor market
                               Female Participation (2016)
              80%
                                                                          69%
              70%
                                                                63% 64%
                                                      58% 59%
              60%                         54% 55% 57%
                                  52% 52%
                          48% 50%
              50%
                    40%
              40%

              30%

              20%

              10%

              0%

                       lo …

                              ia
                       Sp 5
                             lia

                    St ania
                       Fr e

                    C o no

                             na

                              ia
                        Re i
                    Gi lgio

                               a
                            cia

                    Ge gna

                               t

                            bi
                             n

                            -1

                           ni

                           ss

                          ez
                         po
                Ita

                          Ci
                           g
                         an
                        UE

                         m
                        iU
                         a
                        Be

                        Ru

                        Sv
                       rm
                      ap

                      at

Fonte: OCSE
Womenomics 4.0

    • What if women had the                        Grecia

      same occupation rate of                        Italia

      men, how much would                        Giappone

      GDP increase?                                    US

                                                 Germania

                                                   Francia

                                                   Svezia

                                                              0% 2% 4% 6% 8% 10% 12% 14% 16% 18% 20%

   Fonte: Goldman Sachs, Womenomics 4.0 (2014)
Why women do not engage in the labor market

                  Answer by age group
                                                                           Answer by education

                Età 25-44       Totale donne                        Alto         Medio        Basso
           Motivi famigliari                       45%      Motivi famigliari                    32%
           (cura di persone…                 31%                                                       47%
                                                            (cura di persone…                          47%
           Non interessa           9%                        Non interessa          5%
         (anche per motivi…                    36%                                   8%
                                                           (anche per motivi…         11%
                                       15%                                               11%
               Scoraggiata                                       Scoraggiata              15%
                                      12%
                                                                                           17%

      In attesa di risposta        9%                                                   14%
                                 4%                      In attesa di risposta        10%
                                                                                     7%

                Maternità        5%                                                  7%
                                1%                                 Maternità        4%
                                                                                    4%
                              0% 10%20%30%40%50%                                 0% 10%20%30%40%50%
Fonte: ISTAT
A lost generation?

                                  NEET (20-24 anni, 2015)
              40%
                    35%
              35%
                          29%
              30%
                                25%
              25%
                                      19% 18%
              20%                             17% 17% 17% 16%
              15%                                               12%
                                                                      10% 10%
              10%
              5%
              0%
                        Co n a

                       St ci a
                           Fr o

                          o a
                                     a

                                   ia
                                     i

                        Gi nia
                                 ito

                        Ge zia
                           Sp a

                                 ne
                       SE ni t
                                  li

                                   i
                                bi

                               l gi

                               ss
                     Re med
                I ta

                              ag

                             po
                               e
                             an

                             Un

                              a
                           lom

                    OC i U
                            Be

                            Ru

                            Sv
                           rm

                          ap
                          at

                          -
                       gn

Fonte: OECD
Italian depopulation
• Population 2017: 60 mln.

• Population 2055: 56.4 mln.

• Natural balance: -7.4 mln.

• Migration contribution: 2.7 mln.

     Dati: ISTAT
Less and less workers
       Working age population (share 15-64)
     70%

     65%

     60%

     55%

     50%

     45%
           1980 1990 2000 2010 2020 2030 2040 2050
Low ability to manage migation flows
                 Migrants with a university degree, (share 25-54 years)

                 60%

                 50%

                 40%

                 30%

                 20%

                 10%

                 0%
                         Italia   Germania Francia          Gran
                                                          Bretagna

Dati: Eurostat
Ask not what your country can do for you

WHAT IS YOU ROLE?
A simple syllogism
1) Firms are at the basis of the economy.

2) The manager are at basis of the functioning of firms.

3) The managers are...
Different views about management
     • management as design:
       – There are no better or worse management
         practices, but different optimal styles
         (Organizational Economics, Woodward)
     • management as technology:
       – We can measure management practices and they
         have a strong impact on firms’ productivity.
       – Bloom, Sadun, Van Reenen (2007-2017)
World management Survey
     •   More than 12.000 firms
     •   34 countries
     •   Biased to medium-large firms, 50-5.000 workers
     •   http://worldmanagementsurvey.org
Main areas (18 questions)
• Operations Management
• Performance Monitoring
• Target Setting
• Talent Management
Scoring

   Fonte: Van Reenen et al. (2017)
Performance tracking

   Fonte: Van Reenen et al. (2017)
Incentives

Fonte: Van Reenen et al. (2017)
Management and productivity

   Fonte: Van Reenen et al. (2017)
Management and TFP gap

   Fonte: Bloom et al. (2015)
Management e performance d’impresa
Managers’ performance varies by firm type

Fonte: Van Reenen et al. (2017)
Managers don’t know how to evaluate the
management of their own firms
• «Excluding yourself, how would you score the management
  performance of your firm?»
Very optimist

   Fonte: Van Reenen et al. (2017)
Critical points
• People are promoted by seniority and not by identifying top
  performers.

• Managers rewards workers equally and do not fix clear targets and
  rewards ex-ante.

• Bad performers are rarely removed.

• More senior managers are not evaluated looking at their capability
  to attract and develop a pool of talents.
GRAZIE!
You can also read