Investor Presentation May 2021 - cloudfront.net
←
→
Page content transcription
If your browser does not render page correctly, please read the page content below
Investor Presentation May 2021

               1
Legal Disclaimer
   Forward-Looking Statements: This presentation may include forward-looking statements within the
   meaning of the Securities Act of 1933 or the Securities Exchange Act of 1934. Forward-looking
   statements are typically identified by words such as “estimate,” “may,” “might,” “believe,” “will,”
   “provided,” “anticipate,” “future,” “could,” “growth,” “plan,” “project,” “intend,” “expect,” “should,”
   “would,” “if,” “seek,” “possible,” “potential,” “likely” or the negative or variations of such terms or
   comparable terminology. These forward-looking statements include comments with respect to our
   objectives and strategies, and the future results of our operations and our business. By their nature,
   these forward-looking statements involve numerous assumptions, uncertainties and descriptions of
   opportunities, both general and specific. The risk exists that these statements may not be fulfilled.
   We caution readers of this presentation not to place undue reliance on these forward-looking
   statements as a number of factors could cause our future results to differ materially from these
   statements. Any results or performance implied by forward-looking statements may be influenced by
   certain factors including, but not limited to, fluctuations in interest rates and stock indices, the effects
   of competition in the areas in which we operate, the overall impact of the COVID-19 pandemic and
   other health emergencies, and changes in economic, political, regulatory and technological
   conditions as well as those factors delineated under the caption “Risk Factors” in our Forms 10-Q
   and Form 10-K, and other documents we file with the SEC from time to time. Therefore, we caution
   that the foregoing list is not exhaustive. Investors should not rely on forward-looking statements to
   make decisions and should carefully consider the aforementioned factors as well as other
   uncertainties and events. We undertake no obligation to revise or update any forward-looking
   statements, whether as a result of new information, future events or otherwise. You are advised to
   consult any additional disclosures that we may make directly to you or through reports that we have
   filed or in the future may file with the SEC, including subsequent annual reports on Form 10-K,
   quarterly reports on Form 10-Q and current reports on Form 8-K.

   Past or Present Performance Disclaimer: This presentation includes information regarding past or
   present performance of the Company. Please note, past or present performance is not a guarantee
   of future performance or future results.

                                                        2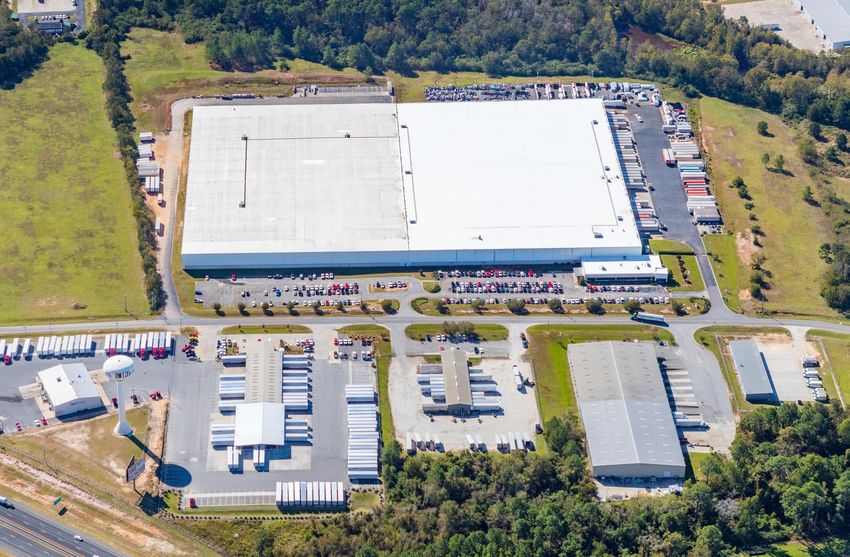
[PIC]       [PIC]   [PIC]       [PIC]   [PIC]   [PIC]

        Gladstone Commercial Corporation

[PIC]       [PIC]   [PIC]       [PIC]   [PIC]   [PIC]

                            3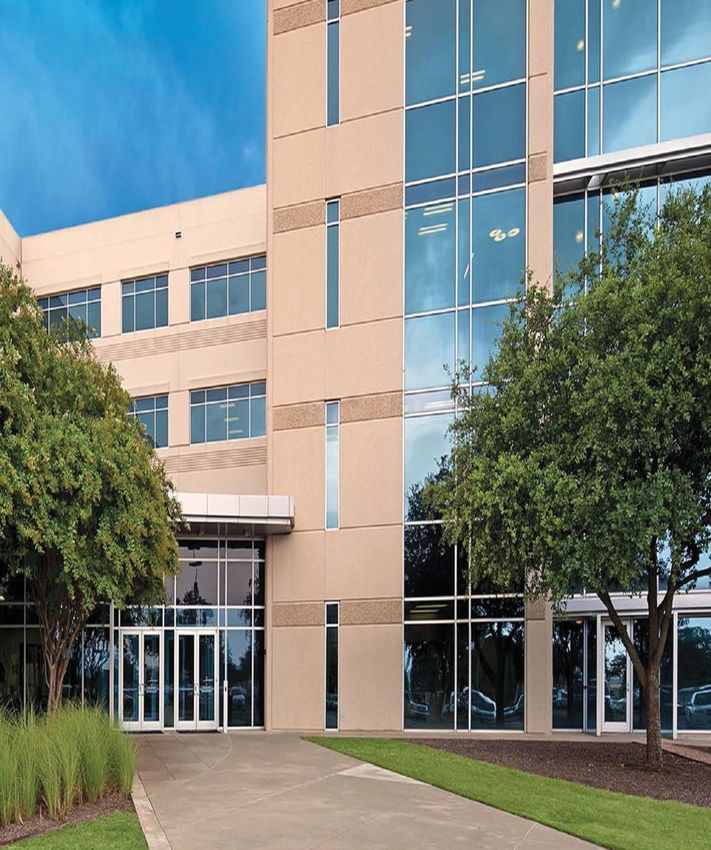
Company Overview

  ▪ Gladstone Commercial Corporation (“Gladstone” or the “Company”) is a publicly owned
    Real Estate Investment Trust (“REIT”) that completed its IPO in 2003 and is listed on
    Nasdaq (Ticker: GOOD)

  ▪ The Company invests in single tenant and anchored multi-tenant net leased assets,
    with an industrial product emphasis

  ▪ The Company owns approximately 15.5 million square feet of predominantly office and
    industrial real estate nationwide

  ▪ Diversified portfolio of 120 properties in 27 states leased to 107 different tenants in 19
    industries

  ▪ The Company is led by a highly-experienced leadership team with over 150 years of
    combined experience

  ▪ Investment activities are credit-focused with a growth market emphasis, seeking
    mission critical facilities of middle market and investment grade companies

    Note: As of 3/31/2021

                                                 4
Gladstone Commercial’s Investment Philosophy

                           5
Gladstone Commercial Overview

                                                                                      Portfolio summary (3/31/2021)

       ▪ IPO in 2003 (Nasdaq: GOOD)                                                   # of Properties                             120

                                                                      (1)             Square feet (mm)                            15.5
       ▪ Market Capitalization: $720mm
                                                                                      Occupancy                                  95.5%
                                                                (1)
       ▪ Enterprise Value: $1,540mm                                                   States                                       27

                                                                                      Tenants                                     107
       ▪ Common stock annual distribution per                                         Industries                                   19
         share: $1.5018
                                                                                      Annual lease revenue (LTM) ($mm)           $134.2

                – Monthly distributions                                               Diluted FFO per Common Share (LTM)         $1.56

                                                                                      Diluted Core FFO per Common Share (LTM)    $1.61
                – No missed or reduced cash
                                                                                      Average Remaining Lease Term              7.2 years
                  distributions since inception

 (1)
       Common Equity is based on the closing common stock price per share as of
 March 31, 2021 of $19.56 and includes effect of convertible securities.

                                                                                  6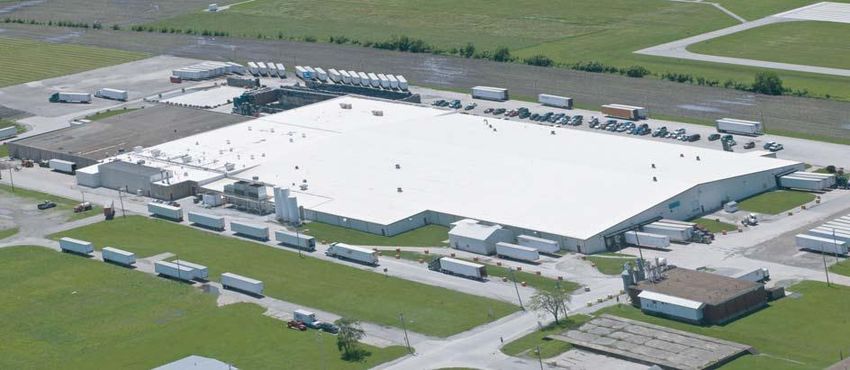
Significant Growth & Diversification Since 2010
   GOOD Portfolio

                                                                             12/31/10            3/31/2021          Variance
                         Total assets ($mm)                              $        410.6      $       1,088.3    $        677.7

                         Properties                                                     65              120                55

         Grew a          Tenants                                                        52              107                55
        diverse
        portfolio        Square feet (mm)                                           6.8                15.5                8.7

                         Occupancy (%)                                             97.2 %              95.5 %             (1.7)%

                         Lease Revenue From Top 5 tenants ($mm)1         $         10.0      $         17.8     $          7.8

                            % of Total Lease Revenue                               24.2 %              13.3 %            (10.9)%

                         Lease Revenues (LTM) ($mm)                      $         41.9      $        134.2     $         92.3
      Revenue
      and cash           Diluted FFO (LTM) ($mm)                         $         14.1      $         56.1     $         42.0
    flow growth
                         Diluted Core FFO (LTM) ($mm)                    $         14.5      $         56.9     $         42.4

                         Net Total Debt / Enterprise Value                         58.9 %              42.4 %            (16.5)%
        Improved
         capital         Net Total Debt + Preferred / Enterprise Value             70.0 %              53.3 %            (16.7)%
        structure
                         Net Total Debt / Gross Assets2                            62.7 %              45.4 %            (17.3)%

    1
    Annualized
    2
    Gross Assets equal total assets before depreciation

                                                                    7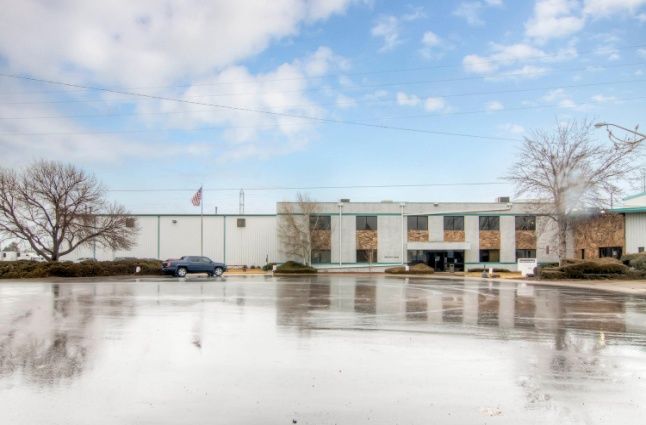
[PIC]   [PIC]        [PIC]       [PIC]   [PIC]   [PIC]

                Investment Strategy

[PIC]   [PIC]        [PIC]       [PIC]   [PIC]   [PIC]

                             8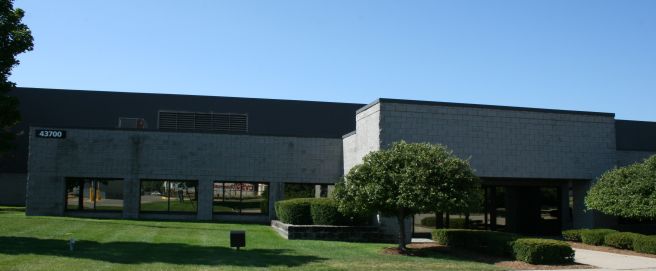
Proven Strategy of Underwriting Real Estate and Tenant
Strength
▪ Tenants operate in a diverse array of industries
▪ Each tenant’s credit underwritten to Gladstone standards, developed over decades of middle
Tenant strength
market corporate lending, investing and buyouts through affiliated funds
▪ Emphasis on tenant’s ability to weather economic downturns
Real estate ▪ Target growth markets across the U.S.
markets
▪ Accumulate assets in specific markets to create valuable portfolios
positioned for
growth ▪ Target submarket emphasis in the "path of growth"
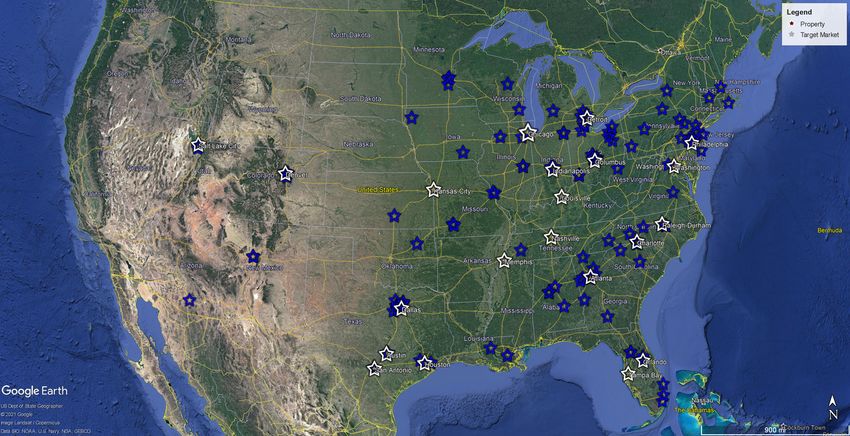
▪ Superior quality assets with flexible configurations, and an industrial emphasis
Real estate ▪ Properties that are critical to tenant’s business
asset quality ▪ Single tenant and anchored multi-tenant industrial and office facilities
▪ Target net leases with 7+ years remaining at acquisition
Transaction ▪ Target transactions of $3mm – $50mm
focus ▪ Type: 3rd party acquisition, sale-leaseback, build-to-suit JV and build-to-suit forward purchase
9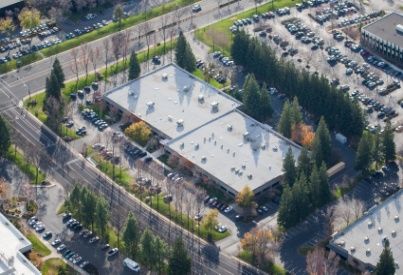
Gladstone Has Achieved Consistent and Disciplined Growth
Historical Investment Volume ($000)

                                                                                                                     Invested in 14       Invested in 8
200,000                                                                                                              growth markets       growth markets
                                                                                                                     at a 7.7%            at a 7.4%
                                                                                                                     weighted             weighted
                                                                                                       Invested in   average cap rate     average cap rate
                                                            145,611                                    4 growth
150,000                                                                                      136,501   markets at
                                                 131,188                                                             129,082        129,160
                                                                                                       an 8.3%
                                                                                                       weighted                                    $280.0 million
                                     107,000                                                           average                                     pipeline, industrial
100,000                                                                                                cap rate                                    focus
                                                                       77,798
                                                                                    66,570                 62,340                                  Invested in 1
                            54,615                                                                                                                 growth market at
    50,000                                                                                                                                         an 8.4% cap rate

              12,300                                                                                                                               11,000
        0
               2010         2011      2012        2013       2014      2015         2016       2017        2018        2019             2020     YTD 2021

                                                                                                                        Iron Mountain - Industrial
Donaldson - Industrial                  Orgill - Industrial Distribution        Morgan Stanley - Office
                                                                                                                        Portfolio

▪     219K SF                           ▪    676K SF                            ▪    102K SF                            ▪     509K SF
▪     Detroit, MI                       ▪    Tifton, GA                         ▪    Salt Lake City, UT                 ▪     TX, LA, AZ, NM
▪     Acquired 10/18                    ▪    Acquired 6/19                      ▪    Acquired 12/17                     ▪     Acquired 12/19
▪     GAAP cap rate: 8.0%               ▪    GAAP cap rate: 8.8%                ▪    GAAP cap rate: 9.3%                ▪     GAAP cap rate: 7.2%

                                                                           10
[PIC] [PIC] [PIC] [PIC] [PIC] [PIC]
Portfolio Overview
[PIC] [PIC] [PIC] [PIC] [PIC] [PIC]
‹#›Portfolio Overview
Geographic ▪ 120 properties across the U.S., located in 27 states
diversity ▪ Focus on secondary growth markets with higher yields
▪ Diverse base of 19 different industries
Tenant and
▪ Primarily office and industrial property types
property
diversity ▪ Focus on mid-size tenants occupying properties ranging from 30-150K SF (office) and
75-500K SF (industrial)
▪ Occupancy has never fallen below 95%
▪ Current occupancy 95.5%
High
occupancy ▪ 2.3% of projected rents expiring through the end of 2021
▪ Of 100+ assets with over $1 billion invested since inception, only two tenant defaults
▪ Sell non-core assets
Periodic
capital ▪ Exited 22 properties in non-core markets since mid-2016
recycling
▪ Re-deploy proceeds in growth markets
Note: As of 3/31/2021
12Diversified Portfolio
Geographic diversification
120 properties spread across 27 states (by annualized straight line rent)
Northeast 16%
Midwest 26%
Southwest
21%
Southeast 37%
Property type diversification
(by annualized straight line rent)
Medical Office 2%
Retail 3%
Office
47%
Industrial
48%
Note: As of 3/31/2021
13High Quality, Diversified Portfolio
% of annualized straight Publicly-traded vs. privately-held tenants
Top tenants % of SF (as % of annualized straight line rent)
line rent
3% 6%
3% 1%
3% 1%
Private 51% Public 49%
2% 1%
2% 1%
All other tenants 87 % 90 %
Industry diversification Tenant credit ratings
(based on annualized straight line rent) (as % annualized straight line rent)
Telecommunications 15%
Rated, Investment
All 13 Others 36% Not Rated, Non-Investment Grade
Grade Equivalent 28%
28%
Diversified/Conglomerate
Rated Investment
Services Grade and Non-
15% Rated Equivalent
56%
Healthcare 10%
Rated, Non-Investment
Banking 7% Grade
Automobile 9% 16% Not Rated, Investment
Building 8%
Grade Equivalent
28%
Note: As of 3/31/2021
14[PIC] [PIC] [PIC] [PIC] [PIC] [PIC]
Financial Performance
[PIC] [PIC] [PIC] [PIC] [PIC] [PIC]
15Summary Historical Performance
Funds from Operations, as adjusted for comparability (Per
Total Revenue ($ in millions)
Share)
$150 $133.2 $1.8 $1.58 $1.55 $1.56
$1.54 $1.53 $1.54
$125 $114.4 $1.5
$106.8
$94.8
$100 $83.8 $86.4 $1.2
$75 $0.9
$50 $34.7 $0.6 $0.40
$25 $0.3
$0 $0
2015 2016 2017 2018 2019 2020 Q1 2015 2016 2017 2018 2019 2020 Q1
2021 2021
Total Gross Assets ($ in millions) Total Distributions ($ in millions)
$1,500.0 $1,455.7 $1,459.3 Preferred Senior Common
$1,358.1
$1,209.2 $70
$1,200.0 $1,153.9
$1,047.6 $60
$991.6
$900.0 $50
$40
$600.0 $51.2
$43.0 $46.1
$30 $39.5
$34.8 $13.4
$31.8
$300.0 $20
$10 $1.0 $0.9 $0.9 $0.8
$0.0 $1.0 $1.0 $0.2
$6.8 $8.1 $9.9 $10.4 $10.8 $11.0
2015 2016 2017 2018 2019 2020 Q1 $0 $2.8
2021 2015 2016 2017 2018 2019 2020 Q1 2021
16Capital Structure Overview
Current Capital Structure as of 3/31/2021 ($000s) Capital Structure Details
(Dollars in $000s, except stock price) Wtd. Average Rate 3/31/2021
$1,600,000
Mortgage Notes Payable, Net 4.22% $ 454,353
Less: Cash & Cash Equivalents (9,871)
Net Mortgage Debt $ 444,482
Line of Credit L+1.65% $ —
Term Note L+1.60%, L+2.00% 208,790
Line of Credit and Term Loan $ 208,790
$1,200,000 Common Equity1, Total Debt, Net $ 653,272
46.6%
Series D - Preferred 7.000% $ 87,739
Series E - Preferred 6.625% 76,536
Series F - Preferred 6.000% 2,954
$368,000 Total Preferred Equity $ 167,229
37%
Diluted Common Shares Outstanding 36,816,655
$800,000
Preferred Stock Price $ 19.56
Equity, 10.9% Implied Common Equity1 Market Capitalization $ 720,134
Enterprise Value $ 1,540,635
Line of Credit &
Term Loan,
13.6% Institutional Stock Ownership2
$400,000 70%
$479,000 60% 55.3% 55.1% 57.0% 57.6% 55.3%
Net Mortgage48% 50.8%
50%
Debt, 28.9% 37.8%
40% 32.6%
30% 26.8%
20%
$0 2013 2014 2015 2016 2017 2018 2019 2020 Q1
Total = $1,541mm 2021
1
Common Equity is based on the closing common stock price per share as of March 31, 2021 of $19.56 and includes effect of OP units and convertible senior common stock.
2
Source: Nasdaq Online
17Liquidity and Debt Overview
Reducing Leverage Fixed vs. Floating Debt
70%
63.2%
59.3% 58.1% 56.9%
60% Floating Rate: 1.1%
48.6% 47.0% 46.8%
50% 46.1% 45.9% 45.4%
40% Hedged Floating
Rate: 34.0%
30%
20%
2012 2013 2014 2015 2016 2017 2018 2019 2020 Q1
2021 Fixed Rate: 64.9%
Net Debt/Gross Assets
Debt maturity schedule ($000s)
Mortgage Maturities Term Loan Maturity
$250,000
30.8%
$200,000
$150,000 19.9%
15.8%
13.9%
$100,000 10.9%
$50,000 5.7%
3.0%
$0
2021 2022 2023 2024 2025 2026 2027+
Note: As of 3/31/2021
18[PIC] [PIC] [PIC] [PIC] [PIC] [PIC]
Management
[PIC] [PIC] [PIC] [PIC] [PIC] [PIC]
19Experienced Leadership Team
David Gladstone, ▪ Current Chairman and CEO of all four Gladstone funds, public companies #7, #8, #9 and #10 in his career
Chairman and CEO ▪ Former Chairman of Allied Capital Commercial (REIT), Allied Capital and American Capital
25+ years of experience ▪ Former board member of Capital Automotive REIT
▪ MBA from Harvard Business School, MA from American University, BA from University of Virginia
▪ Current President of the Company
Bob Cutlip,
▪ Former EVP of First Industrial Realty Trust where he directed the acquisition and development business
President
activities in 26 markets in North America
25+ years of experience ▪ Former Regional EVP of Duke-Weeks Realty, responsible for operations of the Mid-Atlantic region
▪ Former Senior Vice President of Highwoods Properties, responsible for the Mid-Atlantic markets
▪ Former National Chairman of National Association of Industrial and Office Properties
▪ MBA from University of Southern California, MS from Vanderbilt University, BSCE from U.S.A.F. Academy
▪ Current Treasurer of the Company and Gladstone Land, Assistant Treasurer of Gladstone Capital and
Jay Beckhorn,
Gladstone Investment
Treasurer
▪ Former Regional Managing Director of Heavenrich & Co.
25+ years of experience
▪ Former Senior Vice President of Sunrise Senior Living
▪ Former Managing Director of Riggs Bank
▪ MBA from Duke University, BA from Colgate University
20Experienced Leadership Team (cont’d)
Buzz Cooper, Executive ▪ Manages regional acquisition and asset management activities; over 17 years with Gladstone
Vice President, South ▪ Former Principal of Allied Commercial Corporation REIT, where his responsibilities ranged from buying
Central Region loans from RTC and banks to making real estate backed loans
25+ years of experience ▪ BA from Washington and Lee University
EJ Wislar, Senior Vice ▪ Manages regional acquisition and asset management activities
President, Southeast ▪ Former Vice President with United Bankshares and Senior Investment Associate with Prudential Global
Region Investment Management Real Estate Finance
8+ years of experience ▪ BS from Washington and Lee University
Karen Priesman, Senior ▪ Manages asset management activities in the Midwest region
Vice President, Asset ▪ Former Vice President of Hager Pacific Properties with asset management responsibilities across the
Management national portfolio as well as acquisition, disposition, and debt placement responsibilities
25+ years of experience ▪ Former Vice President of Prudential Real Estate Investors (now PGIM) as head of west coast Corporate
Real Estate consulting practice and The Prudential Realty Group where she developed urban trophy office
buildings
▪ MBA from the Wharton School and BSCE from California State University, Long Beach
Perry Finney, Senior ▪ Manages asset management activities in the South Central and Western regions
Vice President, Asset ▪ Former Director of Asset Management at Washington REIT, Alexandria Real Estate Equities and First
Management Potomac
20+ years of experience ▪ BA from Washington College
▪ Former CPA in the Commonwealth of Virginia
21Conclusion
22Summary Highlights
▪ Diversified asset base with a 15% annual compound growth rate since 2012
▪ Proven credit and real estate investment strategy has maintained high occupancy
(>95%) since 2003
▪ Strengthened credit profile with net total debt to gross assets down to 45.4%
▪ Focused on growth with limited lease expirations through 2022, and with an
emphasis on increasing the industrial allocation
Note: As of 3/31/2021
23Appendix
1. Condensed Consolidated Statements of Operations
2. Funds From Operations (FFO) and Core FFO
3. Condensed Consolidated Balance Sheets
4. Debt Summary
5. External Management Structure Qualities
24Condensed Consolidated Statements of Operations
($ in thousands, except per share amounts) For the three months ended (unaudited)
3/31/2021 12/31/2020 3/31/2020
Operating revenues
Lease revenue $ 34,677 $ 32,866 $ 33,619
Total operating revenues $ 34,677 $ 32,866 $ 33,619
Operating expenses
Depreciation and amortization $ 16,710 $ 13,348 $ 14,096
Property operating expenses 6,561 6,906 6,213
Base management fee 1,444 1,429 1,412
Incentive fee 1,236 999 1,055
Administration fee 297 404 438
General and administrative 656 854 878
Impairment charge — 716 —
Total operating expenses $ 26,904 $ 24,656 $ 24,092
Other (expense) income
Interest expense $ (7,164) $ (6,391) $ (7,252)
(Loss) gain on sale of real estate, net (882) 6,912 (12)
Other income (expense) 311 187 (5)
Total other expense, net $ (7,735) $ 708 $ (7,269)
Net income $ 38 $ 8,918 $ 2,258
Net loss (income) attributable (available) to non-controlling interests 41 (86) 9
Net income attributable to the company $ 79 $ 8,832 $ 2,267
Distributions attributable to Series D, E, and F preferred stock (2,847) (2,836) (2,678)
Distributions attributable to senior common stock (187) (201) (208)
Net (loss) income (attributable) available to common stockholders $ (2,955) $ 5,795 $ (619)
Weighted average common shares outstanding and Non-controlling OP Units
Basic and diluted 36,214,406 35,007,960 34,136,179
25Funds From Operations (FFO) and Core FFO
($ in thousands except per share amounts) For the three months ended (unaudited)
3/31/2021 12/31/2020 3/31/2020
Net income $ 38 $ 8,918 $ 2,258
Less: Distributions attributable to preferred and senior common stock (3,034) (3,037) (2,886)
Net (loss) income (attributable) available to common stockholders and Non-controlling OP
Unitholders $ (2,996) $ 5,881 $ (628)
Adjustments:
Add: Real estate depreciation and amortization $ 16,710 $ 13,348 $ 14,096
Add: Impairment charge — 716 —
Add: Loss on sale of real estate, net 882 — 12
Less: Gain on sale of real estate, net — (6,912) —
FFO available to common stockholders and Non-controlling OP Unitholders - basic $ 14,596 $ 13,033 $ 13,480
Add: Convertible senior common distributions 187 201 208
FFO available to common stockholders and Non-controlling OP Unitholders - diluted $ 14,783 $ 13,234 $ 13,688
FFO available to common stockholders and Non-controlling OP Unitholders - basic $ 14,596 $ 13,033 $ 13,480
Add: Asset retirement obligation expense 30 30 41
Add: Loan defeasance costs 669 — —
(Less) Add: PACE financing amortization, net (8) 36 31
(Less) Add: Acquisition related expenses $ (122) $ 78 $ 7
Core FFO available to common stockholders and Non-controlling OP Unitholders - basic $ 15,165 $ 13,177 $ 13,559
Add: Convertible senior common distributions 187 201 208
Core FFO available to common stockholders and Non-controlling OP Unitholders - diluted $ 15,352 $ 13,378 $ 13,767
Weighted average common shares outstanding and Non-controlling OP Units - basic 36,214,406 35,007,960 34,136,179
Weighted average common shares outstanding and Non-controlling OP Units - diluted 36,806,562 35,636,223 34,791,121
FFO per weighted average share of common stock and Non-controlling OP Unit - basic $ 0.40 $ 0.37 $ 0.39
FFO per weighted average share of common stock and Non-controlling OP Unit - diluted $ 0.40 $ 0.37 $ 0.39
Core FFO per weighted average share of common stock and Non-controlling OP Unit - basic $ 0.42 $ 0.38 $ 0.40
Core FFO per weighted average share of common stock and Non-controlling OP Unit - diluted $ 0.42 $ 0.38 $ 0.40
Distributions declared per share of common stock and Non-controlling OP Unit $ 0.37545 $ 0.37545 $ 0.37545
26Condensed Consolidated Balance Sheets
3/31/2021
($ in thousands) (unaudited) 12/31/2020
ASSETS
Real estate, at cost $ 1,143,960 $ 1,128,683
Less: accumulated depreciation 240,351 228,468
Total real estate, net 903,609 900,215
Lease intangibles, net 114,057 117,379
Real estate and related assets held for sale, net — 8,498
Cash and cash equivalents 9,871 11,016
Restricted cash 4,734 5,060
Funds held in escrow 7,936 9,145
Right-of-use assets from operating leases 5,528 5,582
Deferred rent receivable, net 36,823 36,555
Other assets 5,785 4,458
TOTAL ASSETS $ 1,088,343 $ 1,097,908
LIABILITIES AND STOCKHOLDERS’ EQUITY
LIABILITIES
Mortgage notes payable, net $ 454,353 $ 456,177
Borrowings under revolver and term loan, net 208,790 212,515
Deferred rent liability, asset retirement obligation and other liabilities, net 52,751 53,893
TOTAL LIABILITIES $ 715,894 $ 722,585
MEZZANINE EQUITY
Series D and E redeemable preferred stock, net $ 159,286 $ 159,286
TOTAL MEZZANINE EQUITY $ 159,286 $ 159,286
STOCKHOLDERS’ EQUITY
Senior common stock 1 1
Common stock 36 35
Series F redeemable preferred stock — —
Additional paid in capital 639,053 626,533
Accumulated other comprehensive income (1,921) (4,345)
Distributions in excess of accumulated earnings (425,422) (409,041)
TOTAL STOCKHOLDERS' EQUITY $ 211,747 $ 213,183
OP Units held by Non-controlling OP Unitholders 1,416 2,854
TOTAL EQUITY $ 213,163 $ 216,037
TOTAL LIABILITIES, MEZZANINE EQUITY AND EQUITY $ 1,088,343 $ 1,097,908
27Debt Summary
($ in thousands)
Weighted Average Interest Principal Balance
Principal Maturity Date Rate as of Outstanding as of
3/31/2021 3/31/2021
2021 3.30% 10,973
2022 4.65% 98,016
2023 4.39% 66,043
2024 3.93% 39,083
2025 4.03% 32,642
2026 4.39% 47,614
2027 4.34% 83,912
2028 3.71% 14,809
2029 4.74% 11,489
2030 3.23% 41,437
2031 3.24% 5,476
2037 4.63% 6,346
Contractual Mortgage Notes Payable: 4.22% $ 457,840
Premiums (Discounts), net: (168)
Total Mortgage Notes Payable: $ 457,672
Variable-Rate Line of Credit:
2023 LIBOR +1.90% $ —
Variable-Rate Term Loan Facility:
2024 LIBOR +1.85% $ 160,000
2026 LIBOR +2.00% 50,000
Total Mortgage Notes Payable and Line of Credit 3.52% $ 667,672
28External Management Structure Qualities
• President, CFO, Acquisitions, Asset Management and Accounting staff exclusively
dedicated to Gladstone Commercial
▪ Benefit: Aligned with shareholder interests
• The 2015 revision to the fee structure places overhead costs generally in line with the
overall average for internally managed REITs of this size. The 2020 revision to the fee
structure is economically consistent with the prior revision.
▪ Benefit: G&A costs comparable with the public REIT industry
• The external structure provides access to internal credit underwriters across
numerous industries
▪ Benefit: Can quickly assess tenant’s creditworthiness and ability to weather
economic downturns
• Legal, Compliance, Human Resources, and IT shared among four funds
▪ Benefit: Reduced costs to shareholders
The results of organizational structure benefits:
• Occupancy never below 95% since IPO in 2003
• Distributions never lowered nor missed since 2003
• Cost structure aligned with self-managed REITs with the added benefit of access to
proven credit underwriting capability and evidenced by consistent high occupancy
29‹#›
You can also read