Ecosystem-based metrics provide better targets than explicit extinction targets for biodiversity frameworks
←
→
Page content transcription
If your browser does not render page correctly, please read the page content below
Ecosystem-based metrics provide better targets than explicit extinction targets
                            for biodiversity frameworks
                           Alice C. Hughes1*, Huijie Qiao2*, Michael C. Orr3

 5   Affiliations:
            1
             Landscape Ecology Group, Center for Integrative Conservation, Xishuangbanna
     Tropical Botanical Garden, Chinese Academy of Sciences, Menglun, Mengla, Yunnan, 666303,
     PR China
            2
            Key Laboratory of Animal Ecology and Conservation Biology, Institute of Zoology,
10   Chinese Academy of Sciences, Beijing, 100101, PR China.
            3
           Key Laboratory of Zoological Systematics and Evolution, Institute of Zoology, Chinese
     Academy of Sciences, Beijing 100101, P.R. China.
            *ach_conservation2@hotmail.com; qiaohj@ioz.ac.cn

15

20

25

30

                                                  1
35   One Sentence Summary: Extinction fails as a biodiversity metric.
     The post-2020 global biodiversity framework has the potential to shape the future of life on Earth, so
     great care must be taken in deciding its aims. The failure of all but one of the Aichi Targets requires a
     rethinking of prior agreements [1], and conservationists are now exploring new types of targets that are
     more likely to succeed. One commonly-suggested potential metric is extinction, with the goal of avoiding
40   some number or percent of species going extinct within a specific timeframe [2]. Whilst extinction seems
     like a logical and conducive metric for global conservation targets, and certainly be prevented, measuring
     the loss of high-quality representative habitat has often been used as a surrogate in global targets. Here,
     we argue that extinction is unsuitable as a metric for biodiversity frameworks: it fails to meet the SMART
     (Specific, Measurable, Aspirational, Realistic, Timebound) target criteria. That is, although extinction is
45   undeniably important, it is not feasibly measurable, and does not provide realistic targets to control.
     Extinction is a nearly universally understood concept, defined generally by the complete loss of a species.
     More specifically, the term extinction was formerly defined as any species not recorded in the wild for 50
     years but has now been updated to “there is no reasonable doubt that the last individual has died” [3]. As
     a consequence of these metrics, only around 538 species have been documented as extinct since 1500,
50   likely a dramatic underestimate of true numbers of extinctions [4]. To understand and measure extinctions
     meaningfully, several criteria need to be met, including whether extinction rates can truly be measured
     and if such target metrics can be created. Herein, we discuss these fundamental questions, and detail why
     the answers preclude use of extinction as a target metric for biodiversity. Although intuitive and likely
     appealing to the public, we cannot prioritize these qualities above the concept’s actual value and
55   practicality in conservation practice.

     Can it be measured?
     The first question that needs to be asked for any target is “can it be measured,” as targets that cannot be
     measured cannot be met. In the case of extinction, the answer is irrefutably no, because (1) The metrics of
60   extinction rates require time for confirmation. Further, (2) the majority of species globally are
     undescribed and untracked, and (3) those species that have been described are mostly unmapped.
     Undescribed species represent a major barrier to effective conservation, because we simply cannot protect
     the unknown, or measure its rate of loss. Although new attention has recently been paid to the predicted
     millions of undescribed invertebrate species in light of potential declines ([5]; Figure 1), many
65   undescribed species remain across the tree of life (Table S1). Even among vertebrates, the number of
     described amphibians has increased by 25% since 2004 [6], and 1079 new mammals have been described
     in the last 13 years (https://www.departments.bucknell.edu/biology/resources/msw3/); 251 new reptiles
     have been described in just the last 1.5 years (http://reptile-database.reptarium.cz/). Thus, even for
     vertebrates, large numbers of species remain undescribed; as a result, measuring extinction rates
70   accurately is likely impossible without untenable assumptions about relative total richness of undescribed
     and undiscovered species. These trends exist in other groups: ~2000 plant species are described annually
     [7], and 2189 fungi were described in 2017 alone [8].
     Considering species that have been assessed in terms of conservation status in the IUCN “Redlist”
     (https://www.iucnredlist.org/), only 9.6% of all described plant species have been assessed (estimated
75   0.54% when including undescribed species [7], and among these species, 7% remain data deficient. Even
     worse coverage exists for fungi, with only 0.2% of described species assessed, representing 0.002% of

                                                          2
estimated species (based on a conservative estimate based on [8, 9]. Estimates are similar for terrestrial
arthropods (although estimated species numbers vary widely [10]), with ~0.9% of described species
assessed, representing 0.15% of estimated total species. It seems highly unlikely that the data required to
80 assess these groups will suddenly become available in the near future.
It could be argued simply that too many non-vertebrates exist to be considered in such a target, and that
extinction-based targets can be developed that focus solely on vertebrates, for which monitoring is easier,
given a larger research community, greater research funding, easier detection, and more complete
assessment. Even accepting this gross oversimplification, however, issues remain. While >90% of
85 described mammals and bird species have been evaluated by IUCN (90.0% and 95.6%, respectively),
corresponding numbers are only 83.5% for amphibians and 70.0% for reptiles based on the most uptodate
catalogues for each species (see supplements). Overall, 84.0% of vertebrates have been assessed, with
5778 described and an unknown number of undescribed vertebrate species unassessed. Given that
mammals and birds are poor indicators of diversity and risk in other groups [11], more detailed
90 assessments are clearly needed outside these two groups.
What is more, many IUCN extinction risk assessments are now outdated, even if they are meant to be
updated decadally. For instance, an estimated 61% of amphibian assessments were outdated by 2016, and
only 45% of amphibian species described between 2004 and 2016 have been assessed [6]. Hence, even
though information for terrestrial vertebrates is orders of magnitude better than that for other taxa, it is
95 still too poor to serve effectively as the basis for an extinction-based target, especially when we consider
that120 not account for what proportion of the species’ range is protected. In terms of actual area of protected
range, 9245 (30%) vertebrate species haveIn sum, we are not yet at a point at which meaningful species-based targets can be developed, even for
assaying true levels of protection. As a consequence, we suggest that global initiatives should better focus
on more feasible and effective, ecosystem-based targets, via activities such as Redlisting ecosystems and
165 assessing degree of protection. If we wish to conserve the highest number of species possible, we need to
maintain intact, representative habitats, and use new technologies to monitor ecosystem health and
maximize effective conservation.
5170 References and Notes:
1. S. Woodley, et al. A bold successor to Aichi Target 11. Science. 365, 649-650 (2019).
2. M. D. A. Rounsevell, et al. A biodiversity target based on species extinctions. Science. 368,
1193-1195 (2020).
3. W. K. Smith & A. R. Solow. Missing and presumed lost: extinction in the ocean and its
175 inference. ICES Journal of Marine Science. 69, 89-94 (2012).
4. S. H. M. Butchart, Going or gone: defining Possibly Extinct' species to give a truer picture of
recent extinctions. Bulletin-British Ornithologists Club. 126, 7 (2006).
5. J. A. Harvey et al. International scientists formulate a roadmap for insect conservation and
recovery. Nature Ecology & Evolution. 4, 174-176 (2020).
180 6. B. Tapley, et al. The disparity between species description and conservation assessment: A
case study in taxa with high rates of species discovery. Biological Conservation. 220, 209-214
(2018).
7. K. J. Willis. State of the world's plants report-2017. Royal Botanic Gardens, (2017).
8. K. J. Willis. State of the World’s Fungi 2018. Royal Botanic Gardens, (2018).
185 9. B. Wu, et al. Current insights into fungal species diversity and perspective on naming the
environmental DNA sequences of fungi. Mycology. 10, 127-140 (2019).
10. N. E. Stork. How many species of insects and other terrestrial arthropods are there on Earth?
Annual review of entomology. 63, 31-45 (2018).
11. A. C. Hughes. Understanding the drivers of Southeast Asian biodiversity loss. Ecosphere. 8,
190 e01624 (2017).
12. E.S. Brondizio, et al., Global assessment report on biodiversity and ecosystem services of the
Intergovernmental Science-Policy Platform on Biodiversity and Ecosystem Services. IPBES
Secretariat: Bonn, Germany (2019).
13. B. R. Scheffers et al. The world's rediscovered species: back from the brink? PloS one. 6,
195 e22531 (2011).
14. A. C. Hughes. Mapping priorities for conservation in Southeast Asia. Biological
Conservation. 209, 395-405 (2017).
15. I. R. Staude, L. M. Navarro, & H. M. Pereira. Range size predicts the risk of local extinction
from habitat loss. Global Ecology and Biogeography. 29, 16-25 (2020).
200 16. P. F. Donald, et al. The prevalence, characteristics and effectiveness of Aichi Target 11′ s
“other effective area‐based conservation measures” (OECMs) in Key Biodiversity Areas.
Conservation Letters. 12, e12659 (2019).
17. P De Frenne, et al. Global buffering of temperatures under forest canopies. Nature Ecology
& Evolution. 3, 744-749 (2019).
6205 M. C. Orr, et al. Revision of the bee group Anthophora (Micranthophora) (Hymenoptera:
Apidae), with notes on potential conservation concerns and a molecular phylogeny of the genus.
Zootaxa. 4511, 1-193 (2018).
Data links- all accessed on 24/06/2020
210 IUCN data: https://www.iucnredlist.org/resources/grid/spatial-data
Bird data: http://datazone.birdlife.org/species/requestdis
Reptiles: http://www.gardinitiative.org/
Protected areas: https://www.protectedplanet.net/ Plus on request from Chinese Ministry of
ecology and environment
215 Described species estimates
Mammals: https://www.departments.bucknell.edu/biology/resources/msw3/
Birds: https://www.birds.cornell.edu/clementschecklist/wp-content/uploads/2019/08/eBird-
Clements-v2019-integrated-checklist-August-2019.xlsx
Reptiles: http://reptile-database.reptarium.cz/
220 Amphibians: [6]
Fungi: [8, 9]
Plants: [7]
Terrestrial arthropods: [10]
225 Acknowledgments: We would like to thank Townsend Peterson for comments on an early
version of this manuscript.
Funding:
ACH was supported by Chinese National Natural Science Foundation (Grant
230 #:U1602265, Mapping Karst Biodiversity in Yunnan). the Strategic Priority Research Program
of the Chinese Academy of Sciences(Grant No.XDA20050202).Supported by the High-End
Foreign Experts Program of Yunnan Province (Grant #:Y9YN021B01, Yunnan Bioacoustic
monitoring program). The CAS 135 program (No. 2017XTBG-T03), the Chinese Academy of
Sciences Southeast Asia Biodiversity Research Center fund (Grant #:Y4ZK111B01). MCO was
235 supported by the NSFC International Young Scholars Program (31850410464) and the CAS
President's International Fellowship Initiative (2018PB0003, 2020PB0142).
Author contributions: ACH developed the initial idea; ACH, MCO and HJQ developed
methods and outline; HJQ ran spatial analysis; ACH summarized data and led in writing; All
240 authors edited the manuscript.
Competing interests: None
7Data and materials availability: Data are freely available online, links are provided below
Supplementary Materials:
245 Materials and Methods:
Global protected areas (PA) were downloaded in shapefile form from the World Database on
Protected Areas (WDPA) via https://www.protectedplanet.net/. The protected are dataset for
China is not complete in the global database, so we merged the WDPA with the Chinese PA
(Ministry of Ecology and Environment) by joining the international, national, regional types in
250 WDPA with Chinese PA together as the world PA data. To get the distribution proportion in PA
of each species, we overlapped the world PA with the IUCN distribution (whilst still accounting
for overlapping designations within protected areas to ensure areas were only measured once).
All the analysis above were run in R v4.0 (R Core Team, 2020).
The shared code can be found via https://github.com/qiaohj/protected_area.
255 Once this was done we summarized the protected area coverage for different groupings of
species as well as the overall range sizes to quantify how many species had different degrees of
protected area coverage to assay their vulnerability and the effectiveness of current protected
area measures.
Estimates on species described, those estimated, and the percentage assessed were drawn from
260 the literature and the IUCN Redlist and the links provided.
Tables S1: Numbers and percentages of non-vertebrate taxa described and estimated as well as
those included in the Redlist
8Fig. 1. The rare, recently-described bee Anthophora escalante (Orr et al. 2018) is only currently
known from two protected areas in Utah, the recently-downsized Grand Staircase-Escalante
265 National Monument and Canyonlands National Park. An example of our lack of knowledge for
most taxa and our inability to protect them.
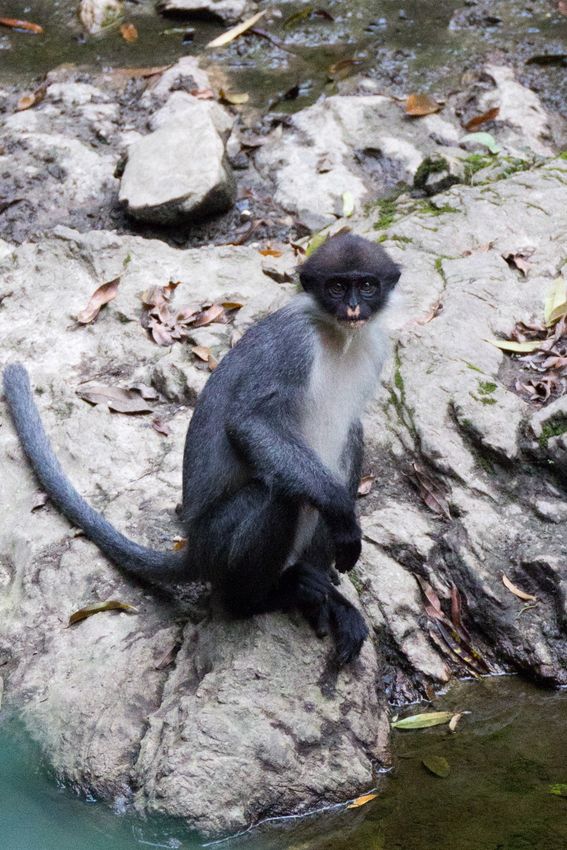
9270 Fig. 2. Miller’s langur (Presbytis canicrus) a laxarus taxa which has been considered extinct
multiple times and was most recently proven extant in 2012. Photo by Brent Loken (CC).
10275
Supplementary Materials for
280 Ecosystem-based metrics provide better targets than explicit extinction targets
for biodiversity frameworks
Alice C. Hughes1*, Huijie Qiao2*, Michael C. Orr3
Affiliations:
1
Landscape Ecology Group, Center for Integrative Conservation, Xishuangbanna
285 Tropical Botanical Garden, Chinese Academy of Sciences, Menglun, Mengla, Yunnan, 666303,
PR China
2
Key Laboratory of Animal Ecology and Conservation Biology, Institute of Zoology,
Chinese Academy of Sciences, Beijing, 100101, PR China.
3
Key Laboratory of Zoological Systematics and Evolution, Institute of Zoology, Chinese
290 Academy of Sciences, Beijing 100101, P.R. China.
*ach_conservation2@hotmail.com; qiaohj@ioz.ac.cn
295 This PDF file includes:
Tables S1
1Table S1: Numbers and percentages of non-vertebrate taxa described and estimated as well as those included in the
Redlist. Data links are provided with references
inredlis % described %estimated
Group dd t %dd described estimate species species
Fungi 22 285 7.72 120000 12000000 0.22 0.0022
Plantae 2774 40468 6.85 390900 7000000 9.64 0.5385
Arthropoda 3735 13170 28.36 1000000 7000000 0.94 0.1348
305
2You can also read