Effects of prolonged type 2 diabetes on changes in peripapillary retinal nerve fiber layer thickness in diabetic eyes without clinical diabetic ...
←
→
Page content transcription
If your browser does not render page correctly, please read the page content below
www.nature.com/scientificreports
OPEN Effects of prolonged type
2 diabetes on changes
in peripapillary retinal nerve
fiber layer thickness in diabetic
eyes without clinical diabetic
retinopathy
Min‑Woo Lee1, Hyung‑Bin Lim2, Min‑Su Kim2, Gi‑Seok Park2, Ki‑Yup Nam3,
Young‑Hoon Lee1 & Jung‑Yeul Kim2*
To identify the effects of prolonged type 2 diabetes (T2DM) on changes in peripapillary retinal nerve
fiber layer (pRNFL) thickness in patients without clinical diabetic retinopathy. Subjects were divided
into two groups: controls and patients with T2DM (DM group). After the initial visits, the pRNFL
thicknesses were measured three more times at 1-year intervals. Subgroup analyses were performed
in patients with T2DM duration ≥ 10 years. The mean pRNFL thickness at each visit was 95.8 ± 8.1,
95.4 ± 8.3, 94.9 ± 8.1, and 94.5 ± 8.3 μm in the control group (P = 0.138) (n = 55); and 93.4 ± 9.1,
92.1 ± 9.3, 90.9 ± 9.3, and 89.5 ± 9.2 μm in the DM group (P < 0.001) (n = 85). The estimated rate of
reduction in mean pRNFL thickness was − 0.45 μm/year in the control group and − 1.34 μm/year in the
DM group, respectively. In the DM group, the BCVA and HbA1c (both P = 0.001) were significant factors
associated with pRNFL reduction. In patients with T2DM duration ≥ 10 years, the estimated pRNFL
reduction rate was − 1.61 μm/year, and hypertension was a significant factor affecting the pRNFL
reduction (P = 0.046). We confirmed rapid pRNFL reduction over time in T2DM, and the reduction rate
was higher in patients with T2DM ≥ 10 years. Additionally, BCVA and HbA1c levels were significantly
associated with the change in pRNFL thickness in T2DM patients.
Type 2 diabetes (T2DM) constitutes a global health problem and induces macrovascular and microvascular
complications causing more than 2 million deaths every y ear1. Moreover, its prevalence has increased from 108
million in 1980 to 422 million in 2014, and is expected to increase to 629 million by 2045 because of lifestyle
changes2–4. This increase in T2DM is associated with an increase in diabetic retinopathy (DR)5. DR is one of the
most common complications of T2DM and is the leading cause of preventable blindness among working-age
subjects in most developed c ountries5,6. Even before clinical DR emerges, many studies have reported functional
and anatomical damages on the retina by T2DM.
Diabetic retinal neurodegeneration (DRN) is one of the representative damages on the retina by T2DM
showing before clinical DR. Metabolic pathways triggered by hyperglycemia such as the polyol and hexosamine
pathways, the de novo synthesis of diacylglycerol-protein kinase C, and the production of free radicals are
closely associated with DRN, which causes the apoptosis of retinal ganglion c ells7,8. Such retinal ganglion cell
loss would result in a reduction in the thickness of the retinal nerve fiber layer (RNFL). Vujosevic et al.9 reported
early changes in the peripapillary microvasculature that correlated with peripapillary retinal nerve fiber layer
(pRNFL) thinning in T2DM patients without DR. Lim et al.10 found that T2DM was associated with accelerated
pRNFL loss regardless of whether or not DR progression, suggesting that DRN may proceed the microvascu-
lar abnormalities associated with DR progression. Additionally, they reported that the T2DM duration was
1
Department of Ophthalmology, Konyang University College of Medicine, Daejeon, Republic of
Korea. 2Department of Ophthalmology, Chungnam National University College of Medicine, #640 Daesa‑dong,
Jung‑gu, Daejeon 301‑721, Republic of Korea. 3Department of Ophthalmology, Chungnam National University
Sejong Hospital, Sejong, Republic of Korea. *email: kimjy@cnu.ac.kr
Scientific Reports | (2021) 11:6813 | https://doi.org/10.1038/s41598-021-86306-y 1
Vol.:(0123456789)www.nature.com/scientificreports/
associated with longitudinal changes in pRNFL thickness. However, few studies have explored the severity of
DRN according to T2DM duration.
The purpose of this study was to identify the effects of prolonged T2DM on longitudinal changes in pRNFL
by comparing pRNFL thickness of normal individuals and DM patients.
Methods
Patients. This prospective, longitudinal, observational study adhered to the tenets of the Declaration of Hel-
sinki and was approved by the Institutional Board and Ethics Committee of Chungnam National University
Hospital, Daejeon, Republic of Korea. Patients with T2DM were enrolled in the ‘Changes in the inner retina in
diabetes patients with or without diabetic retinopathy’, which is an ongoing prospective study. The control group
included patients diagnosed with a unilateral epiretinal membrane, macular hole, or intraocular lens dislocation;
all of the fellow eyes without any ophthalmic disease. Written informed consent was obtained from all subjects.
Subjects were divided into two groups: controls and patients with T2DM (DM group). Additionally, we
performer subgroup analyses for T2DM patients with DM duration ≥ 10 years in the DM group. All patients
underwent complete ophthalmic examinations including measurements of best-corrected visual acuity (BCVA),
intraocular pressure, the spherical equivalent, and axial length; a detailed fundus examination; and spectral-
domain optical coherence tomography (OCT). After the initial visit, three further examinations were performed
times at 1-year intervals. The exclusion criteria were a history of any systemic disease other than T2DM and
hypertension, any ophthalmic diseases such as glaucoma, retinal diseases, or neuro-ophthalmic diseases, an
axial length ≥ 26.0 mm, any prior intraocular surgery except cataract extraction, a BCVA < 20/40, and intraocular
pressure > 21 mm Hg as previous s tudies10. We also excluded patients exhibiting clinical evidence of DR such
as retinal hemorrhages or microaneurysm using fundus photo and dilated fundus examination. One eye was
randomly selected in patients in whom both eyes met the inclusion criteria.
OCT measurements. OCT measurements were performed by a skilled examiner using a Cirrus HD OCT
(version 10.0; Carl Zeiss Meditec, Dublin, CA, USA). The pRNFL thicknesses were measured from optic disc
cube scans. A 200 × 200 scan optic cube (measured in pixels) scanning protocol was used to image the optic disc
and pRNFL over a 6 × 6-mm region of the optic nerve head. Images of signal strength < 7, any motion artifact,
involuntary saccade, obvious decentration misalignment, or algorithm segmentation failure identified by the
auto segmentation error on B-scan images were excluded as previous s tudies10.
Statistical analyses. Demographic characteristics and ocular parameters were compared via the inde-
pendent t-test and the chi-squared test. Repeated-measures ANOVA was used to analyze longitudinal changes
in the pRNFL thicknesses in each group. Linear mixed models were performed to reveal the reduction rate of the
pRNFL in each group and differences in such reduction over time among the groups. The variables that may have
any effect on the results and can be assessed in the clinical situation such as age, sex, the BCVA, the spherical
equivalent, intraocular pressure, axial length, follow-up duration, baseline central macular thickness, baseline
ganglion cell-inner plexiform layer (GC-IPL) thickness, baseline pRNFL thickness, HbA1c level, hypertension
status, and the interaction between follow-up duration and group were included as fixed effects, and the eye
levels were included as the random intercept. Diagnosis-stratified mixed models were fitted to identify factors
associated with longitudinal changes in mean pRNFL thickness in each group.
Results
Demographics. A total of 140 eyes were included: 55 in the control group, and 85 in the DM group. The
mean age in each group was 61.1 ± 8.7 and 61.1 ± 8.2, respectively (P = 0.998) (Table 1). The sex, BCVA, spherical
equivalent, axial length, and optic nerve head parameters did not differ significantly among the groups. The DM
duration was 9.78 ± 6.48, and the HbA1C level was 7.00 ± 0.97 in the DM group.
Peripapillary retinal nerve fiber layer thicknesses. The mean pRNFL thickness in the control group
at each visit was 95.8 ± 8.1, 95.4 ± 8.3, 94.9 ± 8.1, and 94.5 ± 8.3 μm, which showed a continuous reduction, but
was not significant statistically (P = 0.138) (Fig. 1). The pRNFL thicknesses of the four segments also showed
a decreasing trend, which did not differ significantly. In the DM group, the mean pRNFL thicknesses at each
visit were 93.4 ± 9.1, 92.1 ± 9.3, 90.9 ± 9.3, and 89.5 ± 9.2 μm, which showed a significant reduction over time
(P < 0.001). The superior and inferior segment thicknesses also decreased significantly over time (both P < 0.001)
(Supplementary table).
Reduction rates of pRNFL thickness. The estimated mean reduction rates of pRNFL thickness were
− 0.45 μm/year ear in the control group and − 1.34 μm/year in the DM group (Table 2). The thicknesses of all
four segments decreased significantly over time in the DM group. The reduction of mean pRNFL thickness over
time was significantly different between the control and DM groups (P < 0.001).
Factors associated with changes in mean pRNFL thickness. Baseline pRNFL thickness was signifi-
cantly associated with pRNFL reduction in both groups (Table 3). In the DM group, age (estimate = − 0.27 μm/
year, P = 0.010), BCVA (estimate = − 51.97 μm/year, P = 0.001), HbA1c level (estimate = − 3.05 μm/year,
P = 0.001), follow-up duration (estimate = − 1.28 μm/year, P < 0001), and baseline GC-IPL (estimate = 0.65 μm/
year, P < 0.001) were significantly associated with pRNFL reduction.
Scientific Reports | (2021) 11:6813 | https://doi.org/10.1038/s41598-021-86306-y 2
Vol:.(1234567890)www.nature.com/scientificreports/
Controls (n = 55) DM group (n = 85) P value
Age (mean ± SD, years) 61.1 ± 8.7 61.1 ± 8.2 0.998
Sex (male, %) 28 (50.9%) 41 (48.2%) 0.863
BCVA (mean ± SD) − 0.016 ± 0.057 0.008 ± 0.084 0.057
SE (mean ± SD, diopters) 0.11 ± 1.31 − 0.316 ± 1.63 0.115
IOP (mean ± SD, mmHg) 14.6 ± 2.7 15.4 ± 3.0 0.116
Axial length (mean ± SD, mm) 23.7 ± 1.0 23.9 ± 0.9 0.194
Hypertension (n, %) 45 (81.8%) 58 (68.2%) 0.081
DM duration (mean ± SD, years) 0 9.78 ± 6.48 N/A
HbA1C (mean ± SD, %) N/A 7.00 ± 0.97 N/A
m 2)
ONH rim area (mean ± SD, m 1.32 ± 0.26 1.23 ± 0.24 0.065
m2)
Disc area (mean ± SD, m 1.90 ± 0.29 1.96 ± 0.38 0.339
Cup-disc ratio (mean ± SD) 0.53 ± 0.14 0.56 ± 0.18 0.218
CMT (mean ± SD, μm) 252.9 ± 18.6 253.3 ± 21.6 0.915
GC-IPL thickness (mean ± SD, μm) 83.6 ± 6.5 80.9 ± 7.7 0.031
Table 1. Demographics and clinical characteristics. Values in boldface (P < 0.05) are statistically significant. SD
standard deviation, BCVA best-corrected visual acuity, SE spherical equivalent, IOP intraocular pressure, DM
diabetes, ONH optic nerve head, CMT central macular thickness, GC-IPL ganglion cell-inner plexiform layer.
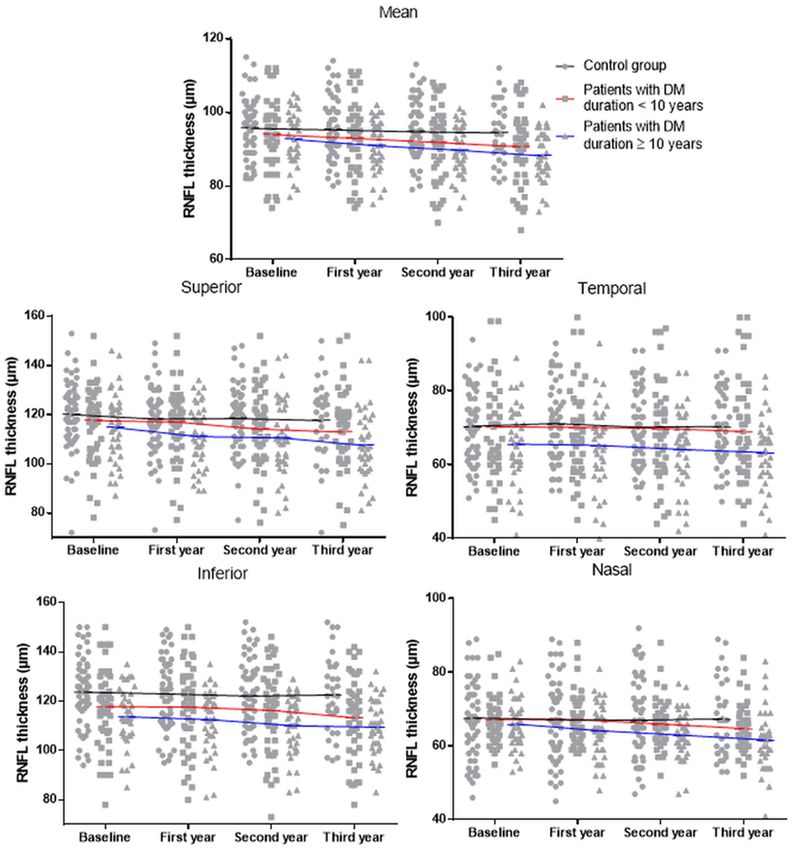
Analyses of T2DM patients with DM duration ≥ 10 years. The number of patients with DM dura-
tion ≥ 10 years was 38 in the DM group. The mean pRNFL thickness at each visit was 92.8 ± 7.1, 91.1 ± 7.1,
89.8 ± 6.9, and 88.3 ± 6.9 μm, which showed a significant reduction over time (P < 0.001), and all four segment
thicknesses also decreased significantly over time (superior, P = 0.001; temporal, P = 0.012; inferior, P < 0.001;
nasal, P < 0.001) (Fig. 2).
The estimated mean reduction rate of pRNFL thickness was − 1.61 μm/year (95% CI − 1.89 to − 1.34;
P < 0.001). Additionally, hypertension was a significant factor affecting the pRNFL change (estimate = − 4.88,
P = 0.046). Other significant factors were similar to the result in the DM group, but age did not show a significant
result (estimate = 0.05, P = 0.737).
Discussion
This study identified the longitudinal reductions in pRNFL thickness in T2DM patients without DR by DRN as
previous studies7,9–11. Such anatomical damages on the retina could be associated directly or indirectly with the
functional decline of vision. Zeng et al.12 reported that delayed implicit time and decreased amplitude were found
in T2DM patients without DR compared to the control group in electroretinography. Reduced color and contrast
sensitivities, delayed dark adaptation, and compromised visual field sensitivity are also known consequences
of DRN7,11,13–16. Although such anatomical and functional damages on the retina would occur in T2DM before
emerging clinical DR, current treatments are considered at late stages of DR when vision has been irreversibly
affected. Therefore, more efficient and preventive treatment strategies are required at earlier stages, based on
improved understanding of DR pathogenesis and the characteristics of early-stage disease. Additionally, the neu-
rovascular unit, which is associated with the main mechanism of DRN, is also important in the brain homeostasis
and damages of the neurovascular unit are observed in stroke, small vessel disease, and dementia. Such diseases
were reported to be associated with pRNFL damages17–19. After all, damages to the pRNFL in T2DM patients may
reflect the impaired neurovascular coupling of systemic neurodegenerative disease besides the early stage of DR.
The mean pRNFL thickness in the control group tended to decrease over time, but it was not statistically
significant. In the DM group, the mean pRNFL thickness decreased significantly over time, as did the thicknesses
of the superior and inferior segments. The pRNFLs of the superior and inferior segments are thicker than those
of the temporal and nasal segments, which would be associated with such patterns of pRNFL l oss10. Additionally,
this pattern of the pRNFL thinning is also observed in patients with open-angle glaucoma, which preferentially
involves superior and inferior pRNFL losses20,21. DRN and open-angle glaucoma have common mechanisms such
as glial dysfunction, retinal ganglion cell loss by cellular apoptosis, and impaired microcirculation, which results
in pRNFL thinning. Therefore, such similar patterns and mechanisms of pRNFL loss would be helpful to explain
the relationship between the 2 diseases that T2DM is one of the risk factors for glaucoma. In patients with DM
duration ≥ 10 years, the mean pRNFL thicknesses and those of all four sectors showed a significant reduction
over time. The nasal and temporal segments, which are less affected by other diseases, were nonetheless affected
by DRN with extensive loss of pRNFL in prolonged T2DM.
The reduction rate of mean pRNFL in the control group was − 0.45 μm/year, which was consistent with
previous studies10,22–26. Shin et al.27 found that the rate of change in mean pRNFL thickness was − 1.26 μm/
year in patients with progressing glaucoma. Another study reported that the average RNFL thinning rate was
− 1.31 μm/year in patients with pseudoexfoliative glaucoma28. Lee et al.25 reported that the reduction rate in
the mean pRNFL thickness of the hypertension group was − 0.99 μm/year. The DM group exhibited a pRNFL
thickness reduction rate similar to those of patients with other diseases associated with RNFL thinning, which
was − 1.34 μm/year. In patients with DM duration ≥ 10 years, the reduction rate of mean pRNFL thickness was
Scientific Reports | (2021) 11:6813 | https://doi.org/10.1038/s41598-021-86306-y 3
Vol.:(0123456789)www.nature.com/scientificreports/
Figure 1. Mean and sectoral peripapillary retinal nerve fiber layer (RNFL) thicknesses according to visit. Boxes
are 25–75% quartiles, lines in the boxes are the medians, and the whiskers indicate variability (minimum and
maximum values).
Control DM group
Reduction (95% CI), μm/year P value Reduction (95% CI), μm/year P value P valuea
Mean − 0.45 (− 0.88 to − 0.02) 0.040 − 1.34 (− 1.56 to − 1.11) < 0.001 < 0.001
Segment
Superior − 0.67 (− 1.36 to 0.03) 0.059 − 1.98 (− 2.49 to − 1.48) < 0.001 0.004
Temporal − 0.30 (− 0.74 to 0.14) 0.172 − 0.66 (− 0.90 to − 0.41) < 0.001 0.164
Inferior − 0.81 (− 1.67 to 0.35) 0.060 − 1.41 (− 1.83 to − 1.00) < 0.001 0.046
Nasal − 0.30 (− 0.88 to 0.28) 0.296 − 1.11 (− 1.40 to − 0.82) < 0.001 0.005
Table 2. Estimated mean rates of reduction in peripapillary retinal nerve fiber layer from the linear mixed
model. Values in boldface (P < 0.05) are statistically significant. a Calculated for interaction between groups and
follow-up duration in the linear mixed model.
Scientific Reports | (2021) 11:6813 | https://doi.org/10.1038/s41598-021-86306-y 4
Vol:.(1234567890)www.nature.com/scientificreports/
Control DM group
Estimate (95% CI), μm/year P value Estimate (95% CI), μm/year P value
Age − 0.10 (− 0.34 to 0.14) 0.388 − 0.27 (− 0.55 to − 0.08) 0.010
Sex 1.97 (− 2.17 to 6.12) 0.344 − 5.15 (− 11.20 to 0.89) 0.093
BCVA 29.84 (− 6.16 to 65.85) 0.102 − 51.97 (− 82.09 to − 21.95) 0.001
SE 0.37 (− 1.24 to 1.97) 0.649 − 0.28 (− 2.96 to 2.39) 0.833
IOP 0.07 (− 0.72 to 0.86) 0.859 − 0.15 (− 1.29 to 0.99) 0.792
Axial length − 0.18 (− 2.37 to 2.02) 0.873 − 0.05 (− 3.22 to 0.13) 0.977
Hypertension 0.829 (− 4.56 to 6.22) 0.759 − 4.50 (− 9.01 to 0.02) 0.055
HbA1c n/a n/a − 3.05 (− 5.12 to − 1.50) 0.001
DM duration n/a n/a − 0.18 (− 0.33 to − 0.07) 0.002
Follow-up duration − 0.49 (− 1.00 to 0.02) 0.061 − 1.28 (− 1.58 to − 0.95) < 0.001
Baseline CMT − 0.05 (− 0.16 to 0.06) 0.375 − 0.04 (− 0.10 to 0.08) 0.210
Baseline GC-IPL 0.08 (− 0.25 to 0.39) 0.675 0.65 (0.4 to 0.86) < 0.001
Baseline pRNFL 0.91 (0.82 to 0.99) < 0.001 0.96 (0.92 to 1.04) < 0.001
Table 3. Results of linear mixed models assessing the effects of putative factors predicting changes in mean
peripapillary retinal nerve fiber layer (pRNFL) thickness over time. BCVA best− corrected visual acuity, SE
spherical equivalent, IOP intraocular pressure, CMT central macular thickness, GC-IPL ganglion cell-inner
plexiform layer. Values in boldface (P < 0.05) are statistically significant.
− 1.61 μm/year, which is significantly higher than those in the control group and the DM group. T2DM induces
activation of microglial cells, the main sentinel immune cells located in the inner part of the retina, which then
migrates to the subretinal space and releases cytokines contributing to neuronal cell d eath7,29. In prolonged
T2DM, activated microglial cells would accumulate, triggering rapid DRN. Prolonged accumulation of glutamate
and the loss of neuroprotective factors may also be associated with rapid pRNFL loss.
The BCVA was significantly associated with pRNFL changes in the DM group. Vujosevic et al.9 found sig-
nificant correlations between pRNFL thickness and OCTA parameters such as perfusion or vessel densities in
the parapapillary regions of patients with T2DM. Change in the peripapillary microvasculature is known to be
associated with visual function decline in patients with various diseases including glaucoma30–33. Damages to
the pRNFL affecting peripapillary microvasculature via the retinal neurovascular unit may thus affect visual
acuity7,11. However, the BCVA was not significantly different between the two groups in our study, and Li et al.34
found no significant correlations between LogMAR BCVA and peripapillary capillary density in T2DM patients
without DR. Although DRN may compromise various visual functions, further studies enrolling more cases are
required to explore a possible direct relationship between DRN and visual acuity.
The HbA1c level significantly affected the pRNFL changes in the DM group. Zeng et al.12 reported that the
implicit time for 16 and 32 Tds stimuli was positively associated with the level of HbA1c (r = 0.434, P = 0.024;
r = 0.448, P < 0.001, respectively) in patients with T2DM without DR. The HbA1c level is a good indicator of
blood glucose control in around 3 months, and long-term hyperglycemia could induce retinal hypoxia and
inflammation, impairing retinal structures and neural f unction35–37. Therefore, good glycemic control is crucial
to prevent or minimize the inner retinal damages by DRN. Meanwhile, Sohn et al.38 reported that the HbA1c
level did not significantly influence the thickness of the RNFL in patients with type 1 DM in their longitudinal
study. However, they analyzed the RNFL thickness of parafoveal and perifoveal areas. So RNFL thickness of
the peripapillary area, which is much thicker than that of the macular area, may show the inner retinal damage
caused by hyperglycemia more sensitively.
In patients with DM duration ≥ 10 years, hypertension significantly affected the changes in pRNFL thickness
over time. Previous studies reported a significantly thinner pRNFL and rapid reduction of pRNFL in patients
with hypertension25,39,40. Cantor et al.41 reported that glaucomatous damage could occur in hypertension patients
because of ischemia in the optic nerve or retinal ganglion cell, which is related to microvascular pathologies
such as atherosclerosis, increased resistance, rigidity, or insufficient autoregulation. When activated microglial
cell numbers rise and glutamate accumulates in patients with prolonged T2DM, ischemic damages caused by
hypertension may accelerate injury of the inner retina. However, further studies are needed with detailed histories
of hypertension such as duration of disease and medication of hypertension.
Age did not significantly influence the changes in pRNFL thickness over time in patients with DM dura-
tion ≥ 10 years. Previous longitudinal studies reported that age was not a significant factor associated with changes
in the pRNFL thickness of T2DM patients10,38. Lee et al.42 also reported that age was not a significant factor associ-
ated with retinal microvasculature in T2DM. These studies all reported that DM duration was a significant factor
associated with the inner retinal damage by DRN and impairment of the retinal microvasculature. However,
although the results of the above studies showed that the DM duration is more important, age was a significant
factor affecting the pRNFL change in the DM group in this study. Furthermore, age is well known to play a key
role in the etiology of the neurodegenerative diseases, such as Alzheimer’s disease and Parkinson’s disease, by
the increased burden of systemic, chronic, and low-grade inflammatory condition, characterized by persistent
Scientific Reports | (2021) 11:6813 | https://doi.org/10.1038/s41598-021-86306-y 5
Vol.:(0123456789)www.nature.com/scientificreports/
Figure 2. Scatterplots and line graphs of the mean and sectoral peripapillary retinal nerve fiber layer (RNFL)
thicknesses at each visit in normal controls, patients with DM duration < 10 years, and patients with DM
duration ≥ 10 years.
and non-resolved production of pro-inflammatory mediators43–45. Therefore, age should not be overlooked as a
factor affecting neurodegeneration including DRN.
The major limitation of our study was that we did not perform the various visual function test such as visual
field test, contrast test, color vision test, or electroretinography so we could not analyze the association between
various visual functions and DRN. Additionally, much more data about blood glucose level or blood pressure
through more patient visits would allow more detailed analyses of any effect of hyperglycemia and hypertension.
Third, the control group may not represent the real healthy population as most of them came to the retina clinic
regularly for their fellow eyes with a disease, which may introduce a selection bias. The strength of our study is
that this is the first study to identify longitudinal changes in pRNFL thickness with analyses for patients with
DM duration ≥ 10 years for the detailed analysis of how the T2DM duration affects DRN.
Scientific Reports | (2021) 11:6813 | https://doi.org/10.1038/s41598-021-86306-y 6
Vol:.(1234567890)www.nature.com/scientificreports/
In conclusion, we confirmed rapid pRNFL thickness reduction over time in patients with T2DM, and the
reduction rate was higher in patients with T2DM ≥ 10 years. In patients with T2DM, pRNFL reductions were
evident principally in the superior and inferior segments, which was a similar pattern with glaucoma patients. In
patients with T2DM ≥ 10 years, significant reductions were observed in all four segments. Additionally, the BCVA
and HbA1c level were significantly associated with changes in pRNFL thickness over time in patients with T2DM,
and hypertension was a significant factor affecting the change of pRNFL in patients with T2DM ≥ 10 years. Physi-
cians should be aware that severe and rapid DRN may develop in patients with prolonged T2DM and consider
these findings when interpreting pRNFL changes in patients with T2DM.
Received: 18 December 2020; Accepted: 12 March 2021
References
1. Danaei, G. et al. Cardiovascular disease, chronic kidney disease, and diabetes mortality burden of cardiometabolic risk factors
from 1980 to 2010: a comparative risk assessment. Lancet Diabetes Endocrinol. 2, 634–647 (2014).
2. Shaw, J. E., Sicree, R. A. & Zimmet, P. Z. Global estimates of the prevalence of diabetes for 2010 and 2030. Diabetes Res. Clin. Pract.
87, 4–14 (2010).
3. Yang, W. et al. Prevalence of diabetes among men and women in China. N. Engl. J. Med. 362, 1090–1101 (2010).
4. Cho, N. et al. IDF Diabetes atlas: global estimates of diabetes prevalence for 2017 and projections for 2045. Diabetes Res. Clin.
Pract. 138, 271–281 (2018).
5. Yau, J. W. et al. Global prevalence and major risk factors of diabetic retinopathy. Diabetes Care 35, 556–564 (2012).
6. Leasher, J. L. et al. Global estimates on the number of people blind or visually impaired by diabetic retinopathy: a meta-analysis
from 1990 to 2010. Diabetes Care 39, 1643–1649 (2016).
7. Simó, R. & Hernández, C. Neurodegeneration in the diabetic eye: new insights and therapeutic perspectives. Trends Endocrinol.
Metab. 25, 23–33 (2014).
8. Kern, T. S. & Barber, A. J. Retinal ganglion cells in diabetes. J. Physiol. 586, 4401–4408 (2008).
9. Vujosevic, S. et al. Peripapillary microvascular and neural changes in diabetes mellitus: an OCT-angiography study. Investig.
Ophthalmol. Vis. Sci. 59, 5074–5081 (2018).
10. Lim, H. B., Shin, Y. I., Lee, M. W., Park, G. S. & Kim, J. Y. Longitudinal changes in the peripapillary retinal nerve fiber layer thick-
ness of patients with type 2 diabetes. JAMA Ophthalmol. 137, 1125–1132 (2019).
11. Simó, R., Stitt, A. W. & Gardner, T. W. Neurodegeneration in diabetic retinopathy: does it really matter?. Diabetologia 61, 1902–1912
(2018).
12. Zeng, Y. et al. Early retinal neurovascular impairment in patients with diabetes without clinically detectable retinopathy. Br. J.
Ophthalmol. 103, 1747–1752 (2019).
13. Bearse, M. A. Jr. et al. A multifocal electroretinogram model predicting the development of diabetic retinopathy. Prog. Retin. Eye
Res. 25, 425–448 (2006).
14. Trick, G. L., Burde, R. M., Cordon, M. O., Santiago, J. V. & Kilo, C. The relationship between hue discrimination and contrast
sensitivity deficits in patients with diabetes mellitus. Ophthalmology 95, 693–698 (1988).
15. Kurtenbach, A. et al. Brightness matching and colour discrimination in young diabetics without retinopathy. Vis. Res. 34, 115–122
(1994).
16. Antonetti, D. A. et al. Diabetic retinopathy: seeing beyond glucose-induced microvascular disease. Diabetes 55, 2401–2411 (2006).
17. Muoio, V., Persson, P. & Sendeski, M. The neurovascular unit–concept review. Acta Physiol. 210, 790–798 (2014).
18. Wang, D. et al. Localized retinal nerve fiber layer defects and stroke. Stroke 45, 1651–1656 (2014).
19. Kim, M. et al. Retinal nerve fiber layer defect and cerebral small vessel disease. Investig. Ophthalmol. Vis. Sci. 52, 6882–6886 (2011).
20. Baniasadi, N. et al. Patterns of retinal nerve fiber layer loss in different subtypes of open angle glaucoma using spectral domain
optical coherence tomography. J. Glaucoma 25, 865–872 (2016).
21. Kanamori, A. et al. Evaluation of the glaucomatous damage on retinal nerve fiber layer thickness measured by optical coherence
tomography. Am. J. Ophthalmol. 135, 513–520 (2003).
22. Leung, C. K. et al. Retinal nerve fiber layer imaging with spectral-domain optical coherence tomography: a prospective analysis
of age-related loss. Ophthalmology 119, 731–737 (2012).
23. Celebi, A. R. C. & Mirza, G. E. Age-related change in retinal nerve fiber layer thickness measured with spectral domain optical
coherence tomography. Investig. Ophthalmol. Vis. Sci. 54, 8095–8103 (2013).
24. Wu, Z. et al. Impact of normal aging and progression definitions on the specificity of detecting retinal nerve fiber layer thinning.
Am. J. Ophthalmol. 181, 106–113 (2017).
25. Lee, M.-W., Lee, W.-H., Park, G.-S., Lim, H.-B. & Kim, J.-Y. Longitudinal changes in the peripapillary retinal nerve fiber layer
thickness in hypertension: 4-year prospective observational study. Investig. Ophthalmol. Vis. Sci. 60, 3914–3919 (2019).
26. Lee, M.-W., Kim, J.-M., Shin, Y.-I., Jo, Y.-J. & Kim, J.-Y. Longitudinal changes in peripapillary retinal nerve fiber layer thickness
in high myopia: a prospective, observational study. Ophthalmology 126, 522–528 (2019).
27. Shin, J. W., Sung, K. R., Lee, G. C., Durbin, M. K. & Cheng, D. Ganglion cell–inner plexiform layer change detected by optical
coherence tomography indicates progression in advanced glaucoma. Ophthalmology 124, 1466–1474 (2017).
28. Lee, W. J., Baek, S. U., Kim, Y. K., Park, K. H. & Jeoung, J. W. Rates of ganglion cell-inner plexiform layer thinning in normal,
open-angle glaucoma and pseudoexfoliation glaucoma eyes: a trend-based analysis. Investig. Ophthalmol. Vis. Sci. 60, 599–604
(2019).
29. Zeng, H.-Y., Green, W. R. & Tso, M. O. Microglial activation in human diabetic retinopathy. Arch. Ophthalmol. 126, 227–232
(2008).
30. Augstburger, E., Zéboulon, P., Keilani, C., Baudouin, C. & Labbé, A. Retinal and choroidal microvasculature in nonarteritic anterior
ischemic optic neuropathy: an optical coherence tomography angiography study. Investig. Ophthalmol. Vis. Sci. 59, 870–877 (2018).
31. Mammo, Z. et al. Quantitative optical coherence tomography angiography of radial peripapillary capillaries in glaucoma, glaucoma
suspect, and normal eyes. Am. J. Ophthalmol. 170, 41–49 (2016).
32. Jia, Y. et al. Optical coherence tomography angiography of optic disc perfusion in glaucoma. Ophthalmology 121, 1322–1332 (2014).
33. Liu, L. et al. Optical coherence tomography angiography of the peripapillary retina in glaucoma. JAMA Ophthalmol. 133, 1045–1052
(2015).
34. Li, Z. et al. Optical coherence tomography angiography findings of neurovascular changes in type 2 diabetes mellitus patients
without clinical diabetic retinopathy. Acta Diabetol. 55, 1075–1082 (2018).
35. Nathan, D. M. et al. Translating the A1C assay into estimated average glucose values. Diabetes Care 31, 1473–1478 (2008).
36. Fondi, K. et al. Retinal oxygen extraction in individuals with type 1 diabetes with no or mild diabetic retinopathy. Diabetologia
60, 1534–1540 (2017).
Scientific Reports | (2021) 11:6813 | https://doi.org/10.1038/s41598-021-86306-y 7
Vol.:(0123456789)www.nature.com/scientificreports/
37. Semeraro, F., Cancarini, A., Rezzola, S., Romano, M. R. & Costagliola, C. Diabetic retinopathy: vascular and inflammatory disease.
J. Diabetes Res. 2015, 582060 (2015).
38. Sohn, E. H. et al. Retinal neurodegeneration may precede microvascular changes characteristic of diabetic retinopathy in diabetes
mellitus. Proc. Natl. Acad. Sci. 113, E2655–E2664 (2016).
39. Lee, S. H., Lee, W. H., Lim, H. B., Jo, Y. J. & Kim, J. Y. Thicknesses of central macular, retinal nerve fiber, and ganglion cell inner
plexiform layers in patients with hypertension. Retina 39, 1810–1818 (2019).
40. Mauschitz, M. M. et al. Systemic and ocular determinants of peripapillary retinal nerve fiber layer thickness measurements in the
European eye epidemiology (E3) population. Ophthalmology 125, 1526–1536 (2018).
41. Cantor, E., Méndez, F., Rivera, C., Castillo, A. & Martínez-Blanco, A. Blood pressure, ocular perfusion pressure and open-angle
glaucoma in patients with systemic hypertension. Clin. Ophthalmol. (Auckland, NZ) 12, 1511 (2018).
42. Lee, M.-W. et al. Effects of prolonged type 2 diabetes on the inner retinal layer and macular microvasculature: an optical coherence
tomography angiography study. J. Clin. Med. 9, 1849 (2020).
43. Badji, A. et al. A cross-sectional study on the impact of arterial stiffness on the corpus callosum, a key white matter tract implicated
in Alzheimer’s disease. J. Alzheimer’s Dis. 77, 1–15 (2020).
44. Franceschi, C. et al. Inflamm-aging: an evolutionary perspective on immunosenescence. Ann. N. Y. Acad. Sci. 908, 244–254 (2000).
45. Sabbatinelli, J. et al. Connecting vascular aging and frailty in Alzheimer’s disease. Mech. Ageing Dev. 195, 111444 (2021).
Author contributions
Design and conduct of the study (M.W.L., J.Y.K.); Collection of data (G.S.P., J.Y.K.); Analysis and interpreta-
tion of data (M.W.L., H.B.L., J.Y.K.); Writing the article (M.W.L., J.Y.K.); Critical revision of the article (M.W.L.,
M.S.K., Y.H.L., K.Y.N., J.Y.K.) Final approval of the article (M.W.L., H.B.L., M.S.K., G.S.P., K.Y.N., Y.H.L., J.Y.K.).
Competing interests
The authors declare no competing interests.
Additional information
Supplementary Information The online version contains supplementary material available at https://doi.org/
10.1038/s41598-021-86306-y.
Correspondence and requests for materials should be addressed to J.-Y.K.
Reprints and permissions information is available at www.nature.com/reprints.
Publisher’s note Springer Nature remains neutral with regard to jurisdictional claims in published maps and
institutional affiliations.
Open Access This article is licensed under a Creative Commons Attribution 4.0 International
License, which permits use, sharing, adaptation, distribution and reproduction in any medium or
format, as long as you give appropriate credit to the original author(s) and the source, provide a link to the
Creative Commons licence, and indicate if changes were made. The images or other third party material in this
article are included in the article’s Creative Commons licence, unless indicated otherwise in a credit line to the
material. If material is not included in the article’s Creative Commons licence and your intended use is not
permitted by statutory regulation or exceeds the permitted use, you will need to obtain permission directly from
the copyright holder. To view a copy of this licence, visit http://creativecommons.org/licenses/by/4.0/.
© The Author(s) 2021
Scientific Reports | (2021) 11:6813 | https://doi.org/10.1038/s41598-021-86306-y 8
Vol:.(1234567890)You can also read