Efficient movement strategies mitigate the energetic cost of dispersal
←
→
Page content transcription
If your browser does not render page correctly, please read the page content below
Received: 16 November 2020 | Revised: 7 January 2021 | Accepted: 31 March 2021
DOI: 10.1111/ele.13763
LETTER
Efficient movement strategies mitigate the energetic cost of
dispersal
James A. Klarevas-Irby1,2,3,4,5 | Martin Wikelski1,2,3 | Damien R. Farine2,4,6,7
1
Department of Migration, Max Planck Abstract
Institute of Animal Behavior, Radolfzell,
Germany Dispersal is a critical, but costly, stage of life. During the active phase of dispersal—
2
Centre for the Advanced Study of called transience—individuals face many costs, from increased mortality to re-
Collective Behaviour, University of
Konstanz, Konstanz, Germany duced foraging opportunities. One cost that is often assumed, but rarely explicitly
3
Department of Biology, University of tested, is the energy expended in making large dispersal movements. However, this
Konstanz, Konstanz, Germany
4
Department of Evolutionary Biology
cost is not only determined by the distance individual’s move, but also how they
and Environmental Studies, University of move. Using high-resolution GPS tracking of dispersing and resident vulturine
Zurich, Zurich, Switzerland
5
Mpala Research Centre, Nanyuki, Kenya
guineafowl (Acryllium vulturinum), we show that transient individuals exhibit dis-
6
Department of Collective Behavior, Max tinct movement behaviours—travelling farther, faster and straighter—that result
Planck Institute of Animal Behavior,
Konstanz, Germany
in a significant reduction in the energetic costs of making large displacements.
7
Department of Ornithology, National This strategy allows dispersing birds to travel, on average, 33.8% farther each day
Museums of Kenya, Nairobi, Kenya
with only a 4.1% cost increase and without spending more time moving. Our study
Correspondence suggests that adaptive movement strategies can largely mitigate movement costs
Damien R. Farine, Max Planck Institute
of Animal Behavior. Am Obstberg 1, 78315 during dispersal, and that such strategies may be common.
Radolfzell, Germany.
Email: dfarine@ab.mpg.de
K EY WOR DS
Funding information adaptive strategies, animal behaviour, biologging, dispersal, ecophysiology, energetic costs, GPS
Max Planck Society; Swiss National tracking, movement ecology, terrestrial ecology, vulturine guineafowl
Science Foundation, Grant/Award
Number: PCEFP3_187058; European
Research Council, Grant/Award
Number: 850859; Association for the
Study of Animal Behaviour; Max
Planck–Yale Center for Biodiversity
Movement and Global Change; Deutsche
Forschungsgemeinschaft, Grant/Award
Number: EXC 2117–422037984
Editor: Ulrich Brose
INTRODUCTION of dispersal— transience— individuals can suffer from
increased mortality (Alberts & Altmann, 1995; Isbell
Dispersal is a key life history process comprised of three et al., 1993; Yoder et al., 2004) and missed reproductive
stages: departure, transience and settlement (Bowler or foraging opportunities (Alberts & Altmann, 1995;
& Benton, 2005; Clobert et al., 2009). Competition Zollner & Lima, 2005), compared to resident individu-
for resources (Clobert et al., 2001; Hamilton & May, als. Furthermore, animals often have to make extraordi-
1977) and avoidance of inbreeding (Gandon, 1999; narily large displacements during transience (Elliot et al.,
Matthysen, 2012) drive individuals to leave their natal 2014; Killeen et al., 2014; Woollard & Harris, 1990), in
range. The potential benefits of dispersing are gener- some cases achieving several times the daily net displace-
ally offset by substantial costs. During the active phase ment of non-transient individuals (Delgado et al., 2009).
This is an open access article under the terms of the Creative Commons Attribution-NonCommercial License, which permits use, distribution and reproduction in
any medium, provided the original work is properly cited and is not used for commercial purposes.
© 2021 The Authors. Ecology Letters published by John Wiley & Sons Ltd.
Ecology Letters. 2021;00:1–11. wileyonlinelibrary.com/journal/ele | 1
Konstanzer Online-Publikations-System (KOPS)
URL: http://nbn-resolving.de/urn:nbn:de:bsz:352-2-hw7yqegqt3ru7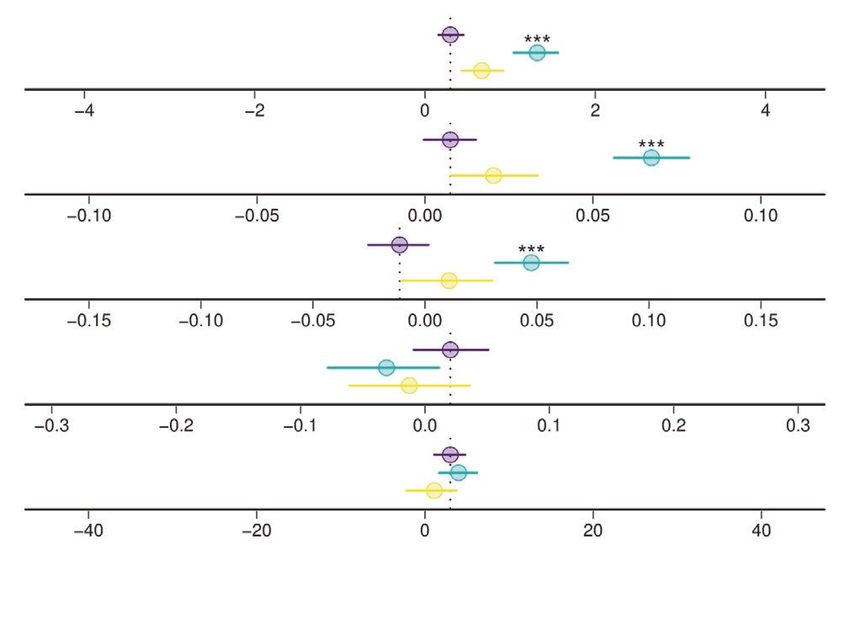
EFFICIENT MOVEMENT STRATEGIES MITIGATE THE ENERGETIC
2 | COST OF DISPERSAL
Observations of such large-scale displacements have led First, we test whether individuals exhibit distinct changes
to the suggestion that dispersal must incur a substan- in how they move during each stage of dispersal (pre-
tial energetic cost arising from movement (Bonte et al., departure, during transience and post- settlement).
2012; Van Dyck & Baguette, 2005). However, what has Second, we quantify the energetic costs of moving during
largely been overlooked is that this cost may not only be transience relative to pre-departure and post-settlement
a function of how far an individual travels, but also how to test whether these changes in movement correspond
it moves when making large displacements. For example, to a cost-m itigating strategy for achieving the large-scale
moving straighter should minimize the costs of making displacements typical of dispersal. Because vulturine
net displacements relative to moving in a more tortu- guineafowl live in stable groups (Papageorgiou et al.,
ous manner. Further, because the relationship between 2019), our data collection allows us to test these hypoth-
walking speed and metabolic rate in terrestrial animals eses by employing a powerful two-step comparative ap-
is linear (Chassin et al., 1976; Taylor et al., 1982), it results proach: first making within-individual comparisons of
in a non-linear decrease in the gross cost of transport— movement behaviours of dispersers across stages, and
the total amount of energy consumed to move a unit of second by making comparisons between dispersers and
body mass a given distance—w ith increasing speeds. residents from their natal group (at each stage) to discard
Thus, moving faster could allow animals to make larger the potential contribution of daily variation in environ-
displacements for a given energetic cost. These funda- mental conditions. By integrating fine-scale tracking of
mental relationships could underpin the evolution of individual movements over long time periods with ro-
adaptive movement strategies that can mitigate move- bust data on the energetic costs of moving, we reveal that
ment costs when dispersing. animals exhibit an adaptive strategy during transience
There is increasing evidence that dispersal behaviour that largely mitigates the costs of dispersing.
is shaped by the costs encountered after departure.
Examples include dispersing meerkats (Suricata suricatta)
moving along territory boundaries to avoid conflicts with M ET HOD S
residents (Cozzi et al., 2018) or changes in the timing of
dispersal allowing individuals to maximize the chances Study system
of integration into new social groups (Armansin et al.,
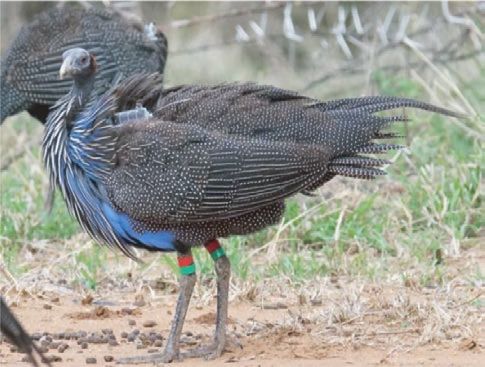
2020; Cheney & Seyfarth, 1983). However, it still remains We collected our data in a population of vulturine guine-
unclear whether movement behaviour during dispersal is afowl, which are a largely-terrestrial bird species, at the
shaped by the energetic costs of making large-scale dis- Mpala Research Centre in Laikipia, Kenya (0.292120,
placements. A study focused on energetic expenditure 36.898670). Since 2016, field observations have confirmed
of dispersing roe deer (Capreolus capreolus) found that that, like most other bird species (Greenwood, 1980),
dispersers travelled 63% farther per day, expending an dispersal in vulturine guineafowl is heavily sex-biased
estimated 22% more energy than non-dispersers (Benoit towards females. We used data from 35 individuals, com-
et al., 2020). While these results indicate an additional prising 20 dispersing subadult females—approximately
net cost to making large displacements, they also suggest 18 months old at the time of dispersal—and 15 non-
that movement costs may not scale equally with the dis- dispersing residents (four subadult males, five adult
placements achieved. How might this happen? Several males, six adult females) from six social groups. Birds
studies, in a range of terrestrial mammals (Elliot et al., were captured as whole groups using walk- in traps,
2014; Killeen et al., 2014; Woollard & Harris, 1990), have and each individual was marked with an individually
found that individuals express different movement be- numbered stainless steel ring, a unique combination
haviours during transience, specifically moving straighter of four plastic colour bands, and was fitted with a 15 g
and faster. The results from these studies suggest that Bird Solar GPS tag (e-obs GmbH) using a backpack-
dispersers may be exhibiting cost-mitigating movement style Teflon harness and a neoprene pad to elevate solar
behaviours. However, to date, studies have been limited panels above body feathers (Papageorgiou et al., 2019).
in their ability to link the movements behaviours of dis- The total weight of backpacks and tags combined was
persers to the actual costs incurred, as they have relied on approximately 20.5 g, well below the suggested 3% of
either indirect measures of activity (e.g. accelerometers) birds’ body weight (Kenward, 2000). Data were recorded
without capturing data on movement or sparse GPS sam- across two dispersal seasons in 2019 (See Table S1).
pling [e.g. 1 point per hour (Elliot et al., 2014)] that cannot
capture the fine-scale moment-by-moment movement be-
haviour of individuals (Kays et al., 2015). Research permits
In this study, we use simultaneous high- resolution
(1 Hz) GPS tracking of dispersing and resident vultu- All work was conducted under research permits from
rine guineafowl (Acryllium vulturinum)—comprising the Max Planck Society Ethikrat Committee (2016_13/1),
1367 bird-days (where one bird-day represents one day of the National Commission for Science, Technology and
tracking for one individual)—to test two key hypotheses. Innovation of Kenya (NACOSTI/P/16/3706/6465), the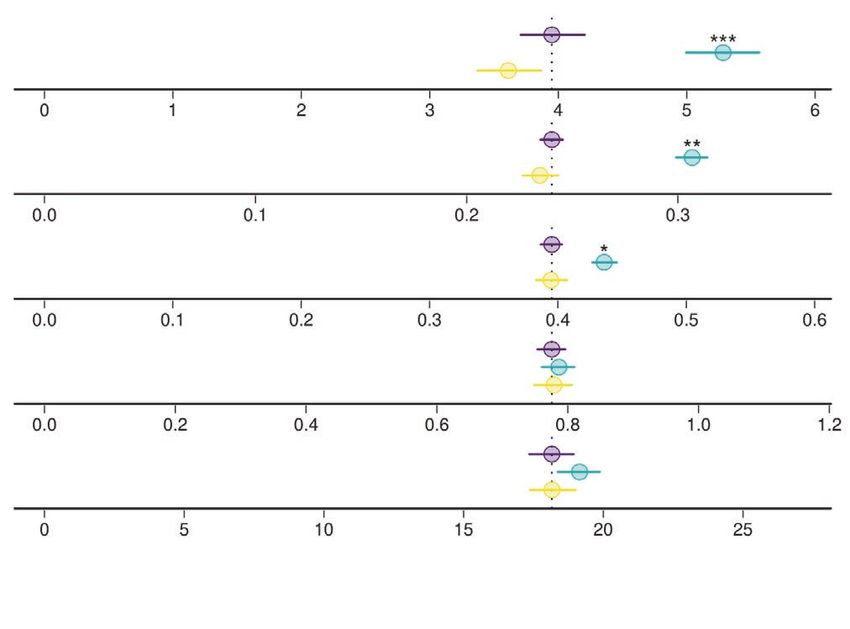
KLAREVAS-IRBY et al. | 3
National Environment Management Authority (NEMA/ data, thereby reliably providing data every 5 min for every
AGR/68/2017), under a Research Authorisation and a bird on every day it was tracked. For logistical reasons the
Capture Permit issued by the Kenyan Wildlife Service, accelerometer function of our GPS tags was disabled, as
and in affiliation with the National Museums of Kenya. the increased amount of data would have greatly hindered
our ability to reliably track, and download data from, birds
dispersing over large distances. GPS Data were uploaded
GPS tracking to Movebank (https://www.movebank.org/) and retrieved
and prepared for analysis in R using the move package
Each GPS device was programmed to record data dur- (Kranstauber et al., 2020).
ing daylight hours, from 06:00 to 19:00. Data points (date,
time and location) were recorded continuously at 1 Hz
(i.e. one fix per second) when the tags’ battery had a high Dispersal
charge (approximately every second to third day, for up
to 4.5 h continuously). When the battery was below the We divided each disperser’s dataset into three stages
high-resolution charge threshold, we set tags to record 10 (Figure 1a)—pre-departure (7 days when dispersers were
GPS points in the first 10 s of every fifth minute. If bat- still moving with their natal group), transience (mean of
tery charge was at the lowest threshold, tags were set to re- 16.8 days when birds were actively dispersing), and post-
cord one point every 15 min (this threshold was not crossed settlement (7 days when individuals were moving with
during this study). Data were remotely downloaded every their post-dispersal group). Birds were considered to
two days using a BaseStation II (e-obs Digital Telemetry, have dispersed—i.e. to have started transience—on the
Grünwald, Germany). For the purposes of our analyses, first date when they were observed to be moving sepa-
we separated the data into two resolutions: high-resolution rately from their natal group, based on field observations
data, comprising all continuous periods of 1Hz data; and and confirmed via visual observation of the GPS tracks
5-min data, comprising data from the tenth second of every of dispersers and residents. Birds were then considered
fifth minute of the day. The latter was collected from both settled from the first day in which they spent the entire
the low-resolution dataset and by sub-sampling the 1Hz day within their eventual post-settlement group (based
on field observations over the following months). In three
instances, this included birds who failed to successfully
(a) (b) find a new group and ultimately returned to their natal
group. These three individuals attempted to disperse
i. again in a subsequent season, resulting in 23 recorded dis-
persal events. For birds that dispersed into groups outside
of our study population, settlement was determined from
ii. field observations and dated based on the first instance of
repeated use of the same roost site that ultimately would
represent their post-dispersal home range. For 8 of the
23 recorded dispersal events, we were unable to record
settlement, owing to either: predation during transience
(1 individual); a failure of the Teflon ribbon causing the
tag to fall off (one individual which was later visually
confirmed to have survived based on colour bands); or
because the dispersing bird moved sufficiently far from
our study area that we were not able to relocate the tag
for download (six individuals). These birds were excluded
from analyses of post-settlement movement.
Analyses
All analyses were performed in R version 4.0 (R Core
Team, 2020).
F I G U R E 1 Tracking vulturine guineafowl across three stages
of dispersal: pre-departure (purple), transience (green) and post-
settlement (yellow). (a) Full dispersal track of one individual with Defining movement states
transience movements (line) between pre-departure and post-
settlement home ranges (polygons). (b) Illustration of how 50 m
segments of net (i) or cumulative (ii) displacement were derived from We implemented an unsupervised Hidden Markov
movement tracks Model (HMM) to delineate the different movement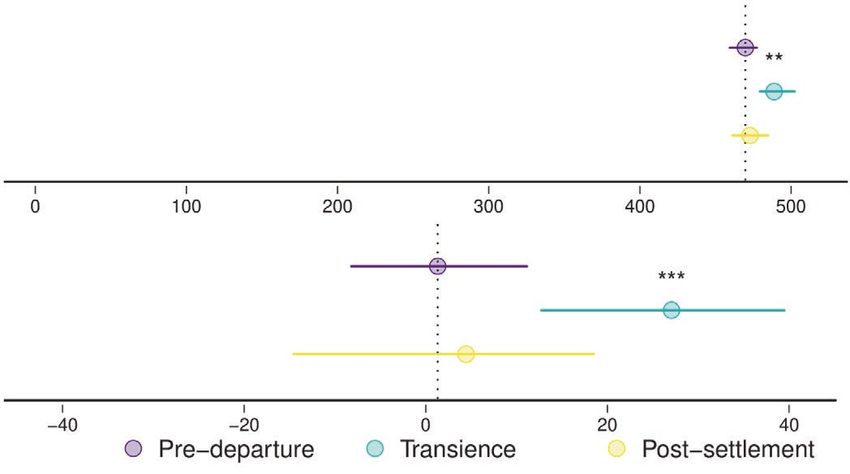
EFFICIENT MOVEMENT STRATEGIES MITIGATE THE ENERGETIC
4 | COST OF DISPERSAL
states exhibited by vulturine guineafowl. Because a track length, we included one measure per individual
1Hz resolution violates the Markov assumption, we per day. For speed while moving and straightness index,
first summed the distance moved and absolute turn- we included one observation from each available 5-m in
ing angles for every 10 s in the high-resolution data. period of continuous high-resolution data (mean = 54.0,
We searched for four movement states across the entire range = 2 to 140 observations per individual per day). For
high-resolution dataset, using the R package depmixS4 the percentage of time spent moving, we included data
(Visser & Speekenbrink, 2010). We selected a 4- state for each distinct hour of the day that collected sufficient
model based on field observations that individuals spend high-resolution data (mean = 5.3, range = 1 to 11 obser-
time not moving (state 1), making slow, tortuous foraging vations per individual per day). Finally, for the durations
movements (state 2), walking at a medium speed (state 3) of movements, we fit the length of each continuous burst
and moving quickly in a directed manner (state 4). The of movement that was detected. Because movement dura-
choice of a 4-state model was also critical for isolating tion is left-truncated, forming a long-tailed distribution,
a clear “stationary” state for the purposes of calculat- we square-root-transformed durations to aid with model
ing metabolic expenditure. We then assigned the state of fitting. In each model, we included stage (pre-departure,
each 10-s burst to all of the 1Hz data points which con- transience, post-settlement) as a predictor. We consid-
tributed to it. Birds were considered to be moving when ered two factors as random effects—individual identity
a GPS point was assigned to any of states 2–4. and natal group—in one of three configurations: indi-
vidual identity as random intercept, individual identity
and group as crossed random effects, or individual iden-
Characterizing how dispersers move across tity as crossed random effects where individuals were al-
stages of dispersal lowed to have random slopes. We then selected the best
random effect structure in each model using Akaike’s
We extracted five key measures to characterize birds’ Information Criterion (AIC). AIC values for all models
movement behaviours: daily track length (km), speed of individual behaviours can be found in Table S2, and
while moving (m s-1), straightness of movement (a specific equations for all LMMs can be found in the cor-
straightness index, Batschelet, 1981), the percent of over- responding table in the supporting information. Model
all time spent moving, and the duration of each burst of selection was performed without restricted maximum
movement. Daily track lengths were measured from the likelihoods (REML) for all random effect structures
sum of displacements 5-m in data, in order to control for tested, as this could affect AIC values, although final
variation in the amount of high-resolution data collected models were fit using REML. For all models, the pre-
each day. Speed was calculated from the per-second dis- departure stage was used as the reference category, as
placement when an animal was moving (i.e. assigned to these movements were interpreted to be typical of daily
states 2-4), summarized for each 5-m in window of high- behaviours for both subadults and resident adults.
resolution data available. In order to reduce the effect To perform the comparison between dispersers and
of small GPS errors on calculated velocities, individuals’ residents, we fit LMMs of movement as a function of
speeds at each second were derived from the mean veloc- the stage a given disperser was in, this time using the
ity over a rolling 5-s window within the high-resolution difference between the disperser’s and its correspond-
data (i.e. at each second, we averaged the animals speed ing resident group members’ measures of movement
with the 2 s which preceded and followed it). Straightness as the response variable and individual (disperser) as a
of movement was characterized using the straightness random effect. We were limited to this model structure
index (Batschelet, 1981) calculated over each available because multiple dispersing individuals from the same
5-m in window of 1Hz data, dividing the net displace- group could be at different stages, making it difficult to
ment achieved over the 5 min by the summed cumulative fit resident individuals independently into the model for
displacement therein. The percent of overall time spent the purpose of making the comparison. For daily track
moving was calculated for each hour of the day, as the length, we calculated the difference between each dis-
number of seconds the animal was in a moving state di- perser and the mean of the residents from its natal group
vided by the total number of seconds to which any state on the same day. For speed while moving and straight-
was assigned (only hours with 95% or greater, i.e. 57 min ness index, we calculated the difference in each unique 5-
or more, of high-resolution coverage were used). Finally, min window of each day in which both the disperser and
duration of movements was defined as the number of at least one of the resident individuals collected high-
consecutive seconds in which an animal was moving resolution data. Similarly, we calculated the difference
without stopping, summarized for each distinct bout of in percentage of time spent moving for each hour of the
movement. day in which both the disperser and at least one of corre-
To test how individuals’ movement behaviours sponding resident individuals collected high-resolution
changed across stages, we first fit linear mixed models data. Finally, we calculated the difference in movement
(LMM), using the package lmerTest (Kuznetsova et al., duration as daily measures, based on the differences in
2017), to each movement measure. For analyses of daily mean duration of all bouts of continuous movement in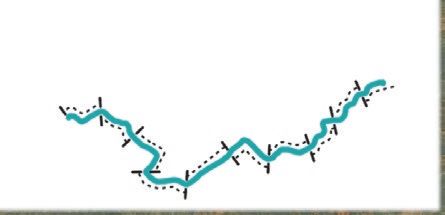
KLAREVAS-IRBY et al. | 5
a given day for both dispersers and their corresponding segment was calculated by summing the per- second-
residents. To avoid over-representing days with fewer costs for each detection which contributed to that seg-
high-resolution data, we excluded any day contain- ment, and translated into the energetic cost of transport
ing less than 2 hours of high-resolution data (for both (in J kg−1 m−1) for each type of displacement by dividing
the disperser and the residents of its natal group) from by the distance travelled (either net or cumulative).
analyses of movement duration. For all movement vari- For each displacement type, we then fit an LMM with
ables, we calculated the mean value across all members the cost of transport associated with each segment as the
of the group when simultaneous measures were available response variable, stage of dispersal as a predictor, and
within a group of residents. individual and natal group as crossed random effects,
where individuals were allowed to have random slopes (see
Table S2 for AIC values of alternate random effect struc-
Calculating the energetic costs of movement tures). To generate a comparison between dispersers and
residents, we calculated the mean cost for each disperser
To quantify how movement at each stage of dispersal to achieve a given displacement within each hour of each
translate to metabolic costs, we used published data day, and subtracted the mean cost of all residents from the
(Ellerby et al., 2003) on the relationship between meta- same group to achieve the same given displacement within
bolic costs (mL O2 kg−1 s−1) and movement speed (m the same time window. We then fit an LMM with the dif-
s−1) in the morphologically similar, and closely-related, ference in cost as the response variable, stage of dispersal
helmeted guineafowl (Numida meleagris). Specifically, as a predictor and individual (disperser) as a random effect.
we used two formulas to calculate the costs incurred
for each second of high-resolution data, corresponding
to when birds were either stationary (state 1) or moving Calculating the total energetic
(states 2–4). When moving (i.e. velocity v > 0), guinea- costs of dispersing
fowl exhibit a linear relationship between speed and oxy-
gen consumption, given by VO2 = (24.0v + 27.2), where We calculated the total energetic expenditure over each
VO2 is the per-m inute volume of oxygen consumed in 13-h day for each bird by summing all of the per-second-
mL O2 per kilogram of body mass. The formula for when costs from each unique day of tracking for each individ-
birds were stationary is a fixed consumption of 19.1 mL ual into a single measure of daily energetic expenditure
O2 kg−1 min−1, corresponding to the oxygen consump- (i.e. J kg-1 day-1). Because not all days contained an equal
tion rate when not moving, as described in the litera- amount of high-resolution data, we standardized the cost
ture (Ellerby et al., 2003). These per-second measures of value for each day by multiplying the mean cost within
metabolic oxygen consumption were then transformed the day by 46,800 s. To avoid over-representing days with
into units of Joules kg-1 s−1 using a conversion factor fewer high-resolution data, we excluded any day contain-
of 20.1 J mL−1 O2 (per Marsh et al., 2006; Ellerby et al., ing less than 2 h of high-resolution data.
2003). To estimate the change in energy use across stages, we
fit an LMM of daily energetic expenditure as the response
variable, with stage of dispersal as the predictor variable
Calculating the energetic costs of individual identity as a random intercept (see Table S2 for
displacements AIC values of alternate random effect structures). To make
the comparison to residents from the same group, we calcu-
We used the high-resolution GPS data from each indi- lated the difference in daily energetic expenditure between
vidual to partition movement tracks into fixed segments dispersers and residents on matched days. When multi-
representing 50 m of net or cumulative displacement ple resident measures were available for the same date, we
(Figure 1b). Net displacement is the absolute movement opted to use the value from whichever individual collected
in space between two points in time, while cumulative the most high-resolution data for comparison. We then fit
displacement is the sum of the individual step distances an LMM of the difference in energetic expenditure as the
travelled. We segmented tracks starting from the first sec- response variable, with stage as the predictor and individual
ond of high-resolution data available (i.e. after the GPS (disperser) as a random effect.
switched on or switched from low-resolution to high-
resolution) until the 50 m net displacement threshold was
crossed. The first GPS point to fall on or outside of the R E SU LT S
given radius then represented the first point for the next
segment. Using the same high-resolution data, we also We collected over 13 million GPS fixes, constituting 158
calculated the corresponding cumulative displacements bird-
days pre-departure, 382 bird-days of transience,
by summing each consecutive step length in a track until 105 bird-days post-settlement from subadults, and 722
it reached a sum of 50 m, at which point we started a corresponding bird-days of data from resident adults
new segment. The total energetic expenditure for each (see Table S1 for a summary of each dispersal event). InEFFICIENT MOVEMENT STRATEGIES MITIGATE THE ENERGETIC
6 | COST OF DISPERSAL
total, 85.7% of fixes—comprising 17.5% of total track- movements across stages (Figure 1ei), or when compared
ing time—were collected at high resolution (continuous to residents (Figure 1eii).
1 Hz), with the remainder collected in 10-s bursts every Overall, transient birds moved farther, faster and
fifth minute of daylight hours. straighter. Relative to their pre-departure movements,
changes in movement corresponded to an average 33.8%
greater daily travel distance, which they achieved by
Dispersers move farther, faster and straighter moving, on average, 27.7% faster and 10.3 % straighter.
during transience However, they did not increase the overall time spent
moving. The differences in movement behaviours were
Individuals’ daily cumulative track lengths confirm also captured by the raw HMM state assignments
that dispersers travelled significantly farther during (Figure 3), which detected a similar expression of the sta-
the transience stage relative to both pre-departure and tionary state (state 1) across all stages, but revealed that
post-settlement (Figure 2ai). The difference in daily dis- the slow tortuous state (state 2, which we hypothesize
tances between dispersers and residents was also great- corresponds to foraging) was underrepresented during
est during the transience stage relative to other stages transience (35.8% vs 43.9% pre- departure and 41.0%
(Figure 2aii). These results indicate that increased dis- post-settlement), while the expression of fast, directed
tances travelled during transience were attributable to movements (state 4) increased during transience (15.3%
individuals’ dispersal stage and not underlying environ- vs 10.1% pre-departure and 10.0% post-settlement).
mental conditions.
Birds exhibited distinct movement behaviours
during transience. Transient birds were significantly Dispersers make more efficient displacements
faster in their moving speed when compared to other
stages (Figure 2bi), and when compared to residents Transient birds’ movements translated to a significant
(Figure 2bii). Transient also made significantly straighter decrease in the energetic cost of transport. Dispersers
movements when compared to other stages (Figure 2ci) spent an average of 23.6% less energy to achieve a 50 m net
and when compared to residents (Figure 2cii). Despite displacement during transience relative to pre-departure
moving over much larger distances, transient birds did (Figure 4ai), and were similarly more efficient than resi-
not spend a greater amount of time moving relative dents (Figure 4aii). Birds also used an average 17.2% less
to pre-departure and post-settlement (Figure 2di), or energy per cumulative displacement during transience
when compared to residents (Figure 2d ii). Dispersing relative to pre-departure (Figure 4bi), a pattern that also
birds also showed no difference in the duration of their held when compared to resident birds (Figure 4bii).
(a) (i) Daily track length (km) (ii)
(b) (i) Movement speed (m s-1) (ii)
(c) (i) Straightness (SI) (ii)
(d) (i) Time spent moving (%) (ii)
(e) (i) Movement dura on ( ) (ii)
F I G U R E 2 Dispersing birds move farther, faster and straighter during the transience stage (green) than pre-departure (purple) or post-
settlement (yellow). (a–e) Summary of linear mixed-effect models (LMMs) characterizing movement behaviours across stages (coefficient±95%
confidence intervals), with significance (stars: *p ≤ 0.05, **p ≤ 0.01, ***p ≤ 0.001) estimated using pre-departure as the reference category
(the dotted vertical lines, corresponding to model intercepts). (a) Dispersers had longer daily track lengths when transient than during other
stages (i); a pattern which held when comparing dispersers to natal group residents on the same days (ii). (b) Transient birds exhibited higher
movement velocities compared to other stages (i), and when compared to residents (ii). (c) Transient birds moved straighter, exhibiting a higher
ratio between net and cumulative displacement, when compared to other stages (i) and when compared to residents (ii). (d) Dispersing birds
showed no change in the total amount of time spent moving at different stages (i), or when compared to natal group residents (ii). (e) Dispersing
birds did not express a significant change in the average duration of each burst of movement during transience (i), or when compared to natal
group residents (ii). Full model results are available in Tables S3-S12KLAREVAS-IRBY et al. | 7
Dispersers achieve substantial displacements disparate findings showing that animals exhibit differ-
with relatively small movement costs ent movement behaviours during transience (Elliot et al.,
2014; Killeen et al., 2014; Woollard & Harris, 1990) and
Our data revealed that dispersers did pay a higher total that the energetic costs incurred when making disper-
daily energetic cost during the transience stage than sal movements do not scale equally with the displace-
during the pre- departure and post- settlement stages ments these movements achieve (Benoit et al., 2020).
(Figure 5a). However, the scale of this increase—on av- Furthermore, we are able to go beyond these previous
erage 4.1% more over the course of a day—is substan- studies by showing that transient animals are able to
tially lower than the corresponding increase (33.8%) in achieve such large displacements by specifically chang-
displacement achieved. As with our other estimates, the ing how they move, and not by simply moving more. Our
comparison between dispersing individuals and resi- results demonstrate how both increases in straightness
dent members of their groups was consistent with the (efficiency in space) and speed (efficiency over time)
differences observed within individuals across stages contribute towards reducing the cost of transport when
(Figure 5b). making net displacements, with the increased efficiency
in achieving cumulative displacements demonstrating
the specific savings made by moving faster. By align-
DI SC US SION ing with previously disparate findings, our study reveals
what is likely to be a taxonomically widespread set of
We show that dispersers express distinct movement efficient movement strategies that animals employ when
behaviours during transience that can mitigate the en- dispersing. In doing so, our work suggests that the as-
ergetic costs of achieving the large displacements neces- sumed movement costs of dispersing (reviewed in Bonte
sary for dispersal. Our results bring together previously et al., 2012) may have been over-stated.
Our results show that dispersers can mitigate the en-
ergetic costs of movement by changing how they move.
However, the overall energetics of dispersal are also
influenced by trade-offs between foraging and moving
(Zollner & Lima, 2005). Vulturine guineafowl exhibit
0.066 reduced foraging-t ype movements (state 2) and an in-
1 3 crease in fast, directed movements (state 4) when tran-
0.043 sient (Figure 3). Reduced foraging movements could
indicate an additional cost beyond the mechanical
4
23
costs of displacement, but these costs could be further
0.
0.
offset by the timing of dispersal. We found that vultu-
0.020
0.008
0.008
0.027
00
2
rine guineafowl disperse following periods of increased
rainfall that correspond to periods of resource abun-
0.
00
1
dance (e.g. the emergence of termite alates, Darlington,
14
2
0.
1985), which have been shown to allow substantially
0.129 greater foraging efficiency in savannah-dwelling spe-
2 4 cies (Owen- Smith, 1979; Wronski, 2002), including
0.294 guineafowl (Kumssa & Bekele, 2013). Thus, dispersal
Pre-departure could coincide with periods of relaxed constraints on
Transience foraging time for transient animals. Further evidence
Post-settlement for this comes from our data showing that some indi-
viduals are capable of making large, continuous move-
F I G U R E 3 Dispersing birds exhibit less slow, tortuous
ments over 10 or more consecutive days (see Figure S1),
movements and more fast, directed movements during transience. suggesting that dispersers may not be fully depleting
A hidden Markov model (HMM) was used to identify four their energy reserves if they can continue moving for
behavioural states, representing animals: not moving (state 1), days at a time. However, during the transience pe-
making slow and tortuous foraging movements (state 2), making riod, birds occasionally spent entire days moving in
medium-speed movements with some changes in direction (state 3),
or moving quickly in a directed manner (state 4). Grey circles show
a foraging-like manner, which from anecdotal obser-
the representation of each state and arrows transition probabilities vations seem to also involve prospecting within non-
between states in the entire dataset; coloured dotted lines (pre- natal groups. How these days of reduced displacement
departure—purple; transience—g reen; post-s ettlement—yellow) serve to inform settlement and/or replenish birds’ en-
show representation of each state at each stage of dispersal (e.g. ergy reserves warrants further investigation.
during transience, state 2 is expressed less and state 4 is expressed
more). Full details of HMM outputs available in Table S13 while
Although we show that vulturine guineafowl follow a
the summary of the proportion of time birds spent in each state, cost-m itigating strategy which reduces their total cost of
according to dispersal stage, are available in Table S14 transport, they still often move slower than speeds whichEFFICIENT MOVEMENT STRATEGIES MITIGATE THE ENERGETIC
8 | COST OF DISPERSAL
(a) (i) Net displacement cost (ii)
(J kg-1 m-1)
(b) (i) Cumulave displacement cost (ii)
(J kg-1 m-1)
F I G U R E 4 Dispersers make more efficient displacements during transience (green) than during the pre-departure (purple) or post-
settlement (yellow) stages. Plots show the summary of linear mixed-effect models (LMMs) of the total cost of transport associated with making
either a 50 m net (a) or cumulative (b) displacement across stages (coefficient±95% confidence intervals), with significance (stars: **p ≤ 0.01,
***p ≤ 0.001) estimated using pre-departure as the reference category (the dotted vertical lines, corresponding to model intercepts). (a) Transient
birds paid a lower energetic cost to achieve a fixed-d istance net displacement than they did pre-departure or post-s ettlement (i), which also held
true when comparing the average cost paid by dispersers in a given hour to the average paid by residents of their natal group in the same hour
(ii). (b) Transient birds were also more efficient when measured in terms of cumulative displacements (i), and when compared to residents (ii).
Full model results are available in Tables S15-S18
(a)
Daily cost (kJ kg-1 day-1)
(b)
Δ Daily cost (kJ kg-1 day-1)
F I G U R E 5 Dispersing birds pay a relatively small increased daily cost of moving during transience. Plots show the summary of linear
mixed-effect models (LMMs) of daily energetic expenditure across stages (coefficient±95% confidence intervals), with significance (stars:
**p ≤ 0.01, ***p ≤ 0.001) estimated using pre-departure as the reference category (the dotted vertical lines, corresponding to model intercepts).
(a) Dispersers paid a significant, but relatively small (4.1% higher) daily movement cost during transience relative to pre-departure. (b) This
pattern also held when comparing dispersers to resident adults from their natal groups on the same days. Full model results are available in
Tables S19-S20
would maximally reduce these costs. Animals only ap- predation (Kramer & McLaughlin, 2001) and the poten-
proach their minimal cost of transport when running tial for injury (Wheatley et al., 2021). The diminishing
at their aerobic maximum (Taylor et al., 1970). In guin- per-unit savings in the costs of transport at very high
eafowl, this speed should be approximately 2.78 m s−1 movement speeds are therefore likely to become negligi-
(Ellerby et al., 2003), which is much higher that the esti- ble relative to the increase in other, related costs. Thus,
mated average speed of 0.307 m s−1 exhibited by transient it may be that the critical speed as described under labo-
birds in our study (Figure 2b, Table S5). However, the ratory conditions may not accurately reflect an optimal
average speed we observed closely matches what might strategy for cost-reduction in wild animals which have
be an alternative optimal point along the speed- cost evolved to balance multiple constraints as they move
curve: the point of maximal curvature (here 0.316 m s−1; through their environments. Our results suggest that,
Figure 6), where the benefits of increased efficiency with while dispersing animals are capable of travelling at
increasing speeds taper-off the fastest. Several factors highly-efficient speeds, other contextual factors—such
can shape what optimality criterion applies to animal as increased risk from moving alone, navigational chal-
movements (Pyke, 1981), with higher speeds imposing lenges or reduced foraging constraints— are likely to
greater costs arising from diminished spatial informa- determine the optimal movement strategy at any given
tion processing (Chittka et al., 2009), increased risk of point in time or space.KLAREVAS-IRBY et al. | 9
We also note that, while birds averaged a speed near the how they move. Our study reveals distinct movement
point of maximum curvature in the speed-to-metabolic- behaviours during transience that are consistent with
cost relationship, they often moved at speeds that were those from other species. Specifically, dispersers across
above or below this asymptotic point (95% range of ve- a range of terrestrial species, including foxes (Vulpes
locities during transience: 0.094–0.792 m s−1), meaning vulpes) (Woollard & Harris, 1990), lions (Panthera leo)
that their energy use was greater than it would have (Elliot et al., 2014) and elk (Cervus canadensis) (Killeen
been had they moved at their average speed (0.307 m s−1) et al., 2014), exhibit distinctly faster and straighter move-
throughout (due to Jensen’s inequality, sensu Denny, ments during transience. These results lead to a poten-
2017). The difference in interpretation when using av- tially general insight into terrestrial dispersal and how
erage speed values versus the second-by-second speeds animals can reduce the cost of transport over large dis-
highlights the importance of collecting high-resolution tances to offset the energetic costs of dispersing. Further,
movement data for generating insights about the drivers the relationship between movement speed and the cost
of animal movement. Such fine-scale data should allow of transport is likely to be highly conserved across spe-
for a bottom-up approach when modelling energy land- cies, with the relationship in guineafowl being consis-
scapes (Shepard et al., 2013) or resistance surfaces (Zeller tent with the allometric relationship derived from many
et al., 2012). How landscape features facilitate or restrict terrestrial species and gait types (Figure 6). Thus, the
movement speed, straightness or continuity—as mea- seemingly adaptive movement strategies we report are
sured by deviations from the most-efficient movement likely to be common across species. Our results are also
behaviours— could be used to predict where animals consistent with how migrating insects (Wikelski et al.,
should move and subsequent landscape connectivity 2006), birds (Wikelski et al., 2003), bats (O’Mara et al.,
(Diniz et al., 2020). Thus, landscape-level tools com- 2019) and ungulates (Sawyer & Kauffman, 2011) move.
bined with high-resolution movement tracks could help All express straighter long-distance movements that are
to identify the factors that shape individuals’ decision- distinct from tortuous foraging movements, suggesting a
making on the go. general selective pressure for movement efficiency aris-
Whether to avoid in- breeding (Gandon, 1999; ing from a range of social and ecological drivers.
Matthysen, 2012) or social conflicts (Christian, 1970;
Cozzi et al., 2018), individuals depart their natal en- AC K NOW L E D GE M E N T S
vironment in search of new places to settle (Clobert We thank the Mpala Research Centre, Ol Jogi Wildlife
et al., 2001; Hamilton & May, 1977). For dispersal to be Conservancy, the Kenyan Wildlife Service, the
adaptive, selection should favour strategies that miti- National Environment Management Authority and
gate the costs of dispersing. Such strategies include not the Ornithological Section of the National Museums of
only when (Tarwater & Brawn, 2010) and where (Cox & Kenya for supporting this research work. We also thank
Kesler, 2012; Cozzi et al., 2018) animals move, but also Mr. Peter Jessel and El Karama Ranch for their support in
allowing us to track dispersing guineafowl. We are grate-
ful to Brendah Nyaguthii, Wismer Cherono and John
Cost of Transport (J kg−1m−1)
250
Quadrupeds Ewoi for field assistance, and to Roland Kays and Arpat
Primates Ozgul for their feedback on the study and manuscript.
Bipeds The research was funded by the Max Planck Society,
Guineafowl
grants awarded to D.R.F.: an Eccellenza Professorship
150
Allometric
Grant of the Swiss National Science Foundation (Grant
Number PCEFP3_187058), a grant from the European
Research Council (ERC) under the European Union’s
Horizon 2020 research and innovation programme (grant
*
50
agreement No. 850859) and a grant from the Association
for the Study of Animal Behaviour. The study benefited
0
0.2 0.4 0.6 0.8 1.0 from additional funding from the Max Planck– Yale
Center for Biodiversity Movement and Global Change,
Speed (m s−1)
and support from the Deutsche Forschungsgemeinschaft
(DFG, German Research Foundation) under Germany's
F I G U R E 6 The energetic cost of transport decreases non-
linearly with speed. The relationship between movement speed and
Excellence Strategy –EXC 2117–422037984. Open Access
the energy needed to move a given distance is conserved across funding enabled and organized by Projekt DEAL.
terrestrial taxa and gait types. Formulas for cost of movement as
a function of speed were taken from laboratory studies of oxygen AU T HOR C ON T R I BU T ION
consumption (Chassin et al., 1976; Taylor et al., 1982), including a J.A.K., M.W and D.R.F. conceived the study, J.A.K and
generalized allometric equation (dashed line). The cost of transport
for helmeted guineafowl (Ellerby et al., 2003), which we used in this
D.R.F. collected the data, J.A.K. and D.R.F. performed
study, is plotted in red, with the black star marking the asymptote of the analyses, J.A.K. and D.R.F. wrote the manuscript;
the curve all authors contributed to the final manuscript.EFFICIENT MOVEMENT STRATEGIES MITIGATE THE ENERGETIC
10 | COST OF DISPERSAL
similar diversity of aerobic scopes during running. Physiological
PE E R R E V I E W and Biochemical Zoology, 76, 695–703.
The peer review history for this article is available at Elliot, N.B., Cushman, S.A., Loveridge, A.J., Mtare, G. & Macdonald,
https://publons.com/publon /10.1111/ele.13763. D.W. (2014) Movements vary according to dispersal stage, group
size, and rainfall: The case of the African lion. Ecology, 95,
2860–2869.
DATA AVA I L A B I L I T Y STAT E M E N T
Gandon, S. (1999) Kin competition, the cost of inbreeding and the evo-
The datasets used in our analyses and all code required to lution of dispersal. Journal of Theoretical Biology, 200, 345–364.
replicate the present study is available via the Figshare re- Greenwood, P.J. (1980) Mating systems, philopatry and dispersal in
pository at https://doi.org/10.6084/m9.figshare.14363600.v1. birds and mammals. Animal Behaviour, 28, 1140–1162.
Hamilton, W.D. & May, R.M. (1977) Dispersal in stable habitats.
Nature, 269, 578–581.
R EF ER ENCE S
Isbell, L.A., Cheney, D.L. & Seyfarth, R.M. (1993) Are immigrant ver-
Alberts, S.C. & Altmann, J. (1995) Balancing costs and opportunities: vet monkeys, Cercopithecus aethiops, at greater risk of mortality
Dispersal in male baboons. American Naturalist, 145, 279–306. than residents? Animal Behaviour, 45, 729–734.
Armansin, N.C., Stow, A.J., Cantor, M., Leu, S.T., Klarevas-Irby, Kays, R., Crofoot, M.C., Jetz, W. & Wikelski, M. (2015) Terrestrial
J.A., Chariton, A.A. & et al. (2020) Social barriers in ecologi- animal tracking as an eye on life and planet. Science, 348(6240),
cal landscapes: The social resistance hypothesis. Trends in aaa2478.
Ecology & Evolution, 35(2), 137– 148. https://doi.org/10.1016/j. Kenward, R.E. (2000) A manual for wildlife radio tagging. London,
tree.2019.10.001 UK: Academic press.
Batschelet, E. (1981) Circular statistics in biology. New York, NY: Killeen, J., Thurfjell, H., Ciuti, S., Paton, D., Musiani, M. & Boyce,
Academic Press. M.S. (2014) Habitat selection during ungulate dispersal and ex-
Benoit, L., Hewison, A.J.M., Coulon, A., Debeffe, L., Grémillet, D., ploratory movement at broad and fine scale with implications for
Ducros, D. et al. (2020) Accelerating across the landscape: The conservation management. Movement Ecology, 2, 1–13.
energetic costs of natal dispersal in a large herbivore. Journal of Kramer, D.L. & McLaughlin, R.L. (2001) The behavioral ecology of
Animal Ecology, 89, 173–185. intermittent locomotion1. American Zoologist, 41, 137–153.
Bonte, D., Van Dyck, H., Bullock, J.M., Coulon, A., Delgado, M., Kranstauber, B., Smolla, M. & Scharf, A.K. (2020). move: Visualizing
Gibbs, M. et al. (2012) Costs of dispersal. Biological Reviews, 87, and Analyzing Animal Track Data.
290–312. Kumssa, T. & Bekele, A. (2013) Population status, feeding ecology
Bowler, D.E. & Benton, T.G. (2005) Causes and consequences of ani- and activity pattern of helmeted guinea fowl [Numidia melea-
mal dispersal strategies: Relating individual behaviour to spatial gris] in Abijata-Shalla Lakes National Park. African Journal of.
dynamics. Biological Reviews, 80, 205–225. Environmental Science and Technology, 7, 49–55.
Chassin, P.S., Taylor, C.R., Heglund, N.C. & Seeherman, H.J. (1976) Kuznetsova, A., Brockhoff, P.B. & Christensen, R.H.B. (2017) lmerT-
Locomotion in lions: Energetic cost and maximum aerobic ca- est package: Tests in linear mixed effects models. The Journal of
pacity. Physiological Zoology, 49, 1–10. Statistical Software, 82, 1–26.
Cheney, D.L. & Seyfarth, R.M. (1983) Nonrandom dispersal in free- Marsh, R.L., Ellerby, D.J., Henry, H.T. & Rubenson, J. (2006) The
ranging vervet monkeys: social and genetic consequences. The energetic costs of trunk and distal-limb loading during walking
American Naturalist, 122, 392–412. and running in guinea fowl Numida meleagris: I. Organismal
Chittka, L., Skorupski, P. & Raine, N.E. (2009) Speed- accuracy metabolism and biomechanics. Journal of Experimental Biology,
tradeoffs in animal decision making. Trends in Ecology & 209, 2050–2063.
Evolution, 24, 400–407. Matthysen, E. (2012) Multicausality of dispersal: A review. Dispersal
Christian, J.J. (1970) Social subordination, population density, and Ecology and Evolution, 27, 3–18.
mammalian evolution. Science, 168, 84–90. O’Mara, M.T., Wikelski, M., Kranstauber, B. & Dechmann, D.K.N.
Clobert, J., Danchin, E., Dhondt, A.A. & Nichols, J.D. (2001) (2019) First three-d imensional tracks of bat migration reveal
Dispersal. Oxford: Oxford University Press. large amounts of individual behavioral flexibility. Ecology, 100,
Clobert, J., Le Galliard, J.F., Cote, J., Meylan, S. & Massot, M. (2009) 1–4.
Informed dispersal, heterogeneity in animal dispersal syn- Owen-Smith, N. (1979) Assessing the foraging efficiency of a large her-
dromes and the dynamics of spatially structured populations. bivore, the kudu. African Journal of Wildlife Research, 9, 102–110.
Ecology Letters, 12, 197–209. Papageorgiou, D., Christensen, C., Gall, G.E.C., Klarevas-Irby, J.A.,
Cox, A.S. & Kesler, D.C. (2012) Prospecting behavior and the influen- Nyaguthii, B., Couzin, I.D. et al. (2019) The multilevel society
ceof forest cover on natal dispersal in aresident bird. Behavioral of a small-brained bird. Current Biology, 29(21), R1120–R1121.
Ecology, 23, 1068–1077. https://doi.org/10.1016/j.cub.2019.09.072.
Cozzi, G., Maag, N., Börger, L., Clutton-Brock, T.H. & Ozgul, A. Pyke, G.H. (1981) Optimal travel speeds of animals. The American
(2018) Socially informed dispersal in a territorial cooperative Naturalist, 118, 475–487.
breeder. Journal of Animal Ecology, 87, 838–849. R Core Team (2020) R: A language and environment for statistical com-
Darlington, J.P.E.C. (1985) Lenticular soil mounds in the Kenya high- puting. Vienna: R Foundation for Statistical Computing.
lands. Oecologia, 66, 116–121. Sawyer, H. & Kauffman, M.J. (2011) Stopover ecology of a migratory
del Delgado, M.M., Penteriani, V., Nams, V.O. & Campioni, L. (2009) ungulate. Journal of Animal Ecology, 80, 1078–1087.
Changes of movement patterns from early dispersal to settle- Shepard, E.L.C., Wilson, R.P., Rees, W.G., Grundy, E., Lambertucci,
ment. Behavioral Ecology and Sociobiology, 64, 35–43. S.A. & Vosper, S.B. (2013) Energy landscapes shape animal
Denny, M. (2017) The fallacy of the average: On the ubiquity, utility movement ecology. The American Naturalist, 182, 298–312.
and continuing novelty of Jensen’s inequality. J. Experimental Tarwater, C.E. & Brawn, J.D. (2010) Family living in a Neotropical
Biology, 220, 139–146. bird: Variation in timing of dispersal and higher survival for de-
Diniz, M.F., Cushman, S.A., Machado, R.B. & De Marco Júnior, P. layed dispersers. Animal Behaviour, 80, 535–542.
(2020) Landscape connectivity modeling from the perspective of Taylor, C.R., Heglund, N.C. & Maloiy, G.M. (1982) Energetics and
animal dispersal. Landscape Ecology, 35, 41–58. mechanics of terrestrial locomotion. I. Metabolic energy con-
Ellerby, D.J., Cleary, M.E., Marsh, R.L. & Buchanan, C.I. (2003) sumption as a function of speed and body size in birds and mam-
Measurement of maximum oxygen consumption in guinea fowl mals. Journal of Experimental Biology, 97, 1–21.
numida meleagris indicates that birds and mammals display aKLAREVAS-IRBY et al. | 11
Taylor, C.R., Schmidt-Nielsen, K. & Raab, J.L. (1970) Scaling of ener- Yoder, J.M., Marschall, E.A. & Swanson, D.A. (2004) The cost of dis-
getic cost of running to body size in mammals. American Journal persal: Predation as a function of movement and site familiarity
of Physiology-L egacy Content, 219, 1104–1107. in ruffed grouse. Behavioral Ecology, 15, 469–476.
Van Dyck, H. & Baguette, M. (2005) Dispersal behaviour in frag- Zeller, K.A., McGarigal, K. & Whiteley, A.R. (2012) Estimating land-
mented landscapes: Routine or special movements? Basic and scape resistance to movement: A review. Landscape Ecology, 27,
Applied Ecology, 6, 535–545. 777–797.
Visser, I. & Speekenbrink, M. (2010) depmixS4: An R Package for Zollner, P.A. & Lima, S.L. (2005) Behavioral tradeoffs when dispers-
Hidden Markov Models. Journal of Statistical Software, 36, 1–21. ing across a patchy landscape. Oikos, 108, 219–230.
Wheatley, R., Buettel, J.C., Brook, B.W., Johnson, C.N. & Wilson,
R.P. (2021) Accidents alter animal fitness landscapes. Ecology
Letters. S U PP ORT I NG I N F OR M AT ION
Wikelski, M., Moskowitz, D., Adelman, J.S., Cochran, J., Wilcove,
Additional supporting information may be found online
D.S. & May, M.L. (2006) Simple rules guide dragonfly migra-
tion. Biology Letters, 2, 325–329. in the Supporting Information section.
Wikelski, M., Tarlow, E.M., Raim, A., Diehl, R.H., Larkin, R.P. &
Visser, G.H. (2003) Costs of migration in free-f lying songbirds.
Nature, 423, 704. How to cite this article: Klarevas-Irby JA, Wikelski
Woollard, T. & Harris, S. (1990) A behavioural comparison of dispers- M, Farine DR. Efficient movement strategies
ing and non-d ispersing foxes (Vulpes vulpes) and an evaluation mitigate the energetic cost of dispersal. Ecology
of some dispersal hypotheses. Journal of Animal Ecology, 59, 709.
Letters. 2021;00:1–11. https://doi.org/10.1111/
Wronski, T. (2002) Feeding ecology and foraging behaviour of impala
Aepyceros melampus in Lake Mburo National Park, Uganda. ele.13763
The African Journal of Ecology, 40, 205–211.You can also read