Electric Bicycles in Marin County - Transportation Authority of Marin (TAM) September 2020
←
→
Page content transcription
If your browser does not render page correctly, please read the page content below

Transportation Authority of Marin (TAM)
Electric Bicycles in Marin County

September 2020
Electric Bicycles Overview

Table of Contents
                                                             Page
Executive Summary………………………………………………………………….                  2
Introduction……………………………………………………………………………..                  3
Types of E-bikes and Legal Definitions…………………………………….        4
Jurisdictional Policies………………………………………………………………..            5
E-bikes and Public Transportation…………………………………………....        6
E-bike Specifics…………………………………………………………………………                 7
E-bike Benefits and Constraints………………………………………………..          8
Potential E-bike Enhanced Routes in Marin County………………….     14
E-bike Counts……………………………………………………………………………                   21
E-bike Trends and Opportunities……………………………………….……            22
E-bike Incentive Programs………………………………………………………               24
Infrastructure Opportunities………………………………………………………            29
Conclusions………………………………………………………………………………..                  33
Appendix A: Local E-Bike Retailers E-bike Survey……………………..   34
Appendix B: Quantifying the Transportation Benefits……………….   38

                                                                    Marin County | 1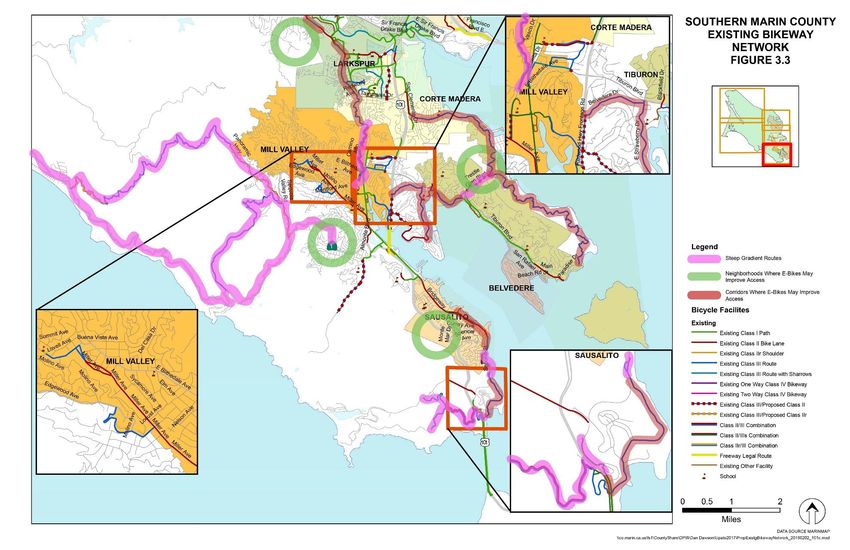
Electric Bicycles Overview

Executive Summary
The purpose of this report is to identify the potential role e-bikes can play as part of the transportation
system in Marin County, and, if they help reduce the impacts of vehicle use, what public agencies (including
TAM) and private entities can do to encourage their use. This report looks at the history of e-bike
development, the technical aspects of e-bikes, trends in sales and usage, ridership in Marin County, and
specific actions public and private entities can do to support their use for transportation purposes. This
includes, for example, subsidies to reduce the cost of e-bikes by employers in Marin County, and supporting
facilities (such as secure bike parking) to improve the connection to transit. E-bikes may also be an effective
extension of current transit and commuter rail (SMART) services in Marin County, although e-bike weight (50
to 70 pounds) make them too heavy to be loaded onto bus racks and they are not currently allowed on
Golden Gate ferries. Finally, some specific neighborhoods and corridors in Marin County may benefit from
improved access by the use of e-bikes. For example, neigborhoods like Tam Valley may become more
accessible by bicycle with expansion of e-bikes in the County—reducing vehicle traffic. Class III bike route
corridors like San Pedro Road in San Rafael may see increased e-bike usage as cyclists are able to easily
climb hills and move closer to the speed of vehicle traffic.

E-bikes have many benefits compared to traditional bicycles. These benefits fall into three major buckets:
speed and comfort, distance, and terrain. In terms of speed and comfort, e-bikes allow riders to reach slightly
higher average speeds than traditional bikes (15 mph compared to 9 mph) and allow riders to reach their
average speed quicker. E-bikes foster bicycle trips to destinations that are further away and encourages trip-
chaining (stopping at multiple destinations in one journey). Traveling further distances faster while exerting
less effort can also promote more commuter trips as e-bikes may not require the same support facilities
(such as shower and changing facilities) as traditional bicycles. E-bikes, however, may require more robust
and secure bike parking facilities due to their cost.

Studies and surveys have shown that the absence of those items is commonly stated as one of the reasons
they opted not to bike to work. Helping to overcome steep terrain is one of the most frequently cited
benefits of e-bikes. The electric-assist motor can both physically help riders move up hills and also remove
the mental barriers associated with biking through hilly areas. Similarly, the engine can also help those with
physical limitations like bad knees. The assist motor allows these users to bike around, on both steep and
level terrain, while putting less stress on joints, opening up biking to a broader audience of people. This is
important in a place like Marin County where there is an older-than-average population, a large number of
young families, and a general interest in health and the environment. Additionally, many trips in Marin
County are shorter utility trips (shopping, etc.) and lend themselves well to e-bikes.

The continued adoption of e-bikes is not without drawbacks and limitations. The four main drawbacks of e-
bikes currently include costs, technological limitations, weight, and limited distribution channels. E-bikes are
more expensive than their traditional bike counterpart. The increased cost can be a major barrier for many
looking to enter the e-bike market, with the cheapest e-bikes still costing hundreds of dollars. Top-of-the-
line e-bikes can cost in the tens of thousands of dollars. E-bike technology has advanced significantly over
time, especially in recent years, but there are still limitations. Battery technology is limited and can have a

2 | Marin County
Electric Bicycles Overview

shorter lifespan than other bicycle components. E-bikes are also more complicated to maintain and may
need special services that are not available at some bike shops. The weight of e-bikes (50 to 70 pounds) is a
barrier to putting them on bus racks, storing or parking them where they need to be lifted, and even putting
them on bike racks on cars. Weights are slowly dropping as battery manufacturing innovations occur.
Lastly, as their market share is still relatively small, e-bikes are currently not as widely available as traditional
bikes, further limiting access to them. Hopefully, all three of these limitations will continue to improve over
time as technology continues to improve, demand rises, and costs fall.

In recent years, e-bike sales have been increasing, and this growth is expected to continue. Some estimates
say that the global e-bike market will grow by over 9% annually and the United States e-bike market by over
19% by 2024. Most of this growth will be supported by Class I pedal-assist bikes (currently over 85% of the
market). This type of bike is also the type of e-bike most commonly found in bike share systems.

Government agencies can help e-bike growth by both developing incentive programs but also by continuing
to develop bicycle infrastructure and support facilities (secure parking, charging stations, etc.). This memo
also includes the results of a survey of Marin County bike shop owners that confirm the global trends are
taking hold in Marin County, and the e-bike growth here will continue. A count conducted in May 2020 on
the Mill Valley-Sausalito Bike Path revealed that e-bikes make up between four (4) and five (5) percent of
bicycles in Marin County currently. An estimate of saved vehicle trips by e-bikes shows that e-bikes reduce
about 2.5 million vehicle miles traveled (VMT) per year currently (source: E-bike Demand and Benefit
Projections; see Appendix B).

Potential recommendations to facilitate the growth of e-bikes in Marin that emerged from this report
include:

    (1)   Improved secure bicycle parking for e-bikes
    (2)   Improved infrastructure such as bike lanes
    (3)   Potential leasing or subscription services to overcome cost barrier
    (4)   Public agency e-bike fleets for staff
    (5)   Employer-based incentive programs for e-bikes
    (6)   Public charge stations such as Swiftmile and Kuhmute
    (7)   Improved transit/rail/ferry access and/or parking
    (8)   Improved safety through signage, regulations, enforcement and physical improvements

Introduction
As transportation trends continue to shift, bolstered by COVID-19 induced changes, bicycles – especially e-
bikes – have a significant role to play in supporting more active, healthier lifestyles, and the environment. E-
bikes have a long history but have only recently begun gaining considerable popularity in America. Due to
advancements in technology and design, e-bikes are now available in a wide range of bike types across
several price ranges. This memo will break down the benefits and constraints of e-bikes, methods to

                                                                                                      Marin County | 3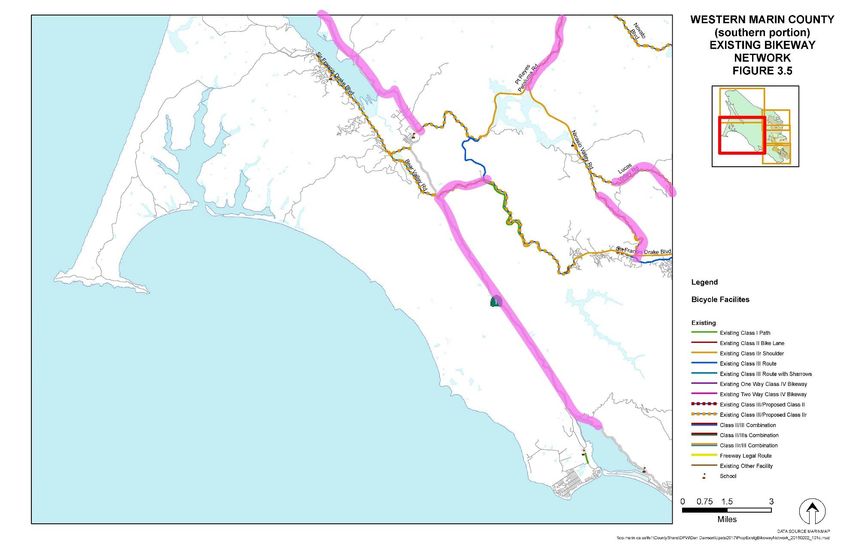
Electric Bicycles Overview

incentivize increased use of e-bikes and e-bike trends. Data specific to Marin County will also be discussed,
including the results from a survey of local bike shop owners and highlighting specific corridors in Marin
County where e-bike and e-bike infrastructure would make the most impact.

E-bikes: A brief History
Electric bikes (e-bikes) have been in existence since the 1800s
and saw continual development through the early 1900s. In
1989, one of the most important innovations was created in the
form of the first ‘Pedelec’ or Pedal Electric Cycle (now known as
pedal-assist) in which the motor power is triggered as
assistance when any pedaling action is registered by the bike.
Rather than using a throttle mechanism to control the motor,
as all previous models had, this allowed riders to utilize an
electric bike not so dissimilar to how one would ride a regular
bike. Michael Kutter developed these pedelec systems on a few
of his personal bikes and then went on to assist the Velocity       Michael Kutter and his early pedelec bicycles.
Company in creating the 1992 Dolphin Electric Bike for
consumers to purchase. Following Kutter’s pedelec bicycles, pedal-assist has become commonplace for
modern electric bicycles. Further improvements have been made into modern electric bikes as well in the
form of Lithium-Ion batteries to increase capacity while keeping overall battery weight significantly lower
than some of its competitors and predecessors,” (Rad Power Bikes).

Types of E-bikes and Legal Definitions
In 2015, AB 1096 amended the California Vehicle Code (CVC) to define electric bicycles and the three classes
they fall into. The three classes are described below:
Class 1: Low-Speed Pedal-Assisted (pedelec) Electric Bicycles
The most common type of electric bike is the pedal-assist or pedelec. The rider pedals the bike normally
while a motor assists, increasing the power transmitted to the rear wheel. The pedaling takes far less effort
than it usually would, even in high gears, which allows for higher speeds and effortless climbing over steep
hills and longer journeys while exerting less energy. Settings can control the amount of assistance the rider
desires, but to be considered a Class 1 e-bike, the engine can only supply power up to 20 mph. These bikes
can travel faster than 20 mph, but the engine will not generate thrust above that threshold.

Class 2: Low-Speed Throttle-Assisted Electric Bicycles
These throttle-assisted electric bikes include a throttle that controls assistance provided by the electric
motor. Pedaling is not required for the engine to generate thrust. Similar to Class 1 e-bikes, low-speed
throttle-assisted bicycle motors are also limited to 20 mph.

4 | Marin County

Electric Bicycles Overview

Class 3: High-Speed Pedal-Assisted Electric Bicycles
Class 3 pedal-assisted bicycles operate similarly to Class 1 pedal-assisted bikes, except the Class 3 bikes have
an allowed top-assisted speed of 28 mph. In California, Class 3 e-bikes are required to have a speedometer.
Riders of Class 3 e-bikes must also be at least 16 years old and are required to wear a helmet.

Other California Legal Requirements
Use:
Class 1 and Class 2 e-bikes are allowed in all on-street bicycle
facilities. They are allowed “by default” in off-street bicycle paths and
trails unless the governing jurisdiction prohibits them. Class 3
bicycles are prohibited “by default” on both on-street bicycle
facilities and off-street bicycle paths and trails but may be allowed
by local governing jurisdictions.

                                                                                A Flux e-bike in San Francisco.
Labels:
Beginning in 2017, all e-bikes manufactured or purchased in California are required to have a manufacturer
affixed label that contains the following:
    •     Classification number
    •     Top-assisted speed
    •     The wattage of the motor

Jurisdictional Policies
State of California
California passed AB 1096 Vehicles: Electric Bicycles on 2015 which identified three classes of bicycles
(described previously), a 750-watt and 20 mph maximum powered speed for Class I and II e-bikes, and
amended the vehicle code to require adequate labeling and warning on e-bikes related to their power
and speed capabilities, set limits on persons under the age of 16 to use Class III e-bikes and
requirements to wear helmets. The law identifies Class III e-bikes may not be operated on bicycle
paths or trails, bikeways, or bike lanes, equestrian trails, hiking, or recreation trails unless they are
adjacent to a public roadway. Local agencies have the right to adopt ordinances or permits that
provide local exceptions to this law. Class I and II e-bike access to bikeways and trails are also subject
to local approval and ordinance. The three classes of e-bikes in AB 1096 have been described
previously.
Marin County
In September 2019, the Marin County Board of Supervisors approved updated the Marin County Code to
accommodate e-bikes. Marin County policies were updated to allow Class 1 and Class 2 e-bikes on public
roads and parking lots, on County-owned paved bicycle and multiuse pathways, and other areas where
signed. This includes the Mill Valley-Sausalito Bike Path and the Corte Madera Creek Pathway. E-bikes are
                                                                                                 Marin County | 5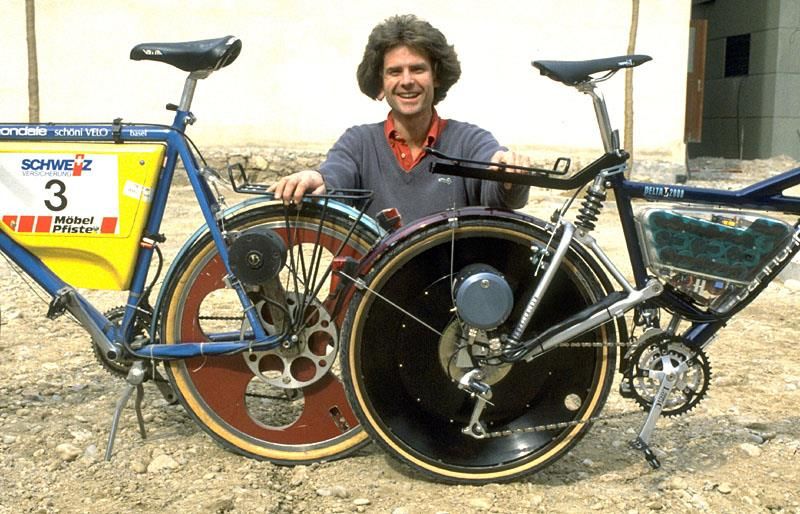
Electric Bicycles Overview

currently not allowed on unpaved trails in Marin Open Space District and Preserve lands. Class 3 e-bikes are
allowed on public roads and parking lots but prohibited within parks and on bike paths unless otherwise
signed. This may limit the appeal of Class 3 bicycles for many people. Speeds are limited to 10 or 15 mph,
dependent on the path.
Marin Municipal Water District
E-bikes, of all classes, are currently prohibited on MMWD lands, except on public roads and parking lots.
The MMWD Board most recently received an update on the e-bike
policy on District lands in March 2019.
National Park Service
In August of 2019, the Department of Interior updated National Park
Service (NPS) policy to allow parks to amend their compendium to
allow the use of e-bikes. The GGNRA (which includes Marin
Headlands) compendium provides rules and policies for all GGNRA
parks and facilities. Class 1 and Class 2 e-bikes will be allowed in
areas where traditional bicycles are allowed and are subject to the
same speed limits: 15 mph in most places and five mph in high-
congestion areas. Pt. Reyes National Seashore has not adopted
                                                                        Bikes in Chrissy Field (GGNRA). – Image:
specific guidance on e-bikes.
                                                                                           NPS
E-bikes and Public Transportation
E-bikes can play an important first/last mile
for Marin’s transit services. E-bikes can
facilitate access to and from buses and trains
from local residential areas and employment
centers. A new e-bike share system is being
planned for SMART’s stations, which will help
expand access. Constraints occur where e-
bikes cannot be loaded onto a rail or transit
vehicle at a level platform, as the size and
weight of the bicycle limits loading. Current
policies and practices for Marin’s transit              Bike racks onboard SMART trains. – Image: SMART
providers are summarized below.
SMART
SMART currently provides bike parking at is stations, and allows up to 24 bicycles onboard its trains. SMART
is also developing a multiuse paved pathway along segments of its corridor that are open to e-bikes. A
contract was recently awarded to the e-bike share company Gotcha for 300 GPS-enabled e-bikes, being
developed by the Transportation Authority of Marin (TAM) and the Sonoma County Transportation Authority
(SCTA), to be located at SMART stations in Marin and Sonoma Counties.
Golden Gate Bridge, Highway, & Transportation District
Currently, e-bikes are not allowed on GGBHTD ferries or buses.

6 | Marin County
Electric Bicycles Overview

Marin Transit
Currently, e-bikes are not allowed on Marin Transit buses.

E-bike Specifics
How to Charge an E-bike
Most e-bikes are charged in the owner’s home by removing the battery and plugging into a standard 120
amp household outlet. In some cases the battery can remain on the bicycle and simply be plugged into a
standard outlet through a connector. A red light indicates the battery is charging. A green light indicates
the battery is full. It will take between two and six hours for the battery to fully charge. A general rule of
thumb is about 15 miles per hour of charging.
Power and Range
Power
All e-bikes have batteries, but individual models of e-bikes have batteries of different chemical compositions
and sizes and motors with different watt outputs. E-Bike batteries are typically either lithium-ion, lead-acid,
nickel-metal-hydride, or nickel-cadmium. Each battery type has different characteristics, including re-charge
time, acceleration, and torque. Battery technology is continuously improving and changing, with lithium-ion
the most commonly-used today. E-bikes are available with battery type of either 8, 12, or 18-amp hour
batteries.
At the heart of any e-bike is an electric motor, and it can be located in one of two places, the center of the
frame or one of the hubs. The location of the drive unit determines how the bike fundamentally operates
and what it is capable of.
The front hub motor is the simplest e-bike design and, as such, is the most limited in capability. Front hub
motors are generally only used with throttle systems as it is more challenging to provide assistance based on
rider input when the motor is not part of the drivetrain. Exceptions do exist, such as the Brompton folding e-
bike, which utilizes a front hub motor and pedal assist. They can also have problems with traction since the
majority of the weight on a bicycle is over the rear wheel. Cornering while accelerating can be especially
tricky when the drive unit is in the front wheel. Given these limitations, the front hub motor is the least
common e-bike system and is most often found on inexpensive conversion kits as they can easily be added
to almost any bike.
A rear hub motor can accommodate both throttle and pedelec, and many systems offer both with the flip
of a switch. They can also be retro-fitted to non-folding bike frames, so they are the most popular for electric
conversions. They’re fairly inexpensive to produce and can go unnoticed since they appear much like an
oversized traditional bike hub. However, they create an uneven distribution of weight with the motor in the
rear wheel, which can affect handling.
A mid-drive e-bike system places the motor in the center of the bike frame and integrates it with the
bottom bracket and cranks. Since the motor is activated by pedaling, a bike with a mid-drive system will
always be a pedelec. The mid-drive design offers many benefits over a hub motor, making it the system of
choice for most pedal assist production bikes. A mid-drive delivers more torque than a similarly powered
hub motor and, by being centrally located, distributes weight more evenly on the bike. The motor is driving

                                                                                                  Marin County | 7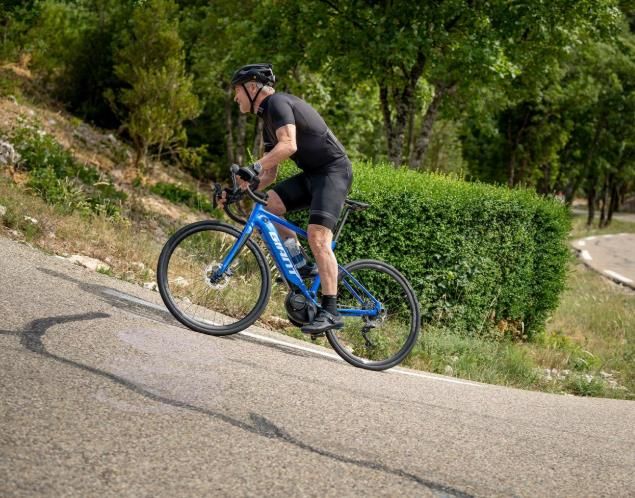
Electric Bicycles Overview

the crank arms rather the wheel so it can take better advantage of the range of gears on the bike. A torque
sensor can also be more easily integrated to measure the amount of input from the rider. This sensor allows
the amount of assistance to be automatically varied to match the intensity of the rider’s pedaling, which
creates a smoother, more fluid experience.

Range
The range of any given e-bike is going to vary based on a number of factors including:
    •    Weight of the bike
    •    Weight of the rider
    •    Level of assistance provided
    •    Ability to control the amount of engine assistance
    •    Terrain/topography
    •    Travel speed
    •    Wind, road conditions
    •    Temperature (i.e., cold weather makes batteries less effective)
Manufactures provide range estimates for their bicycles, but the actual numbers will vary based on the above
factors. The average range of an e-bike in Marin County is between 20 and 35 miles depending on factors
above, which should be sufficient to reach most destinations in the US 101 corridor in Marin and back. A re-
charge may be needed, for example, if a person were to ride to Pt. Reyes National Seashore and back to a
destination such as Larkspur. Bicyclists may also carry a spare battery to extend range, although the weight
and cost may limit the potential of this option.

Styles
E-bikes come in an almost endless variety of styles, weights, batteries, and other features. The basic style
types, however, are either E-Mountain Bike, E-Road Bike, E-Street (pavement) Bike, or E-Cargo Bike (also
known as Dutch cargo bikes or Bakfiets). Mountain E-Bikes have the same suspension, tires, and frames as
regular mountain bikes. Street E-
bikes have similar frames, tires,
and design as touring bicycles,

                   A cargo e-bike (set up to carry children), a mountain e-bike, and a folding e-bike.

designed primarily to be used on pavement or other hard surfaces. E-Road bikes are lightweight with
narrow tires and similar in design to non-electric road bikes. E-cargo bikes can be useful in carrying

8 | Marin County
Electric Bicycles Overview

groceries or other items home and bringing children to school, and they are increasingly seen around Marin
County ridden by parents with children aboard.

E-bike Benefits and Constraints
Benefits
Speed and Comfort
Many studies have attempted to quantify the benefits of e-bikes compared to traditional bikes. One study at
the University of Tennessee Knoxville studied trends within its hybrid bike share system. The system had a
mix of both traditional and electric bicycles. Based on user surveys, researchers found the following:
    •    Speed and convenience drew users to the bike share system, regardless of bike type.
    •    Speed and comfort drew users to e-bikes over the traditional bike.
    •    E-bike trips required about 25% less power from the rider to complete the same trip on a traditional
         bike.
The following graphic compares the acceleration differences over time between e-bikes and traditional bikes.

                                        Bicycle Acceleration Over Time

                                           Portland State University - TREC
Distance
The same UT Knoxville study also found many benefits in terms of distance traveled and destinations
accessible:
    •    E-bike trips were typically used for longer trips and allowed for additional stops during those trips.
    •    E-bikes in the system were used for a larger variety of trip types than traditional bikes.

A 2006 study by Karl Martens quantified the benefits of traditional bicycles in bridging longer distances to
and from transit stations. The study found that bicycles can extend the catchment area of transit stations,
                                                                                                   Marin County | 9
Electric Bicycles Overview
creating larger areas for access by bicycling. While e-bikes were not a part of this study, as others have more
recently shown, e-bikes can amplify that effect, creating even larger catchment areas. This can be very
beneficial, increasing access to SMART stations and the Larkspur, Tiburon, and Sausalito Ferry Terminals.
A 2007 study by Wardman, et. al found one of the additional benefits of e-bikes was that users could go the
same or further distances while exerting less energy is that using an e-bike that can entice additional people
to bicycle to work. Because e-bike riders exert less energy, there may be reduced demand for showers and
changing facilities at their workplace. Other studies have repeatedly shown first/last mile trips as highly-
desirable to making bicycling to work a practical option and reducing human effort (thus less sweat and
odor). E-bikes can offer approximately a 30% trip time savings over traditional bicycles in average
conditions.
The following graphic compares distance traveled over time between traditional and e-bikes.
Distance Traveled Over Time
Portland State University - TREC
Terrain
E-bikes provide those who live or have destinations in hilly areas
new mobility options that a traditional bike cannot provide. Steep
terrain is commonly found to be a detriment to bicycling because
of the additional effort required. Some people may not have the
strength or endurance, and others may have mobility limitations
(such as bad knees) that prevent biking over steeper terrain. The
electric-assist motor not only provides additional power but also
changes perceptions about biking over hills. The following chart
shows how electric engine size can change perceptions of
Biking up an incline with an e-bike.
steepness while biking over hills.
Image: eBike Choices
10 | Marin CountyElectric Bicycles Overview
Perceptions of Steepness by Engine Wattage
Portland State University - TREC
Reflections from the Marin County Bicycle Coalition on the benefits of E-bikes
The Marin County Bicycle Coalition (MCBC) published a list of e-bike benefits, which includes:
• E-bikes remove barriers to bicycling. E-bikes flatten hills and enable people to cover longer
distances in less time, making bicycling more accessible and enjoyable for people of all ages and
abilities.
• More people on bikes equals fewer people in cars. Whether on roads, pathways, or trails, every
person on an e-bike is someone who isn’t in a car. That’s a good thing for public health, traffic
congestion, and air quality.
• More people on bikes equals more people enjoying parks. As more people can access and enjoy
our public lands, the more support we will have to protect these lands and expand trail access.
• Studies show e-bikes have roughly the same impact on trails as traditional bicycles. In addition,
they facilitate access to remote less-visited park areas, reducing stress on primary trails while
improving public access to remote trails.
Marin County | 11Electric Bicycles Overview Constraints Costs Cost remains the top constraint to the continued growth in e- bike sales and usage. Most e-bies cost anywhere between $1,500 and $6,500, although there are more expensive and less expensive versions available. For example, Costco currently sells an e-bike for about $1,300. Price is a relative factor based on the perceived value of e-bikes as a transportation or recreation investment. There is also a relationship between cost and the quality of infrastructure since the value’ of e-bikes is at least partially based on the extent of its perceived use. An e- A Civia step Thru e-bike. – Image: Civia bike at any price will seem expensive if there are limited places to ride safely. Other constraints are discussed in detail below. The price of e-bikes is also expected to be reduced in the future based on industry consolidation and scale of production. Technological Challenges E-bikes have witnessed continuous research and development over the years. Nevertheless, there are still some technological challenges and gaps with the current e-bikes, which can hold back the growth of e-bikes sales and use. Battery maintenance is a major concern with e-bikes. Electric bike batteries have a limited life span, which is about 2-3 years for lithium-ion chemistry. In the case of throttle e-bikes, the throttle may get loose due to the rider’s tendency to pull it back and let it go without slow release. This affects the throttle in due time and may need to be replaced. For a mid-motor drive, controllers are not easily accessible and, thus, involve high expenses in the event of a malfunction. A trained technician can open the motor casing. Another common problem is with the chain/belt that can fall off due to inadequate tension or damaged sprocket. Chains and sprockets may get worn due to extensive use and need to be replaced. Infancy of the Market The fact that e-bikes are relatively new in the U.S. and the high number of vendors in the market may result in hesitation to purchase an e-bike until the market becomes more mature. People may be concerned that their e-bike manufacturer may go out of business and servicing/parts not available. Limited Distribution Channels The distribution channel is vital for the growth of a product in the market. An e-bike is a product with technically advanced components. It, thus, requires exclusive distribution channels and technically sound representatives who can guide customers about the technology to fulfill their requirements. Unfortunately, at present, there are limited e-bike retailers and distributors in many global markets. Many merchants and traditional bicycle retailers deal in e-bikes but lack the expertise and maintenance facilities to support the growing e-bike industry. Marin County is fortunate to have several e-bike retailers, yet their capacity to service and maintain e-bikes is relatively limited. Many e-bike manufacturers are trying to collaborate with independent dealers and mass retailers that will effectively deliver and provide aftersales services. 12 | Marin County
Electric Bicycles Overview

Safety Concerns
E-bicycle collisions are not tracked separately from
traditional bicycles, and therefore individual rates of
collisions are not currently available. It is a fact,
however, that e-bikes weigh more than traditional
bicycles and also travel at a higher speed on average.
This would likely translate into more significant injuries
than traditional bicycles unless adequate facilities were
constructed and managed. According to Ari Golan of
Marin County Parks, “we definitely had and heard
concerns regarding potential speed violations associated         Bay Trail Sign – Image: Marin Ind. Journal
with e-bikes when we were considering allowing them on
the paved paths. We have very few, if any, actual specific reports of speeding e-bikes on the paved paths
since allowing them last year. Bikes are speeding on the paths, and we get reports of bikes speeding on the
path, but folks may not be recognizing the bikes as e-bikes when/if they are. I am hoping to have staff out
on the paths soon to monitor how things are going and if there is a speeding issue associated with e-bikes.”

Weight
E-bike weight is a significant factor in its portability and potential uses. E-bikes tend to weigh more than
traditional bikes, with some weighing over 50 pounds. This means that some users cannot lift the bike for
storage, access transit, or otherwise lift the bicycle.

Infrastructure
The available roadway and bikeway network for e-bikes greatly impact the level of use in a community.
Marin County is fortunate to have numerous developed Class II bike lanes and Class I bike paths, yet critical
gaps remain where bicyclists must use heavily-trafficked roadways. Most of the existing bike paths are so
crowded during peak periods that they are constrained by the volumes of other bicyclists, pedestrians, dog-
walkers, and others, with limited or no opportunity be widened. The inability to be loaded onto ferries and
buses also restricts the available trip making in Marin.

Battery range/charge life
As discussed in the technical section of this report, battery life and range are a potential key issue for e-
bikes, although most e-bikes have a range up to five (5) hours and 20-35 miles, which would allow users to
access most Marin destinations. Longer trips, such as riding to West Marin or Sonoma County, might be
limited by battery life. The lack of publicly available e-bike chargers, and standardized public charging
equipment, is a constraint for the upper end of e-bike trips in terms of distance.

“Cheating’ factor

                                                                                                Marin County | 13
Electric Bicycles Overview
Some surveys of e-bike users indicate there is a perception by traditional bicyclists that e-bike users are
‘cheating’ by using assisted power. This is more often reported with e-mountain bicycles than street e-bikes.
This perceived stigma should fade as more and more people ride e-bikes. Also, most e-bike users own
traditional bicycles, diminishing the ‘cheating’ perception.
Secure bike parking
The lack of secure parking for e-bikes is a constraint in that it limits
trips people might make to destinations to transit, work, school, or
downtowns. The cost of e-bikes makes the availability of secure
parking even more critical. Secure parking for E-bikes would
include (a) the placemnt of the rack in a high visibility location, (b)
the ability to lock the wheels and frame to the rack, and (c) where
possible, a bike locker option to reduce the impacts of weather
and vandalism.
Insurance
Insurance coverage for e-bikes is similar to that of traditional bicycles, although, as the cost of e-bikes is
typically more than a traditional bicycle, the issue is of increasing importance. Like a traditional bicycle, e-
bikes are covered by homeowners or renter’s insurance if they are stolen or damaged when at home. They
are also covered by general liability or tenant insurance if they are stolen or damaged at work. E-bicyclists
are also covered by automobile insurance if they are involved in an accident while riding and it is nor their
fault. If an e-bike causes an accident, however, coverage is less certain. Some automobile policies may
cover this type of incident, and specialized e-bike insurance is also available. If an e-bike is stolen or
damaged while riding or parked outside the home, coverage is also less certain. This uncertainty may be
resolved eventually as the insurance industry catches up with this new trend.
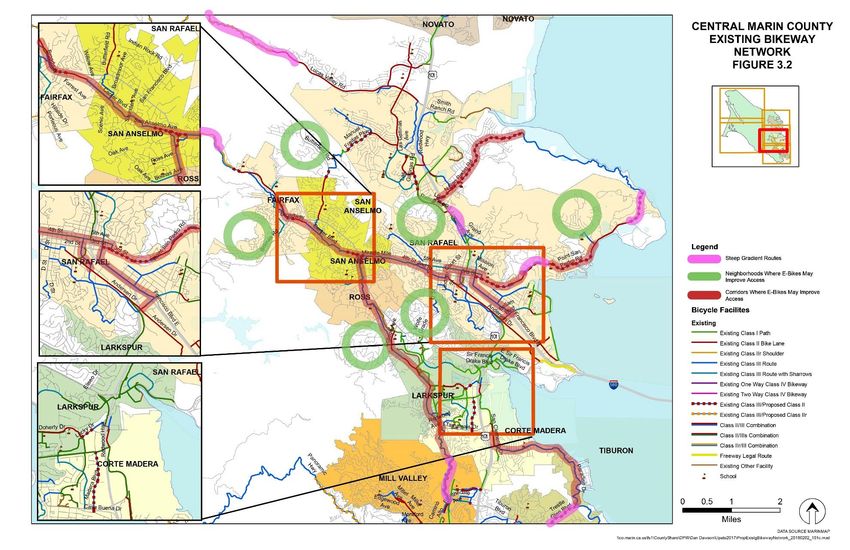
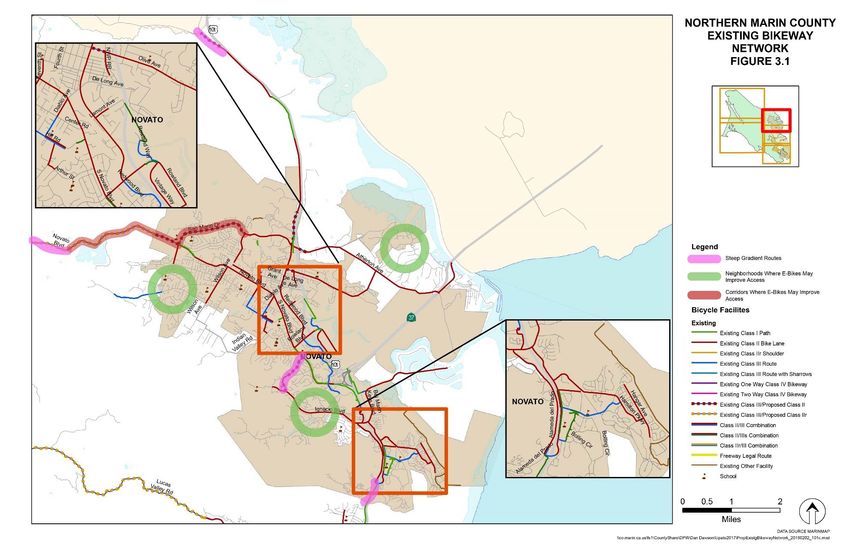
Potential E-bike Enhanced Routes in Marin County
Figures 1-5 on the following pages illustrate bikeway routes in Marin County that would likely attract
additional e-bike users. The three types of areas that would benefit from increased e-bike usage are:
(1) Pink: routes with moderate to steep gradients. E-bikes will help people overcome these areas with
minimal physical effort.
(2) Red routes: primarily existing or planned Class III bike routes where bicyclists have no bike lane and
are expected to mix with vehicle traffic. E-bikes allow cyclists to travel closer to vehicle speeds on
these routes and should see increased trips to work, school, and recreation.
(3) Green circles: these neigborhoods include numerous steep and narrow residential streets that serve
as barriers for some people to use a bicycle to reach work, shopping, or transit. E-bikes can make
these neighboirhoods more accessible to cyclists.
Some key routes to have improved access via e-bike usage include:
14 | Marin CountyElectric Bicycles Overview
(a) Novato Blvd and San Marin Drive, Novato
(b) North and South San Pedro Road, San Rafael
(c) Fourth Street, San Rafael
(d) East Francisco Blvd, San Rafael
(e) Camino Alto/Corte Madera Grade, Mill Valley-Corte Madera
(f) San Anselmo Ave, San Anselmo
(g) Paradise Drive, Corte Madera/Tiburon
(h) Magnolia Ave-College Ave, Larkspur, Kentfield
(i) Kent Ave-Shady Lane, Ross
(j) Trestle Glen Blvd, Tiburon
(k) East Strawberry Drive-Belvedere Drive, Strawberry
(l) Bridgeway-East Road, Sausalito-GGNRA
The increased use of these routes by e-bikes would help complete some of the major barriers to increased
bicycling in the County.
Some communities that would benefit from increased e-bike usage include:
(a) Sausalito
(b) Tam Valley
(c) Paradise Ave
(d) Mill Valley Hills
(e) Kent Woodlands
(f) Wolfe Grade neighborhoods
(g) Bolinas-Cascade Canyon, Fairfax
(h) Glenwood
(i) Los Ranchitos
(j) Sleepy Hollow
(k) Black Point-Green Point
(l) West Novato
Marin County | 15Electric Bicycles Overview
Figure 1: Northern Marin County
16 | Marin CountyElectric Bicycles Overview
Figure 2: Central Marin County
Marin County | 17Electric Bicycles Overview
Figure 3: Southern Marin County
18 | Marin CountyElectric Bicycles Overview
Figure 4: Western Marin County
Marin County | 19Electric Bicycles Overview
Figure 5: Southwestern Marin County
20 | Marin CountyElectric Bicycles Overview
E-Bicycle Counts
Counts of bicycles were conducted on the Mill Valley-Sausalito Bicycle Path on a weekday (Thursday, May 21,
2020) and Saturday (May 23, 2020). Table 1 below shows the total hourly volume of bicyclists during a
weekday and weekend day peak period. E-bikes and traditional bicycles were also counted. The count
shows that approximately 5% of all bicycles were e-bikes on the weekday, and 4% of all bikes were e-bikes
on a weekend day. These numbers are lower than but generally conform with the estimates of e-bike sales
as a percent of all bicycle sales in the Retailer Survey (10-15%).
Table 1: E-bike Counts on Mill Valley-Sausalito Path
Thursday, May 21, 2020, Saturday, May 23, 2020,
5-6pm Percent 12 - 1pm Percent
Traditional Bicycles: Total 217 100% 472 100%
Male Rider 149 69% 335 71%
Female Rider 68 31% 137 29%
E-Bike: Total 12 100% 20 100%
Male Rider 11 92% 10 50%
Female Rider 1 8% 10 50%
Total Male Riders 160 70% 345 70%
Total Female Riders 69 30% 147 30%
E-Bike Percent of Total 5.24% 4.07%
Total Bicycles 229 492
Table 2: Bike Counts on Mill Valley-Sausalito Path 2008, 2019, 2020
Weekday (Thursday, 5-6pm) % Change
Thursday, September 25, 2008, 5-6pm 98
Thursday, May 23, 2019, 5-6pm 55 -44%
Thursday, May 21, 2020, 5-6pm 229 316%
Weekend (Saturday, 12-1pm)
Saturday, September 27, 2008, 12 - 1pm 302
Saturday, May 25, 2019, 12 - 1pm 212 -30%
Saturday, May 23, 2020, 12 - 1pm 492 132%
Given these count and survey results, it can be estimated that e-bikes will continue to increase.
Marin County | 21Electric Bicycles Overview E-bike Trends & Opportunities Consumer Market Trends According to the Electric Bicycle Market Report: Trends, Forecast, and Competitive Analysis, the "Global Electric Bicycle Market is Expected to Reach an Estimated $21 Billion by 2024 with a cumulative annual growth rate of 12.5% from 2019 to 2024." The Global E-Bike Market is projected to grow at a CAGR (compound annual growth rate) of 9.01% during the forecast period, to reach USD 38.6 billion by 2025 from an estimated USD 21.1 billion in 2018. Class-I electric bike is estimated to be the largest segment in the global electric bikes market. A class-I electric bike is equipped with a motor that provides assistance only when the rider is pedaling and stops assisting when the bicycle reaches 20 mph. Sales of Speed Pedelecs that can go up to 45 Km/hr (28 mph) are declining "primarily because of the infrastructural issue, as they have to share roadways with cars." They are not allowed in bike lanes except with local approval. The e-bike market in North America is projected to be the fastest-growing market. It is estimated to grow at a CAGR of 19.77%, by value, during the forecast period. The demand for e-bikes has increased tremendously in Europe and North America due to increased urbanization and consumer desire to move away from cars to alternative mobility such as e-bikes. Pedal-assist dominates the market with 88.32% of all sales. As the e-bike market grows, there will be a broader range of e-bike types and styles appearing on the street. E-bikes are no longer just utilitarian machines to give a helping hand on hills or around town; there is an e-bike to suit everyone’s needs and desires. There are practical e-bikes that can carry luggage, children, pets, and many other items. There are also e- bikes, like the VanMoof or Cowboy, that stylishly integrate hardware to appeal to the more aesthetically conscious rider. There are even lightweight race machines with inconspicuous electrical assistance for the racer that might need the safety of a get out of jail free card. Consumer choice in the industry is getting better and better every month. The chart below illustrates the growth of electric bicycles in Europe between 2009-2018. 22 | Marin County
Electric Bicycles Overview

Technical Trends
Some of the key technical trends for e-bikes include:
    •    More integration of technology and accessories on bikes
    •    More niche products
    •    More high-quality options available
    •    More integration with the "internet of things"
    •    More speed bikes available
    •    More internal hubs/electronic shifting
    •    More high-quality bikes at lower prices

Bike Share Opportunities
E-Bike sharing is a new model of public and private
transportation that has rapidly emerged in recent years. It
offers a healthy, sustainable, and alternative transportation
choice, particularly for short trips. The new trend in the
cycling world is an e-bike, and this trend is now changing
the bike-sharing industry. It has multiple benefits over
traditional bicycles.

Currently, there are approximately 40,000 shared e-bikes
present globally, and approximately half of them are in
China. Electric bikes (e-bikes) can provide a higher level of
service compared to regular bike share systems. Electric           A Gotcha bike share e-bike in Richmond.
bicycles reduce the effort required by the rider, promoting

                                                                                             Marin County | 23
Electric Bicycles Overview
greater travel distances and easier use over hilly terrain. While the high price of e-bikes is a major concern
for a rider, sharing electric bikes can overcome price barriers by dividing the cost between many users.
Unlike the traditional bike-sharing system, e-bike companies have introduced dockless e-bike sharing, which
benefits both the rider and service provider. Also, many countries, such as the US, China, and Germany, are
introducing e-bikes in public bike-sharing programs. These bike-sharing programs can help tremendously in
the growth of the e-bike market.
Currently TAM and the Sonoma County Transportation Authority are coordinating to deliver an e-bike share
program with Gotcha Mobility as the selected operator in the future serving SMART stations and offering an
important end-of-trip connection for the public.
Infrastructure Opportunities
Like any mode of transportation, e-bikes have specific infrastructure requirements that both foster new users
and trips and improves the experience of riders. While many infrastructure components are shared between
traditional and electric bikes (parking, on- and off-road facilities, end-of-trip facilities, etc.), there are some
unique needs for e-bikes.
• Wider paths/lanes: Wider dedicated paths and lanes allow for room to pass, which is especially
important in mixed-modal paths or high-density areas with higher volumes of bicycle trips.
• Universal chargers: Similar to the increasing presence of electric vehicle charging areas in both public
and commercial locations, universal e-bike chargers can extend the range of e-bikes and allow more
trips (and trip-chaining) to be completed; increasing the effectiveness and practical-ness of e-bikes
as an everyday mode of transportation.
E-bike Incentive Programs
Incentive Opportunities
Why incentivize?
Despite the trend lines showing future growth in the United States and high usage levels in Europe and Asia,
E-bikes remain a small share of bicycling. Barriers to growth have been documented in this report and
include the higher cost of e-bikes, lack of secure bike parking, limitations on range for the upper end of trip
lengths and durations, and concerns about safety on busy roadways.
E-bikes have demonstrated their ability to extend the range of trips on bicycles by 80% over traditional
bicycles, potentially diverting trips that would be made in vehicles. E-bikes have the clear potential to
change the dynamics of travel within communities, and even between communities. The main barrier to E-
bikes in the United States remains the high cost compared to traditional bicycles, though the price
differential is expected to be reduced as the technology matures. Incentive programs coupled with effective
outreach and promotion both by the industry itself, bicycle advocacy groups, public agencies, and employers
is a potential pathway to overcoming the cost barrier.
24 | Marin CountyElectric Bicycles Overview
Types of Incentives
One of the most effective ways to lower the cost barrier is through a subsidy program. Traditional bicycles
have been subsidized in the form of publicly-funded bike share programs, bike loaner programs, and on
some corporate campuses and military bases, free fleets of bicycles. E-bike subsidies would be a reasonable
extension of these types of programs.
According to John MacArthur of the Transportation Research and Education Center (TREC) at Portland State
University, “There are five different types of such programs:
1. Partial purchase subsidy from government or utilities
2. Vendor funded discount (a discount from the e-bike store or manufacturer)
3. Employer sponsor programs (where the employer provides an e-bike, perhaps as part of their
compensation packages or as a component of a larger TDM program)
4. Government-sponsored loans
5. Public promotions/outreach
Government and Utility
Locally, Marin and Sonoma Counties have joined forces to fund and manage an e-bike share system, to be
operated by Gotcha and based at select SMART stations. This investment represents a direct subsidy of e-
bikes which will help extend the range of SMART and local bus transit, and open up access on routes with
topography and lack of bike lanes as described earlier.
Public utility companies and agencies in California, New York State, Austin, Texas, Vermont, and Utah have
taken steps towards E-bike incentives and research. BAAQMD currently provides ebike rebates in its clean
cars for all program eligible for income restricted households in the bay area. In Marin County, electric
vehicle rebate programs offered by agencies such as TAM support ebikes through through rebates up to
$1,000 to public agencies. Local agencies could invest in a fleet of E-bikes for employees to borrow as part
of their commute trips. Local agencies could provide incentives or requirements for employers over a
specific size to include E-bikes as part of the TDM programs.
The California Bicycle Coalition is asking the California Air Resources Board to expand its incentive programs
to include the cleanest vehicle of all: the bicycle. The ARB funds the Clean Vehicle Rebate Program and similar
state programs to help people replace high-polluting cars with electric cars to reduce greenhouse gas
emissions. Still, they don’t have any programs to encourage bicycle riding. CalBike proposes to change that
with a $10 million Bicycle Purchase Incentive Pilot Program. The program will provide incentives in the form
of vouchers for half of the cost of bikes that are commonly used for transportation, up to a maximum value
of $500, or $1000 for electric bicycles. Bike share programs and bicycle repair services may also be
supported, in addition to vouchers to incentivize the purchase of cargo bikes, electric bikes, folding bikes,
and other utilitarian bicycles used for everyday transportation. No funding would be taken from existing
bicycle-related sources.
Marin County | 25Electric Bicycles Overview In another example, the TREC white paper showed, “In 2017, BikeSGV was awarded $70,000 in a competitive grant process through the City of El Monte, CA, to begin an e-bike subsidy program. The funding for the program came from the revenue of newly added toll lanes on I-10. This toll revenue was required by law to be reinvested along the I-10 corridor, of which 40% was earmarked for active transportation initiatives such as the grant received by BikeSGV. Through this grant, BikeSGV funded 100 e-bike incentives of $700 each. To be eligible, applicants were required to take a bike safety course and live within three miles of I-10.” A government loan program to purchase e-bikes could help overcome the barrier of cost, where the bicycle is either financed over time in a revolving loan program or the bicycles can be rented to the public at lower costs. This may be an effective way to get people to try an e-bike. Market Forces As with any newer technology, the initial marketing of e-bikes can be difficult because of a lack of resources and a wide variety of manufacturers. The biggest challenge in e-bike marketing is simply to get a person to try them. Riding an e-bike itself is the best form of marketing. Most people are probably not aware of a bicycle on the road in front of them is an e-bike. Where people have an interest in health and the environment, e-bikes are a natural fit for many local trips. The cost of E-bikes may be lowered through natural competition and increased scale of sales by vendors and manufacturers, who could also increase the promotion of their equipment in various media. These entities could also expand their programs to let people ‘test drive’ an e-bike for at least 24 hours, if not longer. Bike shops may also develop e-bike rental fleets that allow people to try out the bike on their regular local trips. Employer Subsidies Employers could underwrite some or all of the cost of E-bikes for employees, or, provide a fleet of E-bikes to be used for commute purposes by staff. Employers already offer subsidies to transit use and other programs to reduce SOV trips. Incentive Case Studies Implementing many of the changes above will indirectly promote the use of electric bikes. However, if TAM or local municipalities or agencies have a desire to promote e-bikes directly, there are many methods available for them to do so. Case Study: Contra Costa County Transportation Authority (2020) Residents of Contra Costa County can now receive cash rebates for new electric bicycles (e-bikes) through a pilot program launched by 511 Contra Costa (511CC). A limited number of $150 rebates ($300 for low income residents) are available for residents of each Contra Costa city to assist in the purchase of e-bikes, e-bike conversion kits, and electric mopeds (with a maximum 26 | Marin County
Electric Bicycles Overview

speed less than 30 mph). E-bikes are clean fuel vehicles that provide riders with an excellent alternative to
driving when traveling short to medium distances on local streets.

“We’re proud to partner with 511 Contra Costa on this effort", states Contra Costa Transportation Authority
Executive Director Randell Iwasaki. “E-bikes offer several key benefits as an alternative to driving - they
reduce congestion, reduce greenhouse gas emissions, eliminate parking dilemmas, and can help bridge
those first and last mile trips to transit – plus they are just really cool.”

Post purchase rebates are available for county residents who purchase e-bikes on or after October 1, 2020,
and will be distributed on a first come, first served basis.

“One of our goals is to introduce Contra Costa residents to this energy efficient mode of transportation by
helping to reduce costs and raising awareness about the benefits of e-bikes in their communities,”
said Kirsten Riker, Project Manager, 511CC.

The Contra Costa Transportation Authority's local Measure J sales tax is the funding source for this program
and others like it to encourage alternatives to the single occupant vehicle. To learn more,
visit 511CC.org/rebate for information about rules, resources, and current rebate availability by city.

Case Study: MyGo-Pasadena (2007)
In 2007, the City of Pasadena and CALSTART partnered to create the “MyGo-Pasadena” program. This program
offered financial incentives for those who rode their electric bike to local light rail stations. How many times a
week, participants biked to a rail station (2, 3, or 4 times a week) determined what the financial reward was.
That incentive would go towards the purchase of a transit pass or fare. The table below breaks down to
incentive structure.

Funding for this program came from the Los Angeles County Metropolitan Transportation Authority (Metro),
the City of Pasadena, Pasadena Water, and Power, and the Federal Transit Administration.
Several studies and focus groups were done as a part of this program, and the results provide key insights
into the mindset and opinions of program participants. Before the creation of the My-Go Pasadena program,
                                                                                                 Marin County | 27
Electric Bicycles Overview
a survey was conducted on the Metro Gold Line (at the time which ran from Sierra Madre Villa to Union
Station. The survey found the following were perceived barriers to people using e-bikes:
In a follow-up focus group of a select group of riders, the following positives about such a program were
found:
• Reduction of traffic congestion
• Saving money
• Helping the environment
• Health benefits
• Splitting lanes
• Increased sociality
The following concerns were found:
• Safety
• Lack of familiarity (many had not ridden a bike in decades)
• Cosmetic issues (sweat, helmet hair, etc.)
• Theft & security
• Parking & storage Lack of available bike facilities/routes
• Lack of dual-passenger or storage capability (children, groceries, other items)
Nighttime riding (safety and visibility)
• Cost
• Weather (both rain and when it’s too hot) the need for a special license
• Maintenance issue/locations
28 | Marin CountyElectric Bicycles Overview
With the 41 program participants, two surveys were conducted, and the following results were found:
• Only 42% of participants were using the Gold Line before the program (survey 1)
• 88% used their bikes outside of their regular commute (survey 1) and 81% planned to continue using
their e-bikes as a part of their commute after the program had ended (survey 2)
• On average the bike-transit combination added 10-15 minutes per trip to individuals commute time
(survey 1)
• 46% of participants had never ridden a bicycle before joining the program. 73% now said that they
now ride “far more often” since joining the program (survey 2)
Case Study: Santa Cruz County Electric Bike Commuter Incentive
Program
Santa Cruz’s Electric Bike Commuter Incentive Program ran from
2000 to 2007 and had over 1,000 participants. This program was
funded by the Monterey Bay Unified Air Pollution Control
District, Santa Cruz County Department of Public Works, and
Ecology Action of Santa Cruz (lead). This program provided a
subsidy for electric bikes between $145-$300. To gain the
subsidy, all participants had to do was attend a safety training
course (and be at least 16) and purchase the bikes from one of UC Santa Cruz bike paths – Jim
two local vendors (prices and terms were pre-negotiated). MacKenzie
• Sal Saladin, a "fifty-something" UC Santa Cruz employee who journeys over the hills of campus on
his electric bike, agrees. "[The program] keeps me on the bike," said Saladin, a West Side resident.
"I'm not sure if I'd be riding a regular bike if it wasn't for the electric motor. I arrive at work warmed
up, yet I don't need to change and shower.
• A 2006 survey of 879 of the 1,211 participants (at the time) found that 62% of participants had
switched from driving exclusively in a single-occupancy vehicle to riding an e-bike for an average of
24-28 miles per week.
Potential Local Agency Implementation
Type: Subsidy Program
Implementation: Private companies, local agencies, state or federal tax incentives
Cost: Ranges from $0 (private implementation) to $2,000-$4,000/e-bike
Impact: Could have a beneficial impact in increasing e-bike usage for transportation trips,
reducing local traffic congestion.
Marin County | 29Electric Bicycles Overview
Infrastructure Opportunities
Additional Network Planning Work
While cost has been identified as perhaps the most significant barrier to riding an e-bike, concerns about
riding on busy roadways with little or no separation from vehicular traffic may be a major factor as well.
Marin County local agencies have done an excellent job of developing a bikeway network through the
completion of bicycle master plans and investments in bike lanes and multiuse pathways. Yet some major
corridors have sections where bicyclists must ride in travel lanes shared by vehicles moving 35 mph or faster
or narrow winding two-lane roadways with limited or no shoulders. Some intersections remain challenging
for bicyclists. The quality of any transportation facility is measured by conditions at its most challenging
location. A high-quality corridor with bike lanes that ends in a narrow, high-traffic segment with no bike
lanes will discourage many bicyclists from using the route again. These challenging locations are often the
last to be improved because they are the most constrained and costly to fix.
In addition to increasing physical separation between bicycles and motor vehicles, providing wider bicycle
facilities increased the use and more comfortable use of bicycle facilities. Wider facilities allow faster bicycles
to more easily pass slower bikes, scooters, or other lane users. Wider lanes can also facilitate side-by-side
riding, which can be a more comfortable experience for some riders.
Some of the challenging segments in Marin County are shown in Figures 1-5, including those routes which
e-bikes offer the greatest potential to overcome, including routes with steep terrain.
Potential Local Agency Implementation
Type: Bicycle planning including e-bikes
Implementation: TAM, local agencies
Cost: Plan updates range from $10,000 - $50,000 per jurisdiction
Impact: Would ensure that updated plans and policies reflect the unique characteristics of e-
bikes.
Shared E-bike Systems beyond Bike Share
Two of the greatest constraints to using bike share, especially in lower density communities such as Marin
County, is the fact that many bicycle trips can end in less-traveled places like office complexes where the
next rider might not appear for hours, and the concern that a bike might not be available nearby when
you’re ready to return home. One way to eliminate this issue is to offer the ability to pay for the exclusive
use of a bicycle for any selected period (an hour, day, month) and have that e-bike available exactly when
you need it and where you left it. While this might partially defeat the purpose of the ‘share’ in bike share, it
might be of interest in a place like Marin County where there is still demand for bike share; the model just
has to fit the level of demand. This hybrid ‘rent/share’ approach would greatly lower the entry cost to an e-
bike, match the travel patterns of those desiring to share a bike versus those who want the assurance an e-
bike is waiting for them, while also giving people a feeling of ownership and exclusive use of an e-bike. This
30 | Marin CountyYou can also read