Electric Service Reliability Report 2013 - Washington Utilities ...
←
→
Page content transcription
If your browser does not render page correctly, please read the page content below

2013
Electric Service Reliability Report
2014 Avista Corporation. All Right Reserved
Permission of the Copyright owner is granted to users to copy, download, reproduce, transmit or
distribute any part of this document provided that: (1) the user includes Avista’s copyright notice on all
copies, and (2) the materials are not used in any misleading or inappropriate manner. Furthermore, no
portion of the attached work shall be republished in printed or digital form without the written permission
of the Copyright owner.
TABLE OF CONTENTS

INTRODUCTION ......................................................................................................................... 1

DEFINITIONS .............................................................................................................................. 2

DATA COLLECTION AND CALCULATION CHANGES ............................................................ 3
    Data Collection ...................................................................................................................................................................... 3
    Interruption Cause Codes ....................................................................................................................................................... 3
    Customers Experiencing Multiple Interruptions .................................................................................................................... 4
    Major Events .......................................................................................................................................................................... 4
    Table 1.1 – 2013 Major Event Days ...................................................................................................................................... 5
    Customer Complaints ............................................................................................................................................................. 5

SYSTEM INDICES ...................................................................................................................... 6
    Table 2.1 - Reliability Statistic Target by Index .................................................................................................................... 6
    Chart 2.1 – SAIFI - Sustained Interruptions / Customer ........................................................................................................ 7
    Chart 2.2 – Sustained Interruptions / Customer Historic Comparison ................................................................................... 7
    Chart 2.3 - SAIFI Linear Trend Line Chart............................................................................................................................ 8
    Chart 2.4 - MAIFI Momentary Interruption Events / Customer ............................................................................................ 9
    Chart 2.5 – Momentary Interruptions/ Customer Historic Comparison ................................................................................. 9
    Chart 2.6 - SAIDI – Average Outage Time / Customer ....................................................................................................... 10
    Chart 2.7 - SAIDI Linear Trend Line Chart ......................................................................................................................... 11
    Chart 2.8 - CAIDI – Average Restoration Time .................................................................................................................. 11

OFFICE INDICES ...................................................................................................................... 12
    Chart 3.1 – SAIFI - Sustained Interruptions / Customer ...................................................................................................... 12
    Chart 3.2 - MAIFI Momentary Interruption Events / Customer .......................................................................................... 12
    Chart 3.3 - SAIDI – Average Outage Time / Customer ....................................................................................................... 13
    Chart 3.4 - CAIDI – Average Restoration Time .................................................................................................................. 13

AREAS OF CONCERN ............................................................................................................. 14
    Cause Information ................................................................................................................................................................ 14
    Colville Area Work Plans .................................................................................................................................................... 17
    Table 4.1 - Colville Area Major Reliability Projects by Feeder........................................................................................... 18
    Table 4.2 - Colville Area Historical & Proposed Future Reliability Projects by Feeder ..................................................... 18
    Avista System Wide Work Plans ......................................................................................................................................... 19
    Chart 4.1 – Squirrel Related Events ..................................................................................................................................... 19
    Chart 4.2 – Wood Pole Management Related Events .......................................................................................................... 20
    Chart 4.3 – Wood Pole Management Actions ...................................................................................................................... 20
    Avista Grid Modernization Program .................................................................................................................................... 21
    Avista System Wide Vegetation Management Plan ............................................................................................................. 21

CUSTOMERS EXPERIENCING MULTIPLE INTERRUPTIONS ............................................... 22
    Chart 5.1 - Avista Service Territory - CEMIn ...................................................................................................................... 22
    Chart 5.2 - Colville Office - CEMIn ..................................................................................................................................... 23
    Chart 5.3 - Davenport Office - CEMIn ................................................................................................................................. 24
    Chart 5.4 - Deer Park Office - CEMIn .................................................................................................................................. 25
    Chart 5.5 - Othello Office - CEMIn ...................................................................................................................................... 26
    Chart 5.6 - Palouse Office - CEMIn ..................................................................................................................................... 27
    Chart 5.7 - Lewis-Clark Office - CEMIn .............................................................................................................................. 28
    Chart 5.8 - Spokane Office - CEMIn .................................................................................................................................... 29
    Chart 5.9 - Sandpoint Office - CEMIn.................................................................................................................................. 30
Chart 5.10 - Kellogg Office - CEMIn ................................................................................................................................... 31
    Chart 5.11 - Coeur d’Alene - CEMIn ................................................................................................................................... 32
    Chart 5.12 - Grangeville Office - CEMIn ............................................................................................................................. 33

MONTHLY INDICES ................................................................................................................. 34
    Chart 6.1 – SAIFI - Sustained Interruptions / Customer ...................................................................................................... 34
    Chart 6.2 - MAIFI Momentary Interruption Events / Customer .......................................................................................... 34
    Chart 6.3 - SAIDI – Average Outage Time / Customer ....................................................................................................... 35
    Chart 6.4 - CAIDI – Average Restoration Time .................................................................................................................. 35

CUSTOMER COMPLAINTS ..................................................................................................... 36
    Table 7.1 - Commission Complaints .................................................................................................................................... 36
    Table 7.2 - Customer Complaints ........................................................................................................................................ 36

SUSTAINED INTERRUPTION CAUSES .................................................................................. 39
    Table 8.1 - % SAIFI per Cause by Office ............................................................................................................................ 39
    Chart 8.1 – % SAIFI per Cause by Office............................................................................................................................ 40
    Table 8.2 - % SAIDI per Cause by Office ........................................................................................................................... 41
    Chart 8.2 – % SAIDI per Cause by Office ........................................................................................................................... 42
    Table 8.3 - % SAIFI per Cause by Month............................................................................................................................ 43
    Chart 8.3 – % SAIFI per Cause by Month ........................................................................................................................... 44
    Table 8.4 - % SAIDI per Cause by Month ........................................................................................................................... 45
    Table 8.4.1 – Average Outage Time (HH:MM) ................................................................................................................... 46
    Chart 8.4 – % SAIDI per Cause by Month .......................................................................................................................... 47

MOMENTARY INTERRUPTION CAUSES ............................................................................... 48
    Table 9.1 - % MAIFI per Cause by Office ........................................................................................................................... 48
    Table 9.1.1 - % MAIFI per Cause by Office (Washington only) ......................................................................................... 49
    Chart 9.1 – % MAIFI per Cause by Office .......................................................................................................................... 50
    Table 9.2 - % MAIFI per Cause by Month .......................................................................................................................... 51
    Chart 9.2 – % MAIFI per Cause by Month .......................................................................................................................... 52

MAJOR EVENT DAY CAUSES ................................................................................................ 53
    Chart 10.1 – % SAIFI by Cause Code for the Major Event Days ........................................................................................ 53
    Table 10.1 – % SAIFI by Sub Cause Code for the Major Event Days ................................................................................ 54
    Table 10.2 – Yearly Summary of the Major Event Days ..................................................................................................... 54

INTERRUPTION CAUSE CODES............................................................................................. 56
    Table 11.1 – Interruption Cause Codes ................................................................................................................................ 56

OFFICE AREAS ........................................................................................................................ 58
    Chart 12.1 – Office Areas .................................................................................................................................................... 58

INDEX CALCULATIONS .......................................................................................................... 59
    Sustained Interruption .......................................................................................................................................................... 59
    Momentary Interruption Event ............................................................................................................................................. 59
    SAIFI – System Average Interruption Frequency Index ...................................................................................................... 59
    MAIFIE – Momentary Average Interruption Event Frequency Index .................................................................................. 59
    SAIDI – System Average Interruption Duration Index ........................................................................................................ 59
    CAIDI – Customer Average Interruption Duration Index ................................................................................................... 60
    CEMIn – Customers Experiencing Multiple Sustained Interruptions more than n............................................................... 60
    CEMSMIn – Customers experiencing multiple sustained interruption and momentary interruption events. ....................... 60
    MED - Major Event Day ...................................................................................................................................................... 61
NUMBERS OF CUSTOMERS SERVED ................................................................................... 62
    Table 13.1 – Numbers of Customers Served ........................................................................................................................ 62

ATTACHMENT 1 – SAIDI AND SAIFI HISTORICAL SUMMARY ............................................ 62

COMPANY CONTACT .............................................................................................................. 62
Introduction

Pursuant to WAC 480-100-398, Avista Corporation dba Avista Utilities (“Avista” or “the Company”)
submits its annual Electric Service Reliability Report. The report describes the Company’s reliability
monitoring and reliability metrics for 2013. All numbers included in this report are based on system-data.
The Company’s system includes 11 geographical divisions with two of those divisions overlapping the
Washington and Idaho border leading to a commingling of jurisdictional customers. A map of Avista’s
operating area is included on page 58 of this report.

WAC 480-100-393 (3)(b) requires the establishment of baseline reliability statistics. The Company’s
baseline statistics are included in this report and compare the current year data to the baseline year of
2005 and years in between. The Company also provides a statistical target that represents an analysis
based on an average over a time period and adding two standard deviations. Year to year variations should
be below this target, but may provide information that shows continuing trends.

Avista has reported in its previous annual reports that the completion of the transition to the Outage
Management Tool (OMT) system had caused an increase in the variability of the data collected from 2001
to 2007. The 2009 Annual Report (UE-100659) indicated that a gradual increase in the SAIFI and SAIDI
numbers that cannot be attributed to the transition to the OMT system was occurring. Through 2012, the
trend lines for SAIFI and SAIDI were both showing an upward trend. The trend line for SAIFI now shows
a slightly downward trend with the inclusion of the 2013 data. The trend line for SAIDI is now showing a
very slight upward trend with the inclusion of the 2013 data but has flattened from prior years. The charts
on pages 8 and 11 show a trend line for SAIFI and SAIDI historical data.

Continued scrutiny will be important over the next year or two to determine if the rate of increase for
SAIFI/SAIDI continues to slow due to the reliability improvement programs implemented from 2010 to
2013.

The 2013 SAIFI and SAIDI reliability indices are slightly higher than the 2005 baseline, which may be
due to the under reporting that may have occurred during the transition to OMT in 2005. The 2013 CAIDI
index is higher than the 2005 baseline and may be attributable to the nature of the outages seen over the
year, namely the higher than average amount of planned interruptions. On another note, the 2013 MAIFI
reliability index is below the 2005 baseline.

Avista added a new section beginning in the 2007 annual report (UE-080787) which analyzes the areas
where customers are experiencing multiple sustained outages. This section provides analysis of a
reliability index called CEMIn, which implies Customers Experiencing Multiple sustained Interruptions
more than n times.

Avista continues to review its annual baseline reliability statistics in light of operational experience under
current regulatory protocol. Avista may modify its baseline statistics as appropriate and will update the
Commission accordingly.

Avista Utilities                                                                                             1
2013 Service and Reliability Report
Definitions

“Reliability Statistic” – Standard Statistics measures and calculation methods are per the IEEE Standard
1366-2003 (or latest version) Titled “IEEE Guide for Electric Power Distribution Reliability Indices”.
Same as Reliability Indices.

"Major event" – Modified this definition to the IEEE Standard 1366-2012 (or latest version) of Major
Event Day (MED), which uses a process “Beta Method” to identify a Major Event Day. The previous
definition was “An event that impacts more than 5% of the Company’s customers and causes outages of
more than 24 hours in duration in any given division within its territory”.

“Sustained Interruption” - An interruption lasting longer than 5 minutes.

“Momentary Event Interruption” – An interruption(s) of duration 5 minutes or less. Each event consists
of one trip and one reclose operation that occur within 5 minutes. For example, if an interrupting device
operates three times and then holds, this would be counted as three events with the number of customers
affected as three times the Ni.

"Baseline reliability statistic" – Avista will compare its reliability statistics to the year 2005.

“Reliability Target” - A statistical method was developed in 2004 for baseline statistics. The method is
defined as the average over a specific timeframe and 2 times the standard deviation. For 95% of the time,
the Reliability Statistic should be below the target.

“Customer Complaint” - When a customer is not satisfied with the Company as it relates to Electric
Reliability and makes a complaint directly to a Company representative.

“Commission Complaint” – When a customer is not satisfied with the Company as it relates to Electric
Reliability and files a complaint directly with the Commission.

Avista Utilities                                                                                            2
2013 Service and Reliability Report
Data Collection and Calculation Changes

WAC 480-100-398 (2) requires the Company to report changes made in data collection or calculation of
reliability information after initial baselines are set. This section addresses changes that the Company has
made to data collection.

Data Collection
      Since Avista’s Electric Service Reliability Monitoring and Reporting Plan was filed in 2001 (UE-
      011428), there have been several improvements in the methods used to collect outage data. In late
      2001, centralizing the distribution trouble dispatch and data collection function for Avista’s entire
      service territory began. The distribution dispatch office is located in the Spokane main complex.
      At the end of September 2005, 100% of the Company’s feeders, accounting for 100% of the
      customers, are served from offices that employ central dispatching.

The data collected for 2013 represents the seventh full year of outage data collected through the Outage
Management Tool (OMT). For 2013, all data was collected using the “Outage Management Tool” (OMT)
based on the Company’s Geographic Information System (GIS). The OMT system automates the logging
of restoration times and customer counts.

Avista discovered a software coding error that has been within the OMT system since 2002 that caused a
small increase in the SAIDI and CAIDI for 2008. Previous years were also evaluated to determine the
overall impact to the Avista baseline statistics and at this time Avista is not proposing a change to the
baseline numbers. The software error only occurred during very specific outage conditions when a group
of customers with an initial outage starting time were “rolled” up into another group of customers that
were determined to be part of the first group outage. The second group may have had a later outage
starting time. When the first group of customer outage information was rolled up, the original outage
starting time was lost and the second group outage starting time was used for both groups of customers
instead of using the first outage starting time. The number of customers was counted correctly.

Even as good as the OMT system is at quantifying the number of customers and duration of the outage
duration, there still are areas where the data collection is not precise. Determining the exact starting time
of an outage is dependent on when a customer calls in, how well the Avista Distribution Dispatcher
determines where the outage is and defines the device that has opened to remove the faulted section.

As AMR/AMI metering is implemented in the future and the customer meter provides outage information
to the OMT system through an interface, the SAIDI and CAIDI numbers are expected to increase. This is
similar to the above discussion.

Use of the OMT system and GIS data has improved the tracking of the numbers of customers without
power, allowed for better prioritization of the restoration of service, and the improved dispatching of
crews.

Interruption Cause Codes
Cause code information is provided in this report to give readers a better understanding of outage sources.
Further, the Company uses cause information to analyze past outages and, if possible, reduce the
frequency and duration of future outages.
Avista Utilities                                                                                                3
2013 Service and Reliability Report
Since 2011, Avista has stopped using the subcategory “protected” under the “Animal” category. Almost
all birds are considered protected, so there is little differentiation between the “Bird” and “Protected”
subcategories. Avista will include additional information in the Remarks section as reported from the field
personnel.

Customers Experiencing Multiple Interruptions

The IEEE Standard 1366P-2003 provides for two methods to analyze data associated with customers
experiencing multiple momentary interruptions and/or sustained interruptions. Avista’s Outage
Management Tool (OMT) and Geographical Information System (GIS) provide the ability to geospatially
associate an outage to individual customer service points. This association allows for graphically showing
Customers Experiencing Multiple sustained Interruptions (CEMIn) with Major Event Day data included
onto GIS produced areas. Data can be exported to MS Excel to also create graphs representing different
values of n. 2013 information is provided in the Customer Experiencing Multiple Interruptions (page 22)
to summarize the analysis Avista performed on the 2013 outage data. The calculation for CEMIn and
Customers Experiencing Multiple Sustained and Momentary Interruptions CEMSMIn is provided in the
Index Calculations section (page 60).

Major Events

Major Events and Major Event Days as used in this report are defined per the IEEE Guide for Electric
Power Distribution Reliability Indices, IEEE P1366-2012. The following definitions are taken from this
IEEE Guide.

        Major Event – Designates an event that exceeds reasonable design and or operation
        limits of the electric power system. A Major Event includes at least one Major Event
        Day (MED).

        Major Event Day – A day in which the daily system SAIDI exceeds a threshold
        value, TMED. For the purposes of calculating daily system SAIDI, any interruption
        that spans multiple calendar days is accrued to the day on which the interruption
        began. Statistically, days having a daily system SAIDI greater than TMED are days on
        which the energy delivery system experienced stresses beyond that normally
        expected (such as severe weather). Activities that occur on major event days should
        be separately analyzed and reported.

The Company will use the process defined in IEEE P1366 to calculate the threshold value of TMED and to
determine MED’s. All indices will be reported both including and excluding MED’s. The comparisons of
service reliability to the baseline statistics in subsequent years will be made using the indices calculated
without MED’s.

Avista Utilities                                                                                           4
2013 Service and Reliability Report
Table 1.1 – 2013 Major Event Days

                                          SAIDI
              Major Event Days           (Customer-                  Cause
                                          Minutes)
            2013 Major Event Day           8.96
            Threshold
            August 25, 2013                24.97                 Wind/Lightning
            August 26, 2013                11.78                 Wind/Lightning
            September 15, 2013             14.01                     Wind
            November 16, 2013              11.09                   Wind/Ice

Additional analysis of the 2013 Major Event Days is provided in this Annual Report as was done in
previous years in the Major Event Day Causes section on page 53.

Customer Complaints

The Company tracks reliability complaints in two areas, Commission Complaints and Customer
Complaints, which are defined in the Definitions section. See the Customer Complaints section on Page
36 for a summary of results for this year.

Avista Utilities                                                                                        5
2013 Service and Reliability Report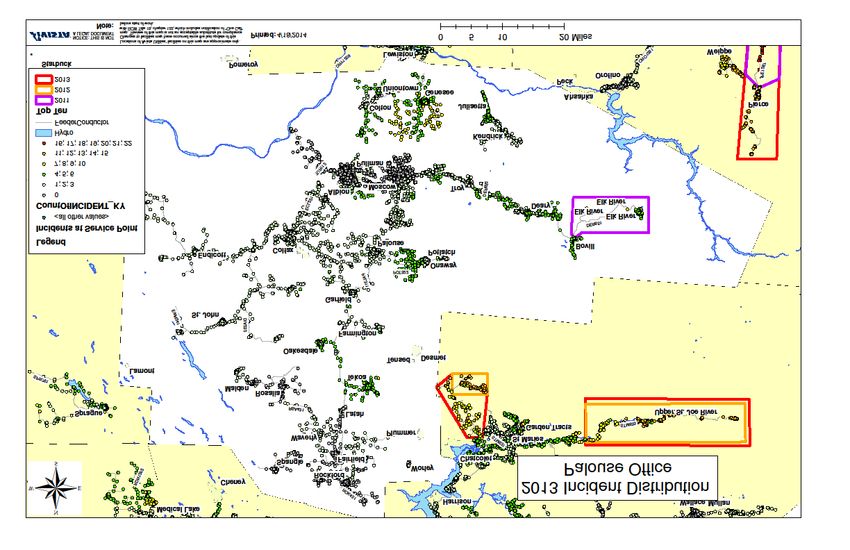
System Indices

The charts below show indices for Avista’s Washington and Idaho (“system”) electric service territory by
year. Breakdown by division is included later in this report. Each chart shows seven years of data along
with the baseline reliability statistic which is highlighted in green. The Company also has calculated a
reliability target that is the average over the previous five years plus two standard deviations. This target
is shown in yellow on the reliability index charts.

The reliability targets have been adjusted by removing Major Event Days, MED’s, as defined in the
previous section.

Table 2.1 - Reliability Statistic Target by Index

                                 2007-2013                   2005                       Reliability
        Index                     Average                   Baseline                     Target
                              (Excluding Major Events)                             (Ave + 2 Standard Deviations)

         SAIFI                        1.25                     0.97                           1.60

         MAIFI                        3.44                     3.58                           5.18

         SAIDI                         148                     108                            200

         CAIDI                         121                     112                            130

Additional comparisons of the Reliability Indices are provided in the Office Indices section (page 12) and
Monthly Indices section (page 34) of this report.

The Company continues to use the definition of major events as described above to be consistent with
IEEE Standards. Therefore, the following charts show statistics including the effect of major events per
this definition. Both the Baseline Statistic is shown for the year 2005 (green bar), along with the Avista
Target Statistic which is shown as the yellow bar.

Refer to Attachment 1 – SAIDI and SAIFI Historical Summary for additional historical information.

Avista Utilities                                                                                                   6
2013 Service and Reliability Report
Chart 2.1 – SAIFI - Sustained Interruptions / Customer
SAIFI Excluding Major Events
Major Events
Baseline Year 2005
2.0
Sustained Interuptions / Customers
1.8
1.6
1.4
1.2
1.0
0.8 1.52 1.60
1.29 1.40
0.6 1.14 1.23 1.14
0.97 1.08 1.05
0.4
0.2
0.0
2005 2006 2007 2008 2009 2010 2011 2012 2013 Target
Chart 2.2 – Sustained Interruptions / Customer Historic Comparison
Sustained Outage 2013 vs 2007-2012 Average
15000
10000
5000
# Customers Affected
0
-5000
-10000
-15000
-20000
-25000
-30000
Avista Utilities 7
2013 Service and Reliability ReportSAIFI for 2013 was slightly over the 2005 baseline statistic but represents a decreasing trend. The 2013
SAIFI number is lower than 2012 and similar to 2011 and may represent gains due to Company
expenditures specifically targeting reliability. Using a simple linear regression to establish a trend line, it
would look like about a -0.007% growth in the number of customers affected. The R2 coefficient of
determination shows a slightly stronger correlation to the data than in 2012. A chart of this analysis has
been provided just after this discussion.
There were 77,001 customers affected by sustained outages caused by weather in 2013. This compares to
the 2007–2012 average of 95,165 customers and the 2012 level of 103,066 customers.
Planned outages numbered 55,035 customers for 2013 as compared to the previous 5-year average of
42,293 customers and also represents as the highest annual total to date.
Public outages affected 50,938 customers as compared to the 2007-2012 average of 39,947 customers.
Outages associated with Tree causes affected 30,417 customers as compared to the 2007-2012 average of
53,977.
Undetermined cause outages affected 39,447 customers as compared with the 2007-2012 average of
64,435.
Chart 2.3 - SAIFI Linear Trend Line Chart
Linear Trend for SAIFI without MED's Series1
1.60
1.40 y = -0.007x + 1.2372
R² = 0.0118
1.20
1.00
0.80
0.60
0.40
0.20
0.00
2005 2006 2007 2008 2009 2010 2011 2012 2013
Avista Utilities 8
2013 Service and Reliability ReportChart 2.4 - MAIFI Momentary Interruption Events / Customer
MAIFI Excluding Major Events
Major Events
Baseline Year 2005
6.0
Momentary Interuptions / Customer
5.0
4.0
3.0
5.18
4.59
2.0 4.22 4.22 4.23
3.58
2.93 2.63
2.42 2.14
1.0
0.0
Chart 2.5 – Momentary Interruptions/ Customer Historic Comparison
Momentary Outage 2013 vs 2007-2012 Average
0
-50000
# Customers Affected
-100000
-150000
-200000
-250000
-300000
Avista Utilities 9
2013 Service and Reliability ReportThe 2013 results for MAIFI show the lowest level we have seen, continuing the downward trend we have
seen over the past few years. There was a decrease for 2013 in every category, including a significant
reduction in the number of undetermined cause interruptions. This shift may be due to accuracy
improvement efforts in Distribution Dispatch. The overall improvements in the MAIFI numbers may be
due to tree trimming efforts along with Overhead Equipment replacement and Underground Equipment
replacement. Some of the Urban areas have had the instantaneous trip function blocked, which reduces
the total feeder customer momentary impacts, but may increase both SAIFI and SAIDI numbers for a few
customers located downstream of a fused lateral.
Distribution Dispatch continues to make improvements in correlating the momentary outages with
subsequent sustained outages, which reduces the undetermined causes.
Chart 2.6 - SAIDI – Average Outage Time / Customer
Excluding Major Events
SAIDI Major Events Baseline Year 2005
400
Sustained Interuption Duratrion / Customer
360
320
280
240
(Customer-min)
200
160
120
193 200
80 143 132
159 146 138 138
108 118
40
0
Avista Utilities 10
2013 Service and Reliability ReportChart 2.7 - SAIDI Linear Trend Line Chart
Linear Trend for SAIDI without MEDs Series1
Linear (Series1)
250
200 y = 1.0667x + 136.33
R² = 0.0143
150
100
50
0
2005 2006 2007 2008 2009 2010 2011 2012 2013
Chart 2.8 - CAIDI – Average Restoration Time
Excluding Major Events
CAIDI Major Events
Baseline Year 2005
200
Ave. Restoration Time / Customer (min)
160
120
80
127 132 130
112 111 116 113 118 121
108
40
0
2005 2006 2007 2008 2009 2010 2011 2012 2013 Target
Avista Utilities 11
2013 Service and Reliability ReportOFFICE Indices
Chart 3.1 – SAIFI - Sustained Interruptions / Customer
Major Events
5.0 Excluding Major Events
4.5
Sustained Interruptions/Customer
4.0
3.5
3.0
2.5
2.0
1.5 3.28 3.07
1.0 1.71 1.52 1.68 1.22 1.58
0.5 0.74 0.99 1.06 1.06
0.54
0.0
Chart 3.2 - MAIFI Momentary Interruption Events / Customer
Major Events
14 Excluding Major Events
Momentary Interruptions/Customer
12
10
8
6
4 7.4
5.2
2 4.1 3.5 3.4 3.8
2.4 3.3 1.6 1.9 2.3
0 0.8
Avista Utilities 12
2013 Service and Reliability ReportChart 3.3 - SAIDI – Average Outage Time / Customer
Major Events
Average Outage Time / Customer
1100 Excluding Major Events
1000
900
800
700
(Minutes)
600
500
400
300 526 513
200 350
100 247 241 246
79 102 136 158 140
0 59
Chart 3.4 - CAIDI – Average Restoration Time
Major Events
Average Restoration Time / Customer
Excluding Major Events
250
200
(Minutes)
150
100 205 198
161 167 162
149 155 132
50 107 103 108
81
0
Avista Utilities 13
2013 Service and Reliability ReportAreas of Concern As in previous years, Colville continues to have the lowest reliability of Washington’s operating areas. However, the Colville area continues to show improvement over previous years as work plans are implemented. Colville was judged lowest based on its performance in the yearly indices for SAIFI, SAIDI, CAIDI, and MAIFI. Within the Colville area, six feeders were identified as the Areas of Concern for 2013. Additionally one feeder in the Spokane area is included as an area of concern. These feeders are Gifford 34F1, Gifford 34F2, Colville 34F1, Spirit 12F1, Valley 12F1, and Valley 12F3 in the Colville Area, and Opportunity 12F1 in the Spokane area. Valley 12F3 and Opportunity 12F1 are new areas of concern for 2013 while the remaining feeders were also identified in the 2012 report (UE-130649). Cause Information Generally, rural areas have a greater number of outages per customer. Colville is predominately rural and most feeders traverse forested areas. There are approximately 2,417 miles of distribution line exposed to weather, underground cable failures and tree problems. Unlike most of the Company’s system, lines in this area are built on the narrow, cross-country rights-of-way, typical of PUD construction practices prior to Avista acquiring the system. These conditions make patrolling, tree trimming, rights-of-way clearing and other maintenance difficult. When cost effective, Avista moves sections of these overhead lines to road rights-of-way and/or converts them to underground. Further, when outages occur in rural areas, the time required to repair damage is longer. More time is required for first responders to arrive and assess the damage and more time is required for the crew to reach the site. Often the damage is off road and additional time is required to transport materials and equipment to the site. Snow loading on green healthy trees growing beyond the rights-of-way often causes them to bend or break and contact distribution lines. These trees are not cut as part of our vegetation management program because they are outside our rights-of-way and are considered healthy marketable timber. Listed below is a summary of the specific cause data for each feeder. This is a compilation of data from the Avista OMT and the reporting from our local servicemen to Distribution Dispatch. Data from the reporting system is shown as a percentage of total customer-outages, (SAIFI) for that feeder. A single, major wind storm was the main factor in Opportunity 12F1 becoming an area of concern in 2013. The storm caused a prolonged outage that affected the entire feeder. This single event represented more than 60 percent of the total customer hours interrupted on the feeder for the year. It is believed that this is an isolated incident and that the reliability indices will normalize in the future. Avista Utilities 14 2013 Service and Reliability Report
Gifford 34F1
 ANIMAL                     5.0%
 COMPANY                    6.0%
 MISCELLANEOUS              4.0%
 POLE FIRE                  0.5%
 PUBLIC                     0.1%
 TREE                       5.7%
 UNDETERMINED               8.9%
 WEATHER                   11.4%
 EQUIPMENT OH              27.2%
 EQUIPMENT UG               0.0%
 EQUIPMENT SUB              0.0%
 PLANNED                   31.1%

Gifford 34F2
 ANIMAL                     0.3%
 COMPANY                    0.0%
 MISCELLANEOUS              0.0%
 POLE FIRE                 16.2%
 PUBLIC                     0.0%
 TREE                       5.9%
 UNDETERMINED               7.4%
 WEATHER                   17.9%
 EQUIPMENT OH               0.9%
 EQUIPMENT UG               0.0%
 EQUIPMENT SUB              0.0%
 PLANNED                   51.4%

Colville 34F1
 ANIMAL                     0.2%
 COMPANY                    0.0%
 MISCELLANEOUS              0.0%
 POLE FIRE                  0.5%
 PUBLIC                     8.1%
 TREE                      16.4%
 UNDETERMINED               2.1%
 WEATHER                   41.3%
 EQUIPMENT OH              23.7%
 EQUIPMENT UG               0.7%
 EQUIPMENT SUB              0.0%
 PLANNED                    7.1%

Spirit 12F1
 ANIMAL                     0.0%
 COMPANY                    0.0%
 MISCELLANEOUS              0.0%
 POLE FIRE                  0.0%
 PUBLIC                     0.0%
 TREE                      35.6%
 UNDETERMINED               0.3%
 WEATHER                    9.9%

Avista Utilities                      15
2013 Service and Reliability Report
EQUIPMENT OH               4.8%
 EQUIPMENT UG               0.1%
 EQUIPMENT SUB              0.0%
 PLANNED                   49.3%

Valley 12F1
 ANIMAL                    15.7%
 COMPANY                    0.0%
 MISCELLANEOUS              0.0%
 POLE FIRE                  0.0%
 PUBLIC                     0.3%
 TREE                       2.6%
 UNDETERMINED               3.6%
 WEATHER                    1.7%
 EQUIPMENT OH              15.2%
 EQUIPMENT UG               0.0%
 EQUIPMENT SUB             15.2%
 PLANNED                   45.6%

Valley 12F3
 ANIMAL                    15.8%
 COMPANY                    0.0%
 MISCELLANEOUS              0.0%
 POLE FIRE                  0.0%
 PUBLIC                    10.7%
 TREE                       0.2%
 UNDETERMINED               0.0%
 WEATHER                    1.7%
 EQUIPMENT OH              23.0%
 EQUIPMENT UG               0.1%
 EQUIPMENT SUB              0.0%
 PLANNED                   48.4%

Opportunity 12F1
 ANIMAL                     0.0%
 COMPANY                    0.0%
 MISCELLANEOUS              0.0%
 POLE FIRE                  0.0%
 PUBLIC                    34.6%
 TREE                       1.1%
 UNDETERMINED               0.2%
 WEATHER                   62.2%
 EQUIPMENT OH               1.9%
 EQUIPMENT UG               0.0%
 EQUIPMENT SUB              0.0%
 PLANNED                    0.0%

Avista Utilities                      16
2013 Service and Reliability Report
Colville Area Work Plans

The improvement work that has been accomplished or planned for each feeder is listed below. The
Company’s reliability working group is continuing to study these feeders to develop additional work
plans. Each of the identified feeders also had planned outages that correspond to the maintenance and
replacement activities in the area.

Gifford 34F1
    • Storm damage to lines led an effort to reconductor sections to 2/0 ACSR in 2012.
    • A recloser is budgeted to be installed in 2014/2015 that will allow for better sectionalizing
       between the northern and southern sections of the feeder during outage events.
    • $167k is budgeted in 2014 to replace 2 miles of overhead distribution line with underground cable.

Gifford 34F2
    • Due to Cultural review issues on some of the Tribal lands only 3,000 feet of OH conductor was
       replaced in 2010. Continued work and negotiations for the remaining 5,000 feet occurred in 2011.
       Final work was completed in 2012.
    • Vegetation Management work planned for 2012 was re-prioritized to 2011 after circuit assessment
       showed a large number of dead or dying trees within radius of contact of our lines. Line clearance
       crews trimmed 651 trees and removed 867 trees in 2011.
    • $167k is budgeted in 2014 to reconductor 2 miles of overhead distribution line.

Colville 34F1
   • Vegetation Management crews were called to trim 3 trees and remove 59 trees as “unplanned”
       work on this circuit in 2011. A fall 2011 assessment of this circuit showed a significantly high
       mortality rate of trees within radius of contact of lines on the feeder. A line clearance crew began
       Risk Tree mitigation work on this circuit in February, 2012.
   • $100k was budgeted in 2011 to replace outage prone overhead sections with URD cable.
   • $62k was budgeted to install wild life guards in 2011. Approximately 65% of the CLV12F1
       feeder was completed in 2011. Remaining work was completed in 2012.
   • $250k was budgeted in 2013 to replace overhead line sections with URD cable to reduce tree
       exposure. Work was completed in 2013.
   • $50k was budgeted in 2013 to install a recloser to allow for better outage sectionalizing. Work was
       completed in 2013.

Spirit 12F1
   • Feeder is scheduled to be part of the Grid Modernization program for 2014. Feeder will have
        reconductor and fusing work performed as well as other upgrades that may improve reliability.

Valley 12F1
   • No work scheduled for 2014.

Valley 12F3
   • No work scheduled for 2014.

Avista Utilities                                                                                        17
2013 Service and Reliability Report
Table 4.1 - Colville Area Major Reliability Projects by Feeder
Feeder Decisions/ basis 2014 2015 and Beyond
Gifford 34F1 Reliability improvements Reconfigure to install recloser No work planned in the
next 5 years.
Gifford 34F2 Reliability improvements No work planned No work planned in the
next 5 years.
Colville 34F1 Reliability improvements Underground Cable No work planned in the
conversion, install recloser next 5 years.
SPI12F1 Reliability Improvements Grid Modernization Program Finish Grid
Feeder Modernization in 2015
Valley 12F1 Reliability Improvements No work planned. No work planned in the
next 5 years.
Valley 12F3 Reliability Improvements No work planned. No work planned in the
next 5 years.
Table 4.2 - Colville Area Historical & Proposed Future Reliability Projects by Feeder
Veg.
Last Proposed Last Mgmt. Wildlife
Feeder WPM Proposed WPM WPM Follow- Transformer Veg. Proposed Guards
Name Insp. Inspection up Change-outs Mgmt. Year Proposed Year
25% in 2012
Last 2011
2011- 25% per year for 25% in 2013
GIF34F1 18 in 2014 2009 2015 N/A on
2014 4 yrs 25% in 2014
Proposed
25% in 2015
Past 2018 Plan 69 in
GIF34F2 1995 N/A 2011 2016 N/A
AM will need to 2013/2014
project
Last 2011
2027
CLV34F1 2007 2028 49 in 2015 2007 2013 N/A on
20 year cycle
Proposed
Completed in
2030 2011 (except 188 in
VAL12F1 2010 2010 2016 N/A
20 year cycle for WSDOT 2013/2014
ROW poles)
Grid
2033
SPI12F1 2013 Modernization 6 in 2013 2011 2016 N/A
20 year cycle
Project
22 changed
out since
2019
VAL12F3 1998 2020 2010 2010 2015 N/A
20 year cycle
38 more by
end of 2016
Avista Utilities 18
2013 Service and Reliability ReportAvista System Wide Work Plans
Material records show that some wildlife guards were installed on new distribution transformers
installations starting in the mid 1980’s. With the recognition of increases in animal caused outages, new
materials and improvements have been made in the construction standards for new distribution
transformer installations to reduce these types of outages. Initial indications show that the outage
reduction on a feeder after wildlife guards are installed is significant.
2009 was the start of the multiyear wildlife guard installation program to reduce the squirrel and bird
related outages on approximately sixty feeders in Washington and Idaho. Most of the wildlife guards were
installed with a hot stick on existing transformers that do not have an existing wildlife guard.
Avista installed a total of 1,570 wildlife guards on 15 feeders in 2013. The chart below shows the
effectiveness of the wildlife guard program in reducing squirrel related outages.
Chart 4.1 – Squirrel Related Events
Squirrel Outages
1000
Management Tracking (OMT)
Number of Events in Outage
800
600
400
200
0
2004 2006 2008 2010 2012 2014
Year
Avista Utilities 19
2013 Service and Reliability ReportChart 4.2 – Wood Pole Management Related Events
WPM Related Events
2000
Outage Management
Number of Events in
Tracking (OMT)
1500
1000
500
0
2005 2007 2009 2011 2013
Year
Asset Management in conjunction with the Wood Pole Management Program over the last three years has
stubbed/reinforced or replaced numerous poles, replaced numerous pole top transformers and associated
cutouts/arresters. The impacts of the program are shown in the chart above. Below is a chart that
summarizes the Wood Pole Management activities.
Chart 4.3 – Wood Pole Management Actions
3,000
2,584
2,500 2,357
2,000 1,864
2011
1,500
2012
1,049
1,022 1,090
983 2013
1,000 884 850846821 825
771
662
548
500
0
Poles Replaced Poles Cross Arms Cutouts Transformers
Reinforced Replaced Replaced Replaced
Avista Utilities 20
2013 Service and Reliability ReportAvista Grid Modernization Program
Grid Modernization Program Overview
Avista has initiated a Grid Modernization Program that is designed to reduce energy losses, improve
operation, and increase the long-term reliability of its overhead and underground electric distribution
system. The program will include replacing the following item: poles, transformers, cross arms, arresters,
air switches with steel arms, grounds, cutouts, riser wire, insulators, and conductors to address concerns
related to age, capacity, high electrical resistance, strength, and mechanical ability. Changes, including
the addition of wildlife guards, smart grid devices, switch capacitor banks, balancing feeders, removing
unauthorized attachments, replacing open wire secondary, and reconfigurations are included in the
Program.
Grid Modernization Program Objectives
• Safety – Focus on safe practices for crew work by designing work plans to avoid safety risks.
• Reliability – Replacing aging and failed infrastructure that has a high likelihood of creating an
unplanned crew call-out.
• Energy Savings – Replace equipment that has high energy losses with new equipment that is more
energy efficient and improve the overall feeder energy performance.
• Operational Ability – Replace conductor and equipment that hinders outage detection and install
smart grid devices that enable isolation of outages.
Avista System Wide Vegetation Management Plan
Avista has an annual vegetation management plan and budget to accomplish the plan. The budget is
allocated into distribution, transmission, administration, and gas line re-clearing.
Distribution
Avista’s distribution system is managed by Avista’s Utility Arborist. Every distribution circuit is
scheduled to be line clearance pruned on a regular maintenance cycle of five years. The program also
identifies risk trees system wide every two years. Risk tree management includes:
• Improved mid-cycle (two to three years after planned maintenance work is completed) Risk Tree
assessment and mitigation on circuits in our more heavily vegetated areas (such as the Colville
Division).
• Herbicide program to assess and address needed work on each circuit over a five year cycle (three
years after line clearance work performed).
Transmission
The transmission system is managed by Avista’s forester. All 230 kV lines are patrolled annually for
hazard trees and other issues, and mitigation is done in that same year. Approximately one third of the
115 kV transmission system is patrolled annually for hazard tree identification and assessment of right-of-
way clearing needs. Right-of-way clearing maintenance is scheduled and performed approximately every
ten to fifteen years (for each line). Interim spot work is done as identified and needed. Engineering
specifications for various voltages, line configurations are followed when clearing the right-of-way.
Currently, the work is bid to a variety of contractors.
Avista Utilities 21
2013 Service and Reliability ReportCustomers Experiencing Multiple Interruptions
Avista has used the data from the OMT system integrated with the GIS system to geospatially display
reliability data for specific conditions. The specific conditions imply looking at the number of sustained
interruptions for each service point (meter point). This would be similar to the SAIFI index, but would be
related to a certain number of sustained interruptions. Avista includes all sustained interruptions including
those classified under Major Event Days. This provides a view of what each customer on a specific feeder
experiences on an annual basis. Momentary Interruptions are not included in the CEMIn index because by
IEEE definition only applies to sustained outages. Other Momentary Indices are not included because of
the lack of indication at many rural substations and line locations.
The first chart below provides a view of the percentage of customers served from the Avista system that
have sustained interruptions. 72.8 % of Avista customers had one or fewer sustained interruptions and
3.1% of Avista customers had six or more sustained interruptions during 2013.
The remaining geographic plots show the sustained interruptions by color designation according to the
legend on each plot for each office area. Note the office area is designated as the area in white for each
plot and that there is overlap between adjacent office area plots. The adjacent office areas are shown in
light yellow.
The plots provide a quick visual indication of varying sustained interruptions, but significant additional
analysis is required to determine underlying cause(s) of the interruptions and potential mitigation.
Chart 5.1 - Avista Service Territory - CEMIn
2013 CEMI - Entire Company Note: AVA Customer
Count - 368,761
50.0%
46.0%
45.0%
40.0%
35.0%
30.0% 26.8%
25.0%
20.0%
14.4%
15.0%
10.0%
5.4%
5.0% 2.7% 3.1%
1.5%
0.0%
0 1 2 3 4 5 6 and Above
Avista Utilities 22
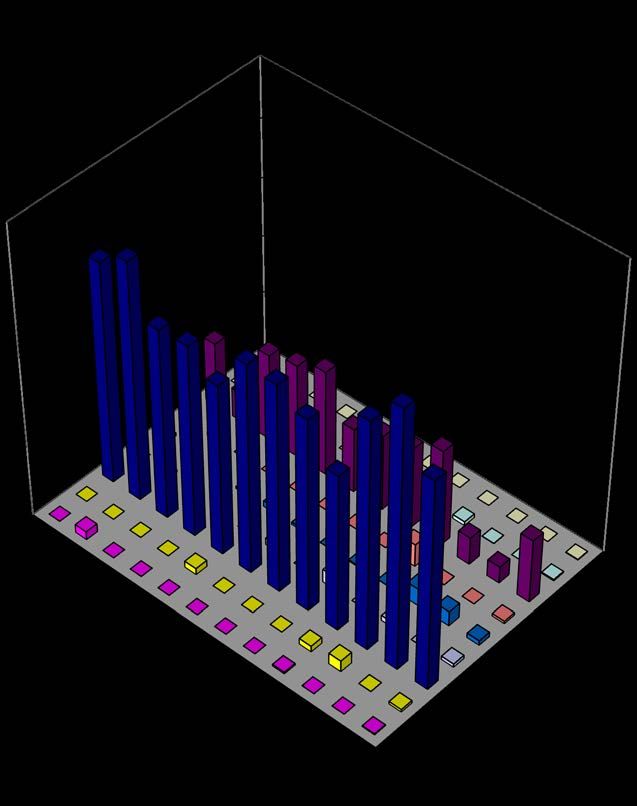
2013 Service and Reliability ReportChart 5.2 - Colville Office - CEMIn Avista Utilities 23 2013 Service and Reliability Report
Chart 5.3 - Davenport Office - CEMIn

Avista Utilities                       24
2013 Service and Reliability Report
Chart 5.4 - Deer Park Office - CEMIn

Avista Utilities                       25
2013 Service and Reliability Report
Chart 5.5 - Othello Office - CEMIn

Avista Utilities                      26
2013 Service and Reliability Report
Chart 5.6 - Palouse Office - CEMIn

Avista Utilities                      27
2013 Service and Reliability Report
Chart 5.7 - Lewis-Clark Office - CEMIn

Avista Utilities                         28
2013 Service and Reliability Report
Chart 5.8 - Spokane Office - CEMIn

Avista Utilities                      29
2013 Service and Reliability Report
Chart 5.9 - Sandpoint Office - CEMIn

Avista Utilities                       30
2013 Service and Reliability Report
Chart 5.10 - Kellogg Office - CEMIn

Avista Utilities                      31
2013 Service and Reliability Report
Chart 5.11 - Coeur d’Alene - CEMIn

Avista Utilities                      32
2013 Service and Reliability Report
Chart 5.12 - Grangeville Office - CEMIn

Avista Utilities                          33
2013 Service and Reliability Report
Monthly Indices
Each of the following indices, reported by month, shows the variations from month to month. These
variations are partially due to inclement weather and, in some cases, reflect incidents of winter
snowstorms, seasonal windstorms, and mid- and late summer lightning storms. They also reflect varying
degrees of animal activity causing disruptions in different months of the year.

Chart 6.1 – SAIFI - Sustained Interruptions / Customer
                                                                                                             Major Events

                                                       0.25
                   Sustained Interruptions/Customer

                                                       0.20

                                                       0.15

                                                       0.10                                                       0.19
                                                                                                                         0.15
                                                                                                    0.14
                                                       0.05
                                                                                    0.08                                        0.08 0.06 0.06
                                                                0.05 0.05 0.06 0.07                        0.07
                                                       0.00
                                                                Jan   Feb Mar       Apr May Jun             Jul   Aug Sep       Oct Nov   Dec

Chart 6.2 - MAIFI Momentary Interruption Events / Customer

                                                      1.0                 Major Events
 Momentary Interruptions/Customer

                                                                          Excluding Major Events

                                                      0.8

                                                      0.6

                                                      0.4

                                                      0.2                                          0.43           0.43
                                                                                                                         0.32
                                                                                         0.19              0.16
                                                            0.13 0.06 0.12 0.12                                                 0.11 0.08 0.14
                                                      0.0
                                                              Jan   Feb   Mar     Apr    May       Jun     Jul    Aug    Sep    Oct Nov    Dec

Avista Utilities                                                                                                                                 34
2013 Service and Reliability Report
Chart 6.3 - SAIDI – Average Outage Time / Customer
60
Average Outage Time/Customer
50 Major Events
40
(Minutes)
30
20
24 23
10
13 16
9 7 10 9 10 9
5 6
0
Jan Feb Mar Apr May Jun Jul Aug Sep Oct Nov Dec
Chart 6.4 - CAIDI – Average Restoration Time
300
Major Events
250 Excluding Major Events
Average Restoration Time
200
(Minutes)
150
100 216
156 149 158
126 125 128 139
50 117
94 93 96
0
Jan Feb Mar Apr May Jun Jul Aug Sep Oct Nov Dec
Avista Utilities 35
2013 Service and Reliability ReportCustomer Complaints
Table 7.1 - Commission Complaints
The following is a list of complaints made to the Commission during 2013.
Customer Complaint Complaint Resolution
/ Feeder Category
Valley WA Customer has been experiencing frequent power outages for over Outages Commission closed
VAL12F1 a year now, and most recently, he has had almost weekly outages complaint - Company
that are not weather related. Customer would like to know what is Upheld
causing the outages and what the company is doing to try and
resolve the recurring issues. He has spoken to the company, but
has not received any information on a solution to the outages.
Table 7.2 - Customer Complaints
The following is a list of complaints made to our Customer Service Representatives during 2013.
Office Complaint Complaint Resolution
/State Category
/Feeder
Colville Customer reports 7 outages due to weather in last 3 weeks, Outages Area Operations manager emailed customer
WA some lasting 9 hours. If service is that fragile, Avista needs to requesting that customer calls so he can explain
SPT4S21 do something different. Customer wants email response to: the outage- waiting for customer to call back.
ctrenfro@gmail.com
Spokane Customer concerned about 2 recent power outages- wanted Outages Email sent to customer from Area Engineer
WA to know if we found reason behind both and if we keep explaining reasons for outages and tracking of our
SIP12F4 historical record and take action if outages are considered system for repeated outages.
excessive.
Avista Utilities 36
2013 Service and Reliability ReportDeer Park Customer has a CPAP machine and is concerned about the Outages CSR Spoke with Area Engineer regarding customer
WA number of outages that occur in her area that only seem to concerns. Advised that customers farther away
DEE12F1 affect her and a few of her neighbors. She cannot sleep from substation and closer to the end of the line
without the CPAP, so when the power goes out (if at night) take longer to restore. It is a rural area so animals
she always wakes up. can be a factor. BPA uses lines and does work as
well.
Palouse Three times this year you have shut off the power in our town Outages CSR got information from operations on the calls
WA and we have never been notified, as there is a 3yr old and my that went out on 2 of the 3 outages here. 2 were
LEO611 wife has MS this is not acceptable, also the last time when it planned and calls, media were issued. One was an
came back on it was only 60 in our house. emergency shutdown for repairs with no time for
warning. Left VM for customer.
Spokane Customer says his power and neighbors frequently go out. He Outages CSR spoke to customer and looked at outage
WA thinks something is wrong with a section of the grid or history at his location - 3 were weather related
OPT12F1 distribution lines within 4 block radius and would like to know this year, 1 was car hit pole and 4 other outages in
if something can be replaced or done to prevent this. Would previous years. # of outages is about right
like a call back. compared to SV.
Kellogg Customer complaining heavily about our poor service during Outages Discussed outages with customer; customer has
ID outages. She calling the PUC & media. Customer just doesn’t not filed commission complaint.
MIS431 understand why she is always out & how bad our service is.
Calling her Senator to get her some other companies &
options in the area.
Davenport Customer upset power keeps going out and rates keep going Outages Emailed Engineering Department suggestions per
WA up. Suggests we use smart grid meters for everything. customer request
FOR12F1 Suggests using geothermal energy from Yellowstone to power
the country. No call back required.
Coeur Customer upset about power blips off and on and says he has Outages Customer information shows 3 outages this year.
d’Alene had multiple outages this year; advised if he has a power Gary will stay in touch if he has any type of outage
ID outage to contact us and we can start tracking any problems. so we can track and find out what the cause is.
HUE141
Davenport Continued power outages, 2 this month and customer wants Outages Area Engineer called customer to discuss outages.
WA to know why we are not bypassing things. He wants someone Outages are momentary with 2 in the last month.
LL12F1 in Avista to be honest with him. He is quite disgruntled about We will patrol feeder looking for tree issues, etc.
the way he feels we handle our business.
Avista Utilities 37
2013 Service and Reliability ReportYou can also read