ELIZABETH LUNDEEN, PHD, MPH - VISION HEALTH INITIATIVE, U.S. CENTERS FOR DISEASE CONTROL AND PREVENTION
←
→
Page content transcription
If your browser does not render page correctly, please read the page content below

Vision Impairment and Blindness in the U.S.: New
National, State, and County-level Prevalence Data

              Elizabeth Lundeen, PhD, MPH
              Vision Health Initiative, U.S. Centers for
              Disease Control and Prevention

              David B. Rein, PhD, MPA
              NORC at the University of Chicago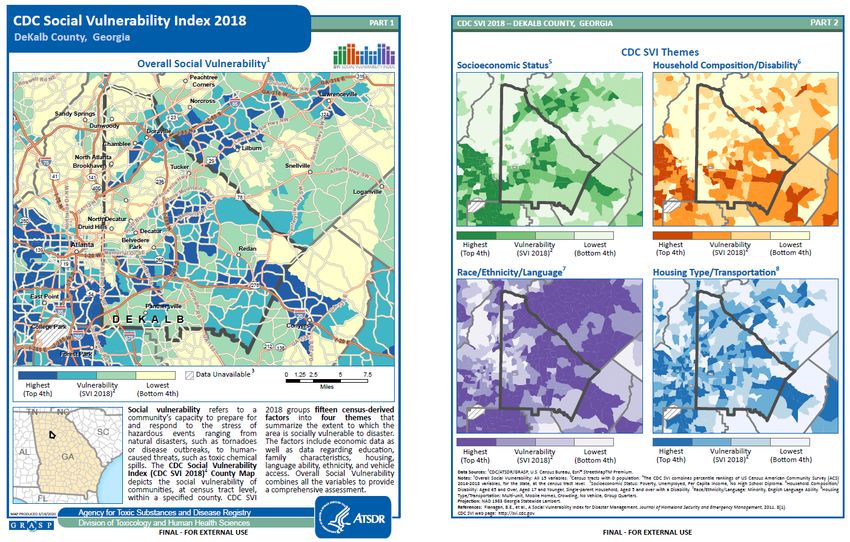
CDC’s Vision Health Initiative: Current and
Future Priorities
Elizabeth Lundeen, PhD, MPH

Centers for Disease Control and Prevention
National Center for Chronic Disease Prevention and Health Promotion

Division of Diabetes Translation
Vision Health Initiative of the Centers for Disease
1 Control and Prevention
The Vision Health Initiative (VHI) began in 2002
Located in CDC’s Division of Diabetes Translation
4
Mission: to promote vision health and quality of life for all populations,
throughout all life stages, by preventing and controlling eye disease, eye
injury, and vision loss resulting in disability
Aim: to enhance surveillance and applied research that provides the basis for
effective public health programs and policy decisions to reduce the burden of
vision loss
3
https://www.cdc.gov/visionhealth/index.htm
VHI Timeline: Major Milestones
 CDC’s  1 Behavioral
      Risk Factor                        Vision Health
Surveillance System                         Initiative
 (BRFSS) diabetes                      formed after CDC
module measured the                   convened a meeting
                                                                           Optional vision
 utilization of yearly                  of distinguished
                                                                              module
       dilated eye                    experts in vision and
                                                                          implemented by
      examination                          eye health
                         1995–1996                            2003            BRFSS          2005-2008
        4

   1991–1994          BRFSS diabetes         2002          CDC received        2005         CDC funded and
                    module expanded to                Congressional funding              implemented NHANES
                     include questions                for the “Blindness and             ophthalmic component
                        about visual                  Vision Loss Prevention               with digital fundus
                    functioning and eye                      Program”                            photos
                    care among people
                       with diabetes                                                                     4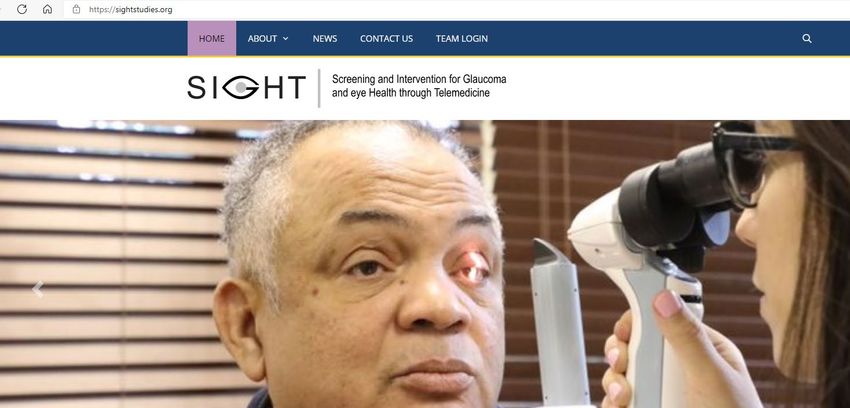
VHI Timeline: Major Milestones
                                           NASEM report
      1
                                       “Making Eye Health a
 CDC began funding                       Population Health                           VEHSS won an award
 programs to identify                       Imperative”                              at the American Public
  populations at high                   recommended CDC                                Health Association
risk of glaucoma and                          develop                                 Annual Meeting: The
     provide early                       a US surveillance                            Vision Care Section
 screening, detection,                 system for vision and                         Outstanding Scientific
   and intervention                          eye health                               Paper/Project Award
                          2015                                       2018
        4

      2012              CDC began a           2016               Vision and Eye              2020
                   cooperative agreement                       Health Surveillance
                  with NORC to “Establish                       System (VEHSS)
                  a Vision and Eye Health                           launched
                  Surveillance System for
                         the Nation”
                                                                                                              5
6

CURRENT
VISION
HEALTH
INITIATIVE
PRIORITIES

Promoting Health Equity and Reducing Health Disparities
1
Vision Health Initiative seeks to:
Develop interventions that promote eye health and prevent vision loss
and blindness in groups at high risk
Reduce disparities in vision loss and eye disease
4
Since 2012, VHI has been providing funding through cooperative
agreements to implement innovative strategies to identify and reach
populations at the greatest risk of developing glaucoma by intervening with
early screening, detection, and treatment in community-based settings
7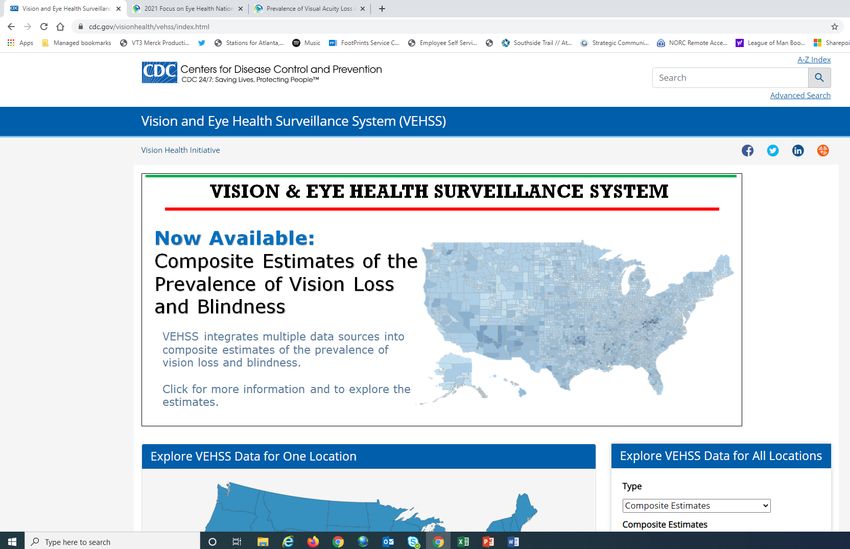
https://sightstudies.org/
Glaucoma Detection and Management: SIGHT Studies
1
Columbia University (coordinating center)
Reaching racial and ethnic minority groups at highest risk of glaucoma and vision impairment
by implementing a community vision screening and follow-up intervention for people living in
affordable housing in the New York City neighborhoods of Harlem and Washington Heights
Using patient navigators to help patients get recommended follow-up eye care
University of Michigan
4
Using a validated telemedicine approach to screen for glaucoma and other eye diseases
among populations at high risk in community primary care clinics
Implementing personalized counseling and education programs through an electronic
platform to improve glaucoma follow-up care
University of Alabama at Birmingham
Implementing a primary care-based glaucoma screening program in Federally Qualified
Health Centers in rural communities
Using portable device taken directly to patients to conduct optic nerve structure assessments
9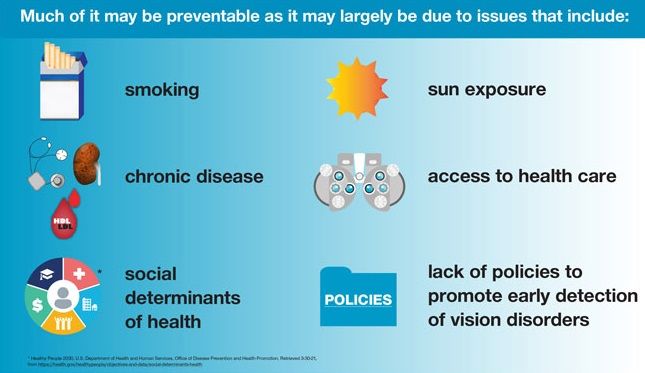
SUPPORTING STATE AND COMMUNITY PARTNERS
Collaborate with the National Association of Chronic
Disease Directors (NACDD)
Promote the dissemination of evidence-based vision health
interventions
Integrate vision health activities into broader public health
strategies and interventions
Fund eight state partners working to improve vision health equity
in populations at higher risk of vision loss and least likely to have
access to eye care
Providing access to vision screening in local health departments and
community health clinics
Providing innovative telehealth services to people who are most likely
to have health conditions such as diabetes that cause vision loss
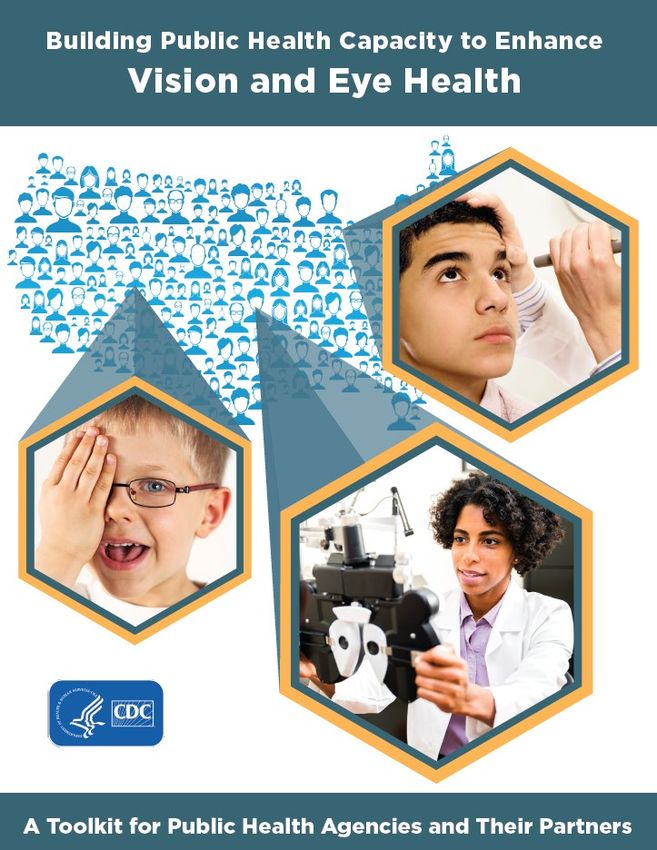
10Toolkit to help state, tribal, local, and territorial public health agencies and their partners: Assess the level of vision impairment in their communities Build effective partnerships Implement effective and sustainable interventions to improve vision and eye health Evaluate the impact of vision-related interventions https://www.cdc.gov/visionhealth/programs/vision-toolkit.html
State profiles provide data to help states assess
 the level of vision impairment in their
 communities

https://www.cdc.gov/visionhealth/data/state-profiles/index.htm
Economic Burden of Vision Loss and Eye Diseases
1
Estimates of economic burden of vision loss and eye diseases published in 2006*
Annual total financial burden of major adult visual disorders was $35.4 billion
Economic toolkit to update these estimates
Update estimates and provide state-specific economic burden of vision loss and eye diseases
4 Online interactive data repository
Two papers (under peer review):
Estimate the economic burden of vision loss in the U.S. nationally and by state
Estimate Medicare payments for diagnosed major eye disorders among fee-for-service
beneficiaries in 2018
13
*Rein et al. The Economic Burden of Major Adult Visual Disorders in the United States. Arch Ophthalmol. 2006;124:1754-1760.Surveillance of Vision and Eye Health in the U.S.
Assess the burden of vision loss and eye diseases nationally and by
states and counties
Understand differences in vision loss and eye diseases by:
• Geography
• Age
• Sex
• Race/ethnicity
• Risk factors (diabetes)
14Data:
National surveys
NHANES
NHIS
ACS
BRFSS
NSCH
Administrative claims
Medicare
Medicaid
Marketscan
VSP Global managed vision
care Summary:
Electronic health record (EHR) 10 datasets (survey, EHR, claims)
registry
IRIS® (Intelligent Research
Over 220 vision and eye health indicators
in Sight) National-, state-, and county-level estimates
https://www.cdc.gov/visionhealth/vehss/index.htmlVEHSS TOPICS Prevalence of Vision Loss by U.S. County
Eye health conditions
Self-reported
Measured
Claims-based diagnoses
Visual function
Measured visual acuity
Self-reported visual function
Service utilization
Eye exams
Medical treatments
Low vision services
Vision correction
16FUTURE VISION HEALTH INITIATIVE PRIORITIES
17Advancing Science and Epidemiology
1
Validation study with University of Washington to assess the degree of
concordance between different VEHSS indicators
Self-reported survey questions
Claims
Electronic health records
Clinical chart abstraction (gold standard)
4
Advanced statistical methods (Bayesian meta-analysis) to develop composite
estimates of the prevalence of vision loss and blindness in the U.S.
18
Flaxman et al. Prevalence of Visual Acuity Loss or Blindness in the US: A Bayesian Meta-analysis. JAMA Ophthalmol. 2021; e210527.
Online ahead of print.Geographic Disparities: County-Level Surveillance Data
1
Composite estimates of
vision loss and blindness
4 Medicare claims
American Community
Survey
19Social Determinants of Vision and Eye Health
1
Support research and surveillance to
better understand the social
determinants of vision and eye health
Datasets:
o National Health Interview Survey
4
o American Community Survey
o Behavioral Risk Factor Surveillance System
o National Health and Nutrition Examination
Survey
https://health.gov/healthypeople/objectives-and-data/social-determinants-health 20https://www.atsdr.cdc.gov/placeandhealth/svi/index.html
NHANES Retinal Fundus Photo Artificial Intelligence Project
1
National Health and Nutrition Examination Survey (NHANES)
2005–2008
o Performing a validation study comparing retinal fundus photo
4 grading for diabetic retinopathy performed by deep learning
algorithms to the gold standard ophthalmologist grading
o Evaluate the potential for using deep learning algorithms in
future NHANES surveys to provide faster and less expensive
grading of retinal photos
22Support Future NHANES Ophthalmology Module
1
National Health and Nutrition Examination Survey (NHANES) ophthalmology
module (last implemented in 2005–2008)
Only nationally-representative prevalence estimates using measured vision
and eye health data:
4
• Visual acuity
• Eye diseases
o Diabetic retinopathy
o Glaucoma
o Age-related macular degeneration
Timing of future repeat to be determined
23Thank You CONTACT: ELIZABETH LUNDEEN, PHD, MPH ELUNDEEN@CDC.GOV Centers for Disease Control and Prevention National Center for Chronic Disease Prevention and Health Promotion Division of Diabetes Translation The findings and conclusions in this report are those of the authors and do not necessarily represent the official position of the Centers for Disease Control and Prevention.
Vis ion Impairment and Blindnes s in
the U.S.
New National, S tate, and County-level P revalence Data
07.14.21 : Version 1.1
David B. Rein, Ph.D.

On Behalf of the Vis ion and Eye Health Surveillance
Sys tem Study Group
Agenda

01 Acknowledgements

02 Background & Objective

03 Data & Methodology

04 New Es timates

05 Conclus ions & Extens ions
A C K N OW L E DGE M E N T S : S T UDY T E A M                                                                                                                                                                                           3

Paper: Prevalence of Vis ual Acuity Los s or Blindnes s in the US : A Bayes ian
Meta-analys is 1
.

    Abraham Flaxman,                                                                       J ohn Wittenborn,                                                                        Bob Gerzoff,
    T os hana Robalik,                                                                     David Rein                                                                               Elizabeth Lundeen,
    Rohit Gulia                                                                                                                                                                     J inan S aaddine

    1 Flaxman, A. D., Wittenborn, J . S ., R obalik, T ., Gulia, R ., Gerzoff, R . B., Lundeen, E. A., S aaddine, J . & D.B. R ein on behalf of the Vis ion and Eye Health S urveillance S ys tem S tudy Group. (2021). P revalence of
    Vis ual Acuity Los s or Blindnes s in the US : A Bayes ian Meta-analys is . J AMA Ophthalmol. doi:10.1001/jamaophthalmol.2021.0527
Background
B A C K G R OUN D : P R E V I OUS E S T I M A T E S                                                                                                                                                5

United S tates prevalence of uncorrectable vis ual impairment or
blindnes s previous ly es timated at 4.2 million 2,3
Limitations of P revious Es timate
• By des ign, excluded pers ons younger than age 40

• Excluded ins titutionalized populations
       – Nurs ing homes and other long term care.
       – Pris ons

• P opulation-bas ed s tudy data: 8 to 36 years old

• No direct meas urements at the s tate level

Opportunities for new es timate
•      New data s ources and methods
•      VEHS S platform for data dis s emination
2. Prevent Blindnes s America. Vis ion problems in the US : prevalence of adult vis ion impairment and age-related eye dis eas e in America. Publis hed 2012. Acces s ed S eptember 30,
2019. http://www.vis ionproblems us .org/
3. Varma R, Vajaranant T S , Burkemper B, et al. Vis ual impairment and blindnes s in adults in the United S tates . J AMA Ophthalmol. 2016;134(7):802-809. doi:10.1001/jamaophthalmol.2016.1284
B A C K G R OUN D: OB J E C T I V E 6 Objective: Produce new es timates of vis ual acuity los s and blindnes s by age, s ex, race/ethnicity, and US s tate. Addres s limitations in exis ting es timates • Utilize population-repres entative data s ources . • Update population-bas ed s tudy data. • Include previous ly excluded population groups . • Us e empirical s elf-report meas urements to es timate s tate variation and provide additional information for under-repres ented groups (children and the oldes t old).
Data & Methodology
DA T A & M E T H ODOL OG Y : DA T A S OUR C E S                    8

Data S ources
• P opulation-bas ed s tudies :
   – Baltimore Pediatric Eye Dis eas e Study (BPEDS), 2003-2007
   – T he Chines e American Eye Study (CHES), 2010-2013
   – Eye Dis eas e Prevalence Res earch Group (EDPRG), 1985-1998
   – Los Angeles Latino Eye Study (LALES), 2000-2003
   – Multi-Ethnic Study of Atheros cleros is Cohort, 2000-2004

• National Health and Nutrition Examination S urvey (NHANES ),
  1999-2008

• National S urvey of Children’s Health (NS CH), 2016

• American Community S urvey (ACS ), 2017
DA T A & M E T H ODOL OG Y : M E T H ODOL OG Y                                             9

High Level Methods
• Bayes ian, Meta-regres s ion
   – Statis tical tool to es timate regres s ion models us ing multiple data s ources

• Intuition
   – NHANES is us ed as a the reference group. T he total amount of vis ion los s
     or blindnes s is bas ed on NHANES evaluations of bes t-corrected vis ual acuity
     in the better s eeing eye.
          • Any vis ual impairment = 20/40 or wors e in the better s eeing eye
          • Blindnes s = s ubs et of any vis ual impairment = 20/200 or wors e in better
            s eeing eye
   – Self-reported res pons es to “Are you blind, or do you have s erious difficulty
     s eeing even when wearing glas s es ?” were us ed to es timate relative variation
          • By s tate
          • Among groups not included in NHANES

           – Children younger than 12

           – Pers ons in long term care and pris ons

           – T he oldes t old

• Accounted for mis s ing data in NHANES , and us ed P BS data for
  additional evidence
New Es timates
N E W E S T I M A T E S : OV E R V I E W 11
P revalence of Vis ual P revalence R ate Acros s P revalence of Blindnes s
Impairment or All Ages
Blindnes s
7.08 mil 2.17% 1.08 mil
(95% UI, 6.32 -7.89 ) (95% UI, 0.82 – 1.30)
(95% UI, 1.94% - 2.42%)
P revalence of Vis ual P revalence of Vis ual P revalence R ate was
Impairment or Impairment or Higher for Women than
Blindnes s ages 0 to 39 Blindnes s in Group Men
Quarters
w. 2.52%
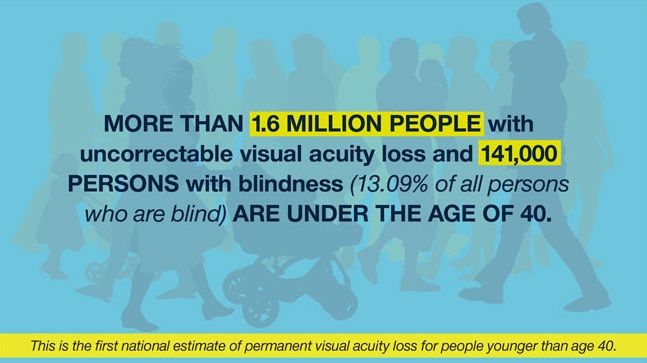
1.62 mil 358,000
(95% UI, 1.32 – 1.92) (95% UI, 263k – 472k)
m. 1.82%N E W E S T I M A T E S : P R E V A L E N C E R A T E B Y A G E A N D R A C E /E T H N I C I T Y 12 Prevalence rates increas ed with age and varied by race/ethnicity (although uncertainty intervals by race/eth overlapped)
NE W E S T IM AT E S : P R E V AL E NC E R AT E B Y S T AT E   13

Highes t P revalence
• WV 3.6%
• MS 3.3%
• DC 3.2%
• NM 3.0%
• AZ 3.0%

Lowes t P revalence
• ME 1.4%
• UT 1.4%
• IA 1.5%
• ND 1.6%
• AK 1.7%
N E W R E S UL T S : L I M I T A T I ON S                                             14

P rimary Limitations
• Mis s ing data in NHANES
    – Approximately 12% of NHANES obs ervations had mis s ing autorefractor data
    – Accounting for mis s ing data increas ed mean prevalence rate from 1.7% to
      2.2%

• Older data
    – Newer waves of NHANES examination data would be very valuable

• S elf-reported meas urements us ed to es timate variation
    – As s umption is s elf-reports are s trongly correlated with evaluated vis ual
      impairment
    – Forthcoming res earch s upports this as s umption, but s elf-reports are
      imperfect

• P otentially, the inclus ion of additional data s ources could improve
  thes e es timates
Conclus ions & Extens ions
C ON C L US I ON S A N D E X T E N S I ON S : C ON C L US I ON S                                      16

Conclus ions

• We es timated that 7.08 million people were living with vis ion impairment or blindnes s in the
  United S tates in 2017;
     – 5.46 million with vis ual impairment (20/40 to >20/200)
     – 1.62 million with U.S. defined blindnes s (20/200 or wors e)

• Compared to earlier es timates , 68% higher overall
     – Proportion of all vis ual impairment or blindnes s that is blindnes s is lower

• Bas ed on s elf-reported data, we es timated s ubs tantial and meaningful variation at the s tate
  level

• Moving forward, thes e methods can be us ed to update es timates of s tate variation and
  population, but new waves of NHANES-like evaluation-bas ed meas ures of bes t-corrected
  vis ual acuity are badly needed
C ON C L US I ON S A N D E X T E N S I ON S : E X T E N S I ON S 17 Vis it the Vis ion and Eye Health S urveillance S ys tem (VEHS S) Google: VEHS S CDC
C ON C L US I ON S A N D E X T E N S I ON S : E X T E N S I ON S        18

Want to Learn How to Us e VEHS S? T hurs day, J uly 15, S es s ion 3E
C ON C L US I ON S A N D E X T E N S I ON S : H E L P S P R E A D T H E W OR D           19

                                                          Materials for your
                                                          next pres entation.

                                                          https ://preventblindnes s
                                                          .org/prevalence-vis ual-
                                                          acuity-los s -blindnes s -us
David R ein
Direct, P ublic Health Analytics
T hank you.
Rein-david@ norc.org
On behalf of the VEHS S S tudy
GroupYou can also read