EMP AND AEMR USE OF TABLEAU FOR - APRIL 26, 2022 - Lower Columbia Estuary Partnership
←
→
Page content transcription
If your browser does not render page correctly, please read the page content below
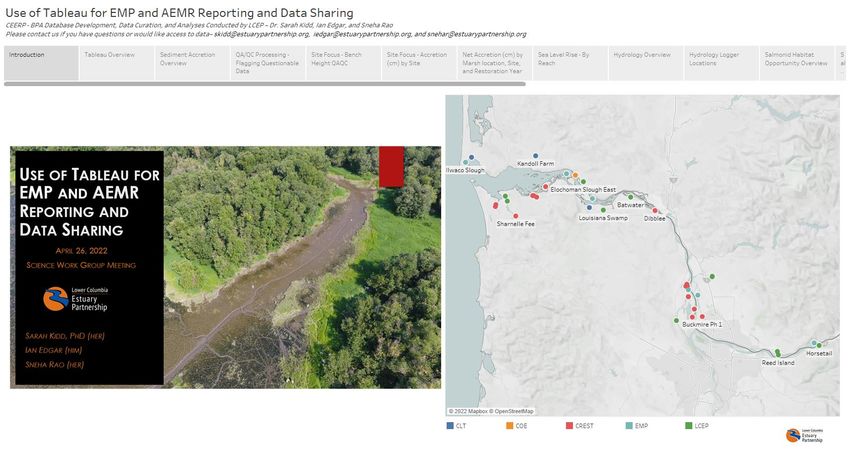
USE OF TABLEAU FOR
EMP AND AEMR
REPORTING AND
DATA SHARING
       APRIL 26, 2022
SCIENCE WORK GROUP MEETING

SARAH KIDD, PHD (HER)
IAN EDGAR (HIM)
SNEHA RAO (HER)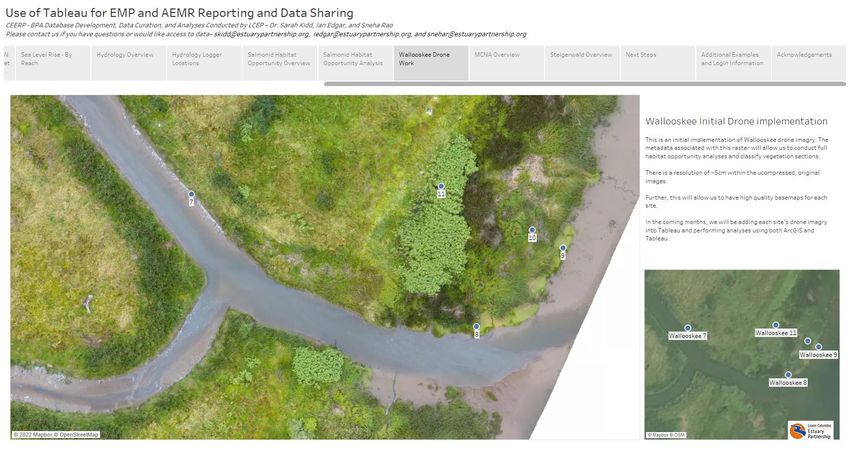
RESEARCH PARTNERS
Thank you!
     THANK YOU

                 Schott & Associates, Inc.

                                             April Silva, CREST
OUTLINE OF TALK
What are EMP and AEMR and What is she
even doing
Why Do they Require Data with all
Management? these data?!
Background Behind Tableau
Overview of Tableau as a
Data management Platform
Utility for Data Analysis and
Collaboration
Examples – Dashboards
we are developing
Next Steps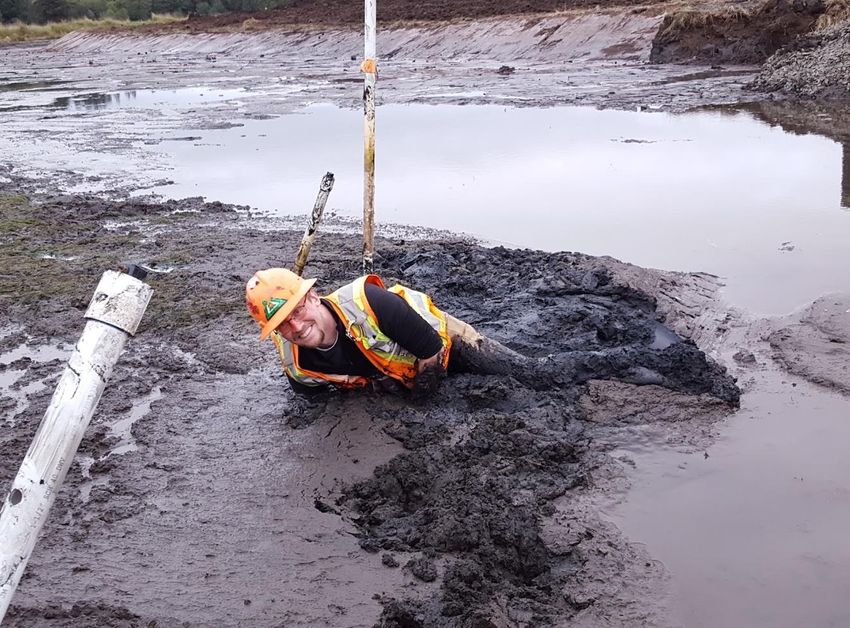
WHERE IS ALL THESE DATA COMING FROM?
COLUMBIA ESTUARY ECOSYSTEM RESTORATION PROGRAM (CEERP)
• Ecosystem Monitoring Program
  (EMP)
  • Status and trends monitoring of
    ecosystem condition
  • Provides basic understanding, fills
    knowledge gaps on estuarine - tidal
    freshwater section of lower river
  • Provides suite of reference sites for AEM

• Action Effectiveness Monitoring &
  Research Program (AEMR)
  • Allows evaluation of whether restoration
    actions achieved the goals of the
    project
  • Provides understanding of benefits of
    restoration actions
  • Depends on EMP for evaluation of results
Ecosystem Monitoring Program
SALMONID HABITAT MONITORING PROGRAMS
EMP = Ecosystem Monitoring Program 6 Trends site – Reference Condition - Methods here
✓ Mainstem and Abiotic Site Conditions - Joe Needoba (OHSU)
✓ Habitat Structure, Hydrology, Soils, Sediment Accretion, Detritus - Sarah Kidd, Sneha Rao, Ian Edgar (LCEP)
✓ Food Web, e.g., Planktonic and Macrophyte contributions to Juvenile Salmon Food Web - Tawnya Peterson
  (OHSU)
✓ Fish Prey and Macroinvertebrate Community - Jeff Cordell, Jason Toft, Kerry Accola (UW)
✓ Fish Community and Occurrence - (NOAA) Regan McNatt, Susan Hinton, Jeff Grote, Paul Chittaro, Dan Lomax
✓ Critical Field, Lab Support, UAV pilot - April Silva, Narayan Elasmar (CREST)
Action Effectiveness Monitoring Research Program
AEMR = Selected sites (Level 2) receive Full Habitat surveys – Pre, 1, 3, 5 and 10 yrs. post-restoration – Methods here
All sites (Level 3) receive Basic Hydrology and Sediment Accretion Monitoring Years 1-5, 10 yrs. post-restoration
 ✓ Habitat Structure, Hydrology, Soils, Sediment Accretion - Sarah Kidd, Sneha Rao, Ian Edgar (LCEP)
 ✓ Spot Check of Macroinvertebrate Community - Jeff Cordell, Jason Toft, Kerry Accola (UW)
 ✓ Spot Checks at Year 5 and 10 Post - Fish Community and Occurrence - (NOAA) Regan McNatt, Susan
   Hinton, Jeff                             Grote, Paul Chittaro, Dan Lomax
 ✓ Critical Field, Lab Support, UAV pilot - April Silva, Narayan Elasmar (CREST)
Need for a proper
Data Management
System              71+ Sites across the lower
                    Columbia

                                       Hydrology
     RIP Oncor      Level 3 AEMR       •6+ million datapoints
     2011-2018
                    Data               Sediment Accretion
                                       •8000+ datapoints

                    Level 2 AEMR       Vegetation and Soil

                    Data               •50,000+ datapoints

                                       Macros, Fish, Biomass,
                    Other              drone, etc.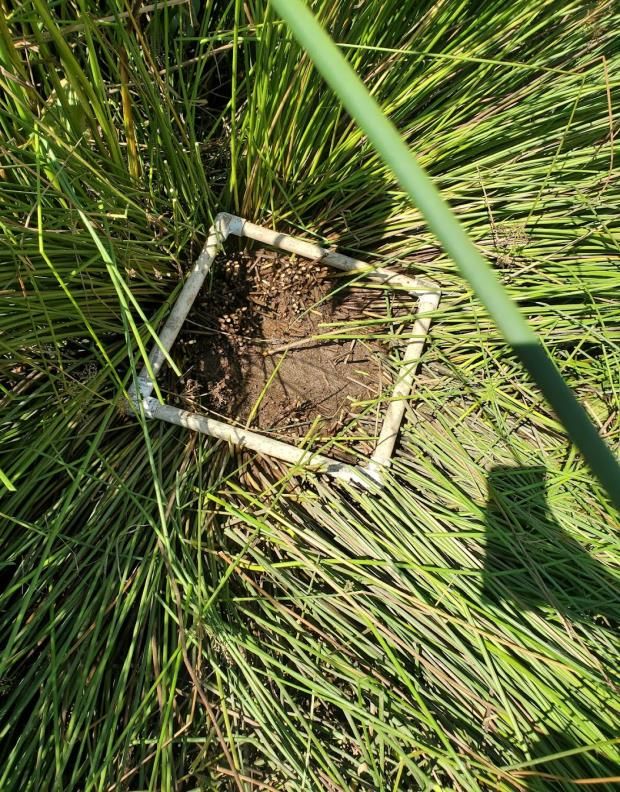
SOFTWARE OPTIONS AND CONSIDERATIONS

     Excel            MS Access, SQL, ArcPro,   R, Python, MATLAB, SASS,        Tableau
                         ArcCatalog - etc.           Exploratory, etc.

  ▪ Data Limits – What data limits are imposed (such as Excel’s row limits)
  ▪ Database Capacity – Does it provide a structure for storing and connecting data?
  ▪ Accessibility and Ease of Use – How hard is it for someone to use?
  ▪ QA/QC, Analysis, Visualization Capacity – Can you edit/analyze/graph your data?
  ▪ Mapping and Geospatial Analysis – Can you make maps and geolocate your data?
  ▪ Collaboration – Easy to share with others? (Proprietary data formats? Software
    requirements?)
  ▪ Online/Desktop Data Sharing – How easy is it to access and present data – online data
    hosting?
  ▪ Costs - How expensive is the software? Does everyone need to purchase the software
    to collaborate?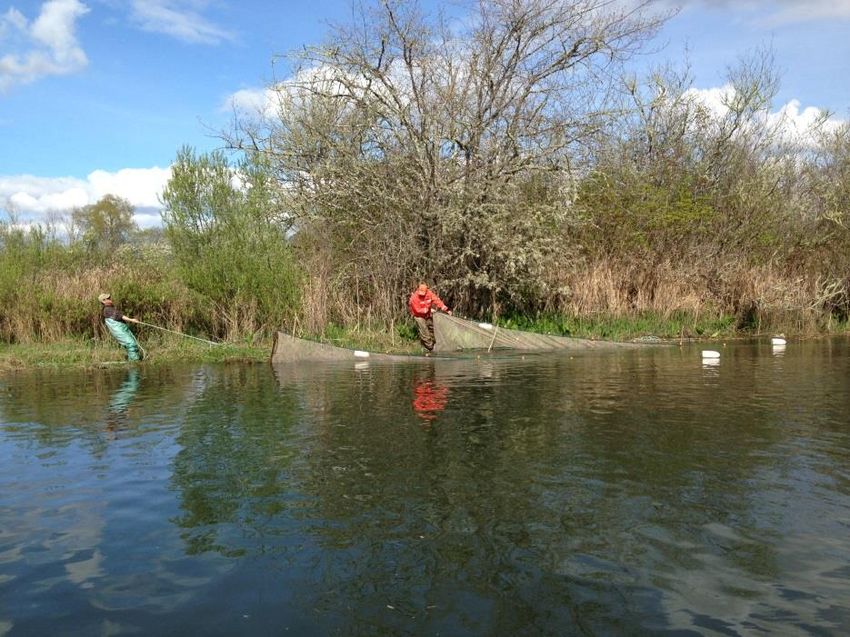
SOFTWARE CONSIDERATIONS
                           Data Limits, Challenges with
                           Time Series Data
        Excel                                             Tableau

 MS Access, SQL, ArcPro,
    ArcCatalog - etc.

R, Python, MATLAB, SASS,
     Exploratory, etc.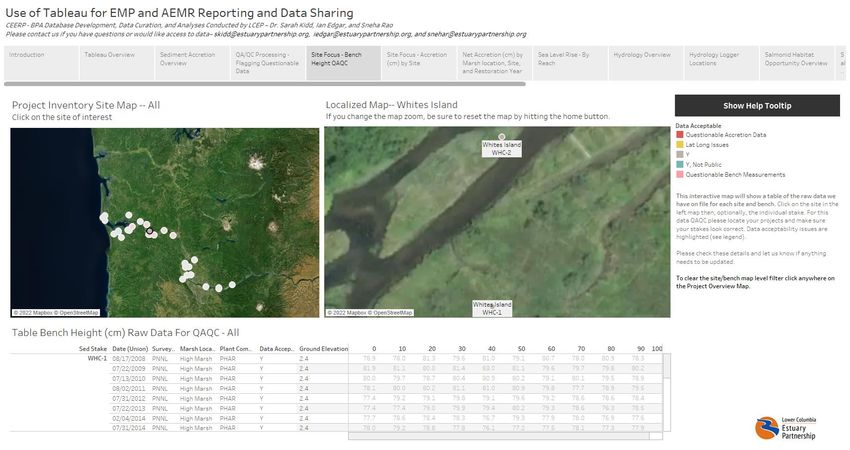
SOFTWARE CONSIDERATIONS
                            Data Limits, Challenges with
                            Time Series Data
        Excel                                                        Tableau

                           MS Access – Can hold
                           data, but not flexible or user friendly

                         Arc Products – The program is
                         best saved for specific geospatial
 MS Access, SQL, ArcPro, Analyses
    ArcCatalog - etc.

R, Python, MATLAB, SASS,
     Exploratory, etc.
SOFTWARE CONSIDERATIONS
Data Limits, Challenges with
Time Series Data
Excel Tableau
MS Access – Can hold
data, but not flexible or user friendly
Arc Products – The program is
best saved for specific geospatial
MS Access, SQL, ArcPro, Analyses
ArcCatalog - etc.
Coding isn’t for everyone
R, Python, MATLAB, SASS,
Exploratory, etc.Oregon Health Authority (OHA) Tableau Dashboard https://public.tableau.com/app/ profile/oregon.health.authority.covi d.19#%21/
Tableau: SOFTWARE OPTIONS AND CONSIDERATIONS
✓ No data limits
✓ Use databases across multiple projects; no
  information repeating required
✓ No required coding knowledge/ Low barrier for
  entry
✓ Easy Data Visualization and Analysis - Can
  import/use R and Python code and pivot inside
  Tableau
✓ Includes Geospatial Data Management,
  Mapping and Analysis
✓ Easy collaboration and dissemination of results
✓ No Application Required (can be used via web
  browser)
✓ Cost: Varies – but can be FREE for most
  collaborative needs
       More info: https://www.tableau.com/why-tableau/what-is-tableau
Create a Free, Public Access
Tableau Project Cost Varies, Password Access
PUBLICLY publish
Tableau PRIVATELY publish data,
data, create a
Public create a dashboard, or
dashboard, or
share a workbook &
share a workbook
Tableau work online in a
Desktop collaborative space
Read More – Here https://intellipaat.com/blog/what-is-tableau/Data management
Initial QA/QC
EXAMPLES OF
TABLEAU UTILITY
Exploration and Analysis
Dissemination of resultsThe following slides 15-34 will be viewed/showed using our interactive online Tableau Dashboard
Next Steps
Integrate and utilize these data to answer critical uncertainties at the site
level and across the lower River
     ➢ AEMR/EMP Starting Points:
     ✓ Compile, QA/QC, Explore All (Level 2/3 & EMP)
        I. Sediment Accretion/Erosion Data
        II. Hydrology Data
     ✓ Create Interactive Data Dashboards Reporting out for the AEMR sites surveyed in 2020 and 2021
        ➢ Include all data collected analyzed with meaningful metrics
     ✓ Seek feedback and continue to evolve our analysis and reporting

 Drone Inclusion                          Full EMP data synthesis     Full synthesis analyses of all     Transition all LCEP datasets
                                          analysis                    sites                              into Tableau
 Orthomosaic basemap for each             Macros, Fish, and Biomass   Focus on habitat opportunity and
 site using Mapbox                                                    impacts of specific restoration
 Full site wide statistics and analysis                               actions
 based on drone data
LOOK AT EXAMPLES ONLINE
Our Tableau Public Page (With examples – no login
required):
https://public.tableau.com/app/profile/sarah.ann.kidd
Login into our Tableau Online to See Today’s Examples
(we’ll keep this live for a few days):
Website: https://sso.online.tableau.com/public/idp/SSO
Login: monitoring@estuarypartnership.org
Password: EPMonitoring12!?
Watch this presentation: https://youtu.be/ExDxspBfsJo
Contact us if you are having any issues or questions:
Sarah Kidd – skidd@estuarypartnership.org
Ian Edgar – Iedgar@estuarypartnership.orgRESEARCH PARTNERS
Thank you!
THANK YOU
Schott & Associates, Inc.
April Silva, CRESTYou can also read