Flexible dissemination system for Census 2021
←
→
Page content transcription
If your browser does not render page correctly, please read the page content below
Flexible dissemination system for Census 2021

Introduction

• We are proposing to develop an online flexible dissemination
  system where users can specify the data they need and define
  their own queries to build tables.

• This presentation shows you some features of a prototype built to
  assess the feasibility of a flexible dissemination system.

• First, we’ll explain the background to the flexible dissemination
  system.
The benefits of a flexible dissemination system

• The system would allow census data to be:

  ➢ flexible – users will be able to define their own queries with opportunities
    for greater detail in the tables

  ➢ timely – outputs will be available sooner than they were for the 2011
    Census as they will be checked automatically online rather than manually
    by ONS

  ➢ accessible – the system will be hosted on the ONS website, meaning the
    majority of census data will be available from one location
Disclaimer
• In this presentation, images are for illustrative purposes only. They don’t
reflect the final design of the dissemination system user interfaces or output
table layout that might appear on the ONS website. Please read this
disclaimer:
➢ These slides have been produced to help you understand our proposals as outlined in
the ‘Initial view on 2021 Census output content design consultation document.
➢ The demonstration tool uses artificial test data.
➢ The output categories in tables are examples based on 2011 Census data. We’ll be
consulting with users closer to the 2021 Census to ensure output categories meet user
needs and labels used accurately describe the population being counted.Protecting confidentiality • We have a legal obligation to protect the confidentiality of respondents and ensure detailed outputs don’t reveal that information. • Statistical disclosure control ensures statistical outputs provide as much value and utility to users as possible, whilst maintaining the confidentiality of individuals, households and organisations. For 2021, we’re proposing to protect the data by: 1. targeted record swapping 2. applying a small degree of perturbation to the data 3. applying a set of automated checks before releasing tables
What is data perturbation?

• Data perturbation means slightly changing estimates where
  otherwise confidentiality would still be compromised in a table after
  the record swapping.

• The effect of perturbation is not statistically significant and doesn’t
  damage the data quality, but the changes will result in a small
  amount of inconsistency between some related tables.

• We are currently investigating the minimum amount of perturbation
  required to protect confidentiality whilst ensuring accuracy.
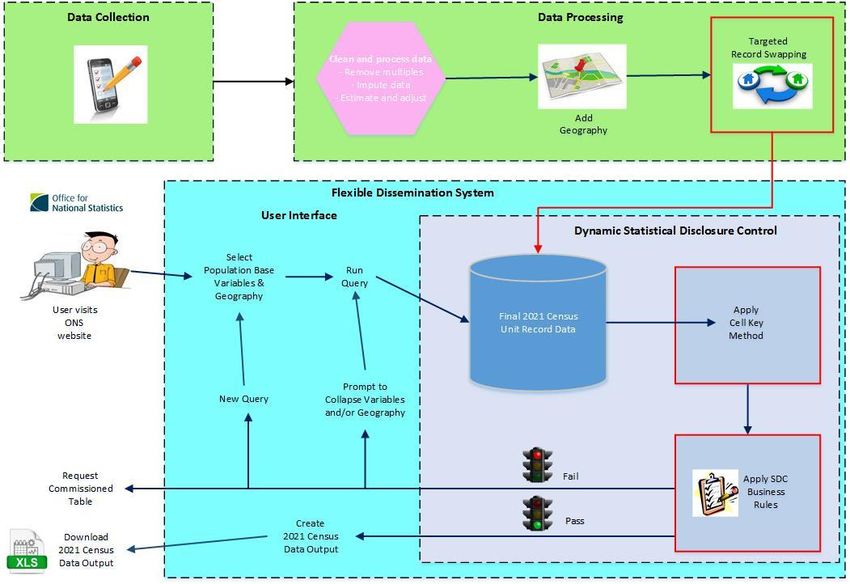
Flexible dissemination system

• The diagram on the following slide illustrates how the future system
  might look.

• The green boxes at the top give a general picture of how we
  process the census data and the record swapping is shown in the
  top right.

• The blue boxes below set out the main processes involved in
  meeting a user request for data. These include applying the
  perturbation and the automated checks that apply the business
  rules to control access.
Overview of flexible dissemination system
Flexible dissemination system

Now we’re going to show you some features of the current
approach:

1. We’ll show you a simplified version of the prototype we used to
   generate some tables.

2. We’ll explain how users might get more data for some
   geographic areas than for others.

3. We’ll show how the totals might differ due to perturbation.
The impact of automated checks

• We’ll use the demonstration version of our prototype to show you
  how the automated checks affect which data are provided.

• On the next slide is the starting page for a query

• There are four selections to make:
   ➢ population (later versions would have households and communal
     establishments)
   ➢ geography
   ➢ variables (sometimes called topics)
   ➢ view or download the data

   In this demo, the population is selected by default.
Step 1: Choose your population
Step 2: Choose your geography (Region)

• Our tool shows two geographies: London and the South West.
• We want to show data for an area with a diverse population so will
  choose London.
Step 3: Choose a lower level of geography (local
 authority)

• We’ll select the test local authority in London.
Step 4: Choose lower level of geography (Output
  Area)

• We’ll now select the Output Areas in our test local authority.
Step 5: Select variables

• We’ve selected the 19 category ethnic group.
• In this prototype, a description appears as the cursor hovers over
  the option.
Step 6: Select more variables

                                Number of areas for
                                which data will be
                                released
Selecting variables • As we choose the variables, you’ll see a reading showing the number of areas for which data will be released for that selection. • If we select too many variables, we won’t get any data for that area. • We select the religion variable and see we get data for all areas. Users in urban areas are likely to find they can request more detail than was available in ONS tables from the 2011 Census, for most areas.
Step 7: Download data

• Lastly, we can choose whether to download the data or view on
  screen.
New query

• Now we’ll create another query, but for a different part of the
  country.
• We’d like to show the effect of selecting an area with a more
  homogeneous population, so we choose the South West region.
Step 1: Choose your population
Step 2: Choose your geography (Region)
Step 3: Choose your geography (local authority)

• We select our test rural local authority in the South West.
Step 4: Choose lower level of geography (Output
  Area)

• We then select all the test Output Areas in that local authority.
Step 5: Select variables

• As we choose the variables, you’ll see a reading showing the
  number of areas for which data will be released for that selection.
• We won’t get data for all the Output Areas.

                                                          Number of areas for
                                                          which data will be
                                                          released
Impact of automated checks • These queries showed we’re getting data for fewer areas in the South West than in London. This is illustrated in the red and green circle. • The automated checks in the flexible dissemination system are making data for some areas unavailable. This is to protect information about some people in those areas. • Some queries may result in no data at all. There will be guidance on the ONS website about the protection and checks on the data. This will explain that census data for the less diverse areas of the country will be limited in detail to protect confidentiality.
Step 6: Download data

• We’ll download the table anyway, despite not getting all the data for
  that area.
Minor inconsistencies in the output data

• We’ve just looked at an important feature of the flexible
  dissemination system. This is to make more data available than in
  previous censuses, but this won’t be possible for some areas.

• Another feature of the flexible dissemination system is that the
  minor perturbation of data to protect confidentiality causes minor
  differences between tables.
Output table totals

• The next slides demonstrate the differences between output table
  totals.

• Repeating the same query for the same geographic area will
  always result in the same estimates.

• However, there will be some inconsistencies in the totals between
  different tables due to the perturbation applied by the cell-key
  method. This can occur by:
  1) geography
  2) variables
Comparing summed Output Area data with local
  authority tables

• The two tables on the next slide illustrate the small differences in
  table totals when data is aggregated by geography.

• The sum of estimates for small areas that constitute a larger area
  may not exactly match data in an identical table for the larger
  area, but the differences are likely to be small.
   ➢ For example - total for local authority may not equal the sum of output
     areas within that local authority.
Geography
• Local authority total vs sum of aggregated output areas.
Ethnicity by occupation at local authority level
LA=1 Occupation
Ethnicity: 1 2 3 4 5 6 7 8 9
White 3885 6014 4325 5726 5202 4172 4394 4282 6784 44784
Mixed 27 55 64 44 47 53 70 34 70 464
For White ethnic group
Asian 198 357 134 168 171 135 292 233 294 1982
Black 23 93 42 49 34 76 44 38 97 496
category:
Chinese 23 40 11 6 25 15 23 15 33 191 - total for row at local
4156 6559 4576 5993 5479 4451 4823 4602 7278 47917 authority level is 44,784
- total for row in Output
Ethnicity by occupation at Output Area level aggregated to local authority level Area aggregation is 44,779
LA=1 Occupation
- Difference of 5 (0.015%)
Ethnicity: 1 2 3 4 5 6 7 8 9
White 3886 6012 4324 5730 5205 4171 4391 4276 6784 44779
Mixed 27 57 66 43 48 52 68 35 70 466
Asian 196 359 133 166 172 137 292 231 291 1977
Black 23 93 41 48 33 76 44 41 94 493
Chinese 22 40 11 5 25 15 24 15 32 189
4154 6561 4575 5992 5483 4451 4819 4598 7271 47904Variables • The next two tables illustrate the small differences in table totals that may occur when a common variable is cross-tabulated with another variable. • In multivariate tables, which share a common variable, there may be small differences in the row totals when cross-tabulated with other variables, but the differences are likely to be small. ➢ For example - age by ethnic group vs age by marital status.
Variables

     Age by ethnic group at local authority level
     LA=1
                N.A.           White          Mixed         Asian          Black         Chinese        Total:
     0-15                 89       10146              420           1179           233         107           12174
     16-24              568            6946           186            679           106             67            8552
     25-34                23           6895           145            822           158         106               8149
     35-45                 3           7810            87            581           178             57            8716
     45-54                 3           8378            83            393            96             34            8987
     55-64                 0           7518            37            227            29             20            7831
     65-74                 0           5612            15            111            26              8            5772   Small difference in
     75+                   0           4856            13             54            22              4            4949
                                                                                                                        totals
     Total:             686        58161              986           4046           848         403           65130

     Age by marital status at local authority level
     LA=1
                 Single         Married       Separated Divorced     Widowed    Total:
     0-15                12176              0           0          0          0                             12176
     16-24                8313           207           11         13          8                              8552
     25-34                5249          2439          241        199         20                              8148
     35-44                2886          4468          403        914         44                              8715
     45-54                1517          5355          432      1521         160                              8985
     55-64                 613          5312          223      1257         426                              7831
     65-74                 308          3769          105        659        930                              5771
     75+                   274          2030           38        251       2357                              4950
     Total:              31336         23580         1453      4814        3945                             65128
Guidance for users • ONS will publish guidance about the protection and checks on the data. • Users will be advised that data won’t always match in some tables and be reassured that the effects are minimal. • They will also see the guidance that mentions that any repeat of the same query always produces the exact same estimates.
Summary

• This presentation was intended to inform uses of the two main
  features associated with a flexible dissemination system for the
  2021 Census.

1) There could be greater detail in tables, but not for all areas.
2) Estimates may differ between similar tables for the same areas
   but these differences are not statistically significant.

• If you would like to provide feedback, please contact us at
  census.outputs@ons.gov.uk.
You can also read