EMPOWERING TRADERS TO CLAIM THEIR FINANCIAL EDGE - April 2022

Page created by Irene Gallagher
 
CONTINUE READING
EMPOWERING TRADERS TO CLAIM THEIR FINANCIAL EDGE - April 2022
EMPOWERING TRADERS TO CLAIM THEIR FINANCIAL EDGE

April 2022
EMPOWERING TRADERS TO CLAIM THEIR FINANCIAL EDGE - April 2022
Cautionary Statement Regarding Forward-Looking Statements
                     This communication contains forward-looking statements within the meaning of the Private Securities Litigation Reform Act of 1995, as amended, that reflect TradeStation’s
                     current views with respect to, among other things, the future operations and financial performance of TradeStation. Forward-looking statements in this communication may be
                     identified by the use of words such as “anticipating,” “believes,” “can,” “continue,” “continuously,” “enhance,” “expects,” “hope,” “in progress,” “intends,” “may,” “over time,” “planned,”
                     “seeks,” “should,” “strategic,” “target,” “think,” “try,” “try to,” “will” and similar terms and phrases. Forward-looking statements contained in this communication include, but are not
                     limited to, statements as to (i) TradeStation’s efforts regarding its revenue growth strategy, including the success of marketing expenditures and campaigns and approaches, and
                     its ability to grow its customer account base generally and the pace at which such growth is, or is not, accomplished, (ii) ongoing volume levels of customer trading activity and
                     trading-related revenue generated, (iii) the success, or lack thereof, of TradeStation’s crypto account-opening/marketing promotion, and whether crypto customer accounts
                     added through such promotion will provide further funding or deposits to, or trade in, such accounts, (iv) whether TradeStation’s planned product and service enhancements,
                     including those recently launched or currently in progress, will be considered valuable or attractive by customers and customer prospects, or completed timely, or at all, and (v)
                     whether federal funds target interest rates will continue to increase, and if so when, whether the effective interest rates will match the target rates, and whether TradeStation will
                     be able to benefit through increased net interest income if those rates continue to increase.

                     The forward-looking statements contained in this communication are based on the current expectations of TradeStation and its management and are subject to risks and
                     uncertainties. No assurance can be given that future developments affecting TradeStation will be those that are anticipated. Actual results may differ materially from current
                     expectations due to changes in global, regional or local economic, business, competitive, market, regulatory and other factors, many of which are beyond the control of
                     TradeStation. Should one or more of these risks or uncertainties materialize, or should any of the assumptions prove incorrect, actual results may vary in material respects from
                     those projected in these forward-looking statements. Factors that could cause actual results to differ may emerge from time to time, and it is not possible to predict all of them.

                     Any forward-looking statement made in this communication speaks only as of the date hereof. TradeStation undertakes no obligation to update, revise or review any forward-
                     looking statement, whether as a result of new information, future developments or otherwise, except as may be required by any applicable securities laws.

                  Trademarks, Trade Names and Service Marks

    Disclaimers      This presentation includes trademarks, trade names and service marks that are the property of their respective owners, and are protected under applicable intellectual property
                     laws.

                  Proposed Business Combination
                     As previously announced, TradeStation Group, Inc. (the “Company”) and Quantum FinTech Acquisition Corporation (“Quantum”) have entered into agreements to effect a business
                     combination (the “Business Combination”). This presentation does not constitute (i) a solicitation of a proxy, consent or authorization with respect to any securities or in respect of
                     the Business Combination or (ii) an offer to sell, a solicitation of an offer to buy, or a recommendation to purchase, any securities of the Company, Quantum, the combined
                     company or any of their respective affiliates. No offering of securities shall be made except by means of a prospectus meeting the requirements of Section 10 of the Securities Act
                     of 1933, as amended, or an exemption therefrom, nor shall any sale of securities in any states or jurisdictions in which such offer, solicitation or sale would be unlawful prior to
                     registration or qualification under the securities laws of any such jurisdiction be effected. No securities commission or securities regulatory authority in the United States or any
                     other jurisdiction has in any way passed upon the merits of the Business Combination or the accuracy or adequacy of this presentation.

                     In connection with the proposed Business Combination between the Company and Quantum, the Company has filed a registration statement on Form S-4 (the “Registration
                     Statement”) with the U.S. Securities and Exchange Commission (the “SEC”) that includes a proxy statement / prospectus relating to the offer of the securities to be issued by the
                     company. Investors, security holders and other interested persons are advised to read the Registration Statement and proxy statement / prospectus and any amendments
                     thereto, and other relevant documents that are filed with the SEC carefully and in their entirety because they will contain important information about the Company, Quantum
                     and the proposed Business Combination. The definitive proxy statement / prospectus will be mailed to stockholders of Quantum as of a record date to be established for voting on
                     the proposed Business Combination. Investors, security holders and other interested persons will also be able to obtain copies of the Registration Statement and other documents
                     containing important information about the Business Combination and the parties to the Business Combination once such documents are filed with the SEC, without charge, at
                     the SEC’s website at www.sec.gov, or by directing a request to: Quantum FinTech Acquisition Corp., 4221 W. Boy Scout Blvd., Suite 300, Tampa, FL 33607, Attention: Investor
                     Relations or by email at IR@qftacorp.com.

                     Quantum and the Company, their respective directors and executive officers and certain investors may be considered participants in the solicitation of proxies with respect to the
                     proposed Business Combination under the rules of the SEC. Information about the directors and executive officers of Quantum and their ownership is set forth in Quantum’s
                     filings with the SEC, including its final prospectus relating to its initial public offering in February 2021, which is available free of charge at the SEC’s website at www.sec.gov.
                     Additional information regarding the persons who may, under the rules of the SEC, be deemed participants in the solicitation of the Quantum shareholders in connection with the
1                    proposed Business Combination, including the Company’s directors and executive officers and certain investors, is contained in the Registration Statement for the Business
    1                Combination.
EMPOWERING TRADERS TO CLAIM THEIR FINANCIAL EDGE - April 2022
TradeStation At A Glance

                           226,000 +                                                               $12.0 Billion                                                            $209.6 Million
                  Total Customer Accounts(1)                                                      Total Customer Assets                                                            Annual Revenue

                                                           30-Year History of
                                              Helping Self-Directed Traders and Investors
                                                      Claim Their Financial Edge

                             Multi-Asset, Self-Clearing                                                                                     Award-Winning
                                    Brokerage Offering Equities, Options,                                                  Technology and Research Tools Accessible on
                                       Futures and Cryptocurrencies                                                           Mobile, Web, Desktop and Through API

2   (1) Included in “Total Customer Accounts” are approximately 42,900 customer crypto accounts opened through a marketing promotion that began December 20, 2021 in which TradeStation made the initial account funding on behalf of
          the customer (BTC equal to USD 10.00) and which had not had any account activity as of March 31, 2022. TradeStation expects to terminate this crypto account marketing promotion at the end of April 2022.
EMPOWERING TRADERS TO CLAIM THEIR FINANCIAL EDGE - April 2022
TradeStation is Well-Positioned to Benefit from Growth Opportunities

                                     1   Award-Winning Suite of Trader and Investor Products

                                            2       Expanding Customer Base of Experienced and New Traders

                                                3     Differentiated Positioning in the Market

                                            4       Strong Track Record of Account Growth

                                     5   Well-Defined Growth Accelerators

3
EMPOWERING TRADERS TO CLAIM THEIR FINANCIAL EDGE - April 2022
Product Suite Caters to a Broad Spectrum of Self-Directed Investors

           From highly active full-time traders requiringadvanced                                                                                                        …to self-directedretail investorslooking for
           charting and trading functionality…                                                                                                                           simplicity and ease of use

                                                                                                                                                                 TradeStationMobile &
                                                                                       TradeStation10 Desktop Platform                                                Mobile Apps

                                                                                             Advanced stocks, futures and                                       Stocks, futures, options and
                                                                                               options trading platform
                                                                                                                                                                 crypto trading on-the-go
                                                                                              with powerful tools to help
                                                                                                traders test, optimize,
                                                                                                monitor and automate
                                                                                              custom trading strategies

                                                                                                                                                                                                                                                         TradingView
                                                                                                                                                                                                                                                       (API Integration)
                      OptionStation Pro

         Options analytics trading platform                                                                                                                                                                                                      Stocks, ETFs, futures and crypto
    designed f or stock and index options traders                                                                                                                                                                                                     trading by accessing
                                                                                                                                                                                                                                                 TradeStation directly from the
                                                                                                                                                                                                                                                    TradingView community

                                                                                                                                                                                                                                           2022 Best Online Broker for
                                            Consistently Rated #1 or “Best
                                                                                                     Platform & Tools              Crypto Technology                   Active Trading                                                      Stock Trading Platform and
                                            in Class” StockBrokers.com
                                                                                                     Options Trading               Commissions & Fees                  Futures Trading                                                     Research in Nerd Wallet’s 2022
                                            Online Broker Review for:
                                                                                                                                                                                                                                           Best-of Awards

4   Note: The TradingView screen is owned by TradingView. TradingView is not a TradeStation company or affiliate. See page 10 for more detail regarding TradeStation’s third-party relationships that can generate account growth and revenue.
EMPOWERING TRADERS TO CLAIM THEIR FINANCIAL EDGE - April 2022
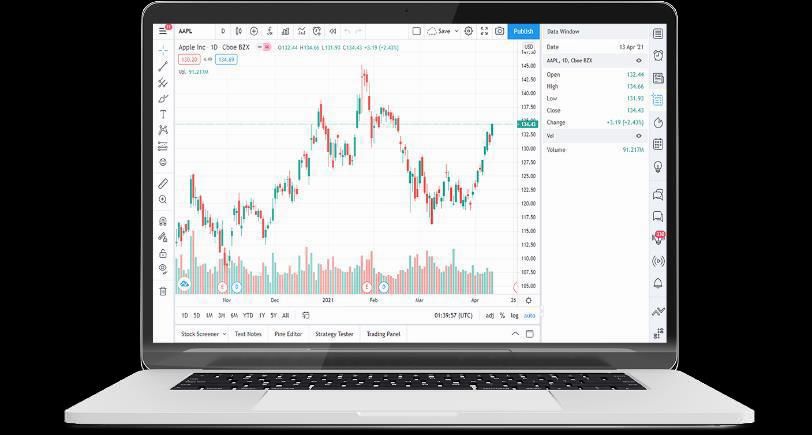
Feature-Rich Platform Designed to Attract Next Generation of Self-Directed Investors

    TradeStation is a go-to platform for active Newcomer growth accelerated                                                                                                                     Customer Age Mix
                                                                                                                                                                                             As a % of total customers
    individual traders looking for an edge      during COVID

                                                                                                                                                                                                                                 82.1%
                                                                                                                                                                                95.0%

     Baby Boomer / Gen-X (Born 1946-1980)                                                      Millennials / Gen-Z (Born after 1980)

    ◼   Average age: 49 years old                                                         ◼   Average age: 27 years old
    ◼   29-month average account tenure                                                   ◼   12-month average account tenure
    ◼   $621,000 average net worth                                                        ◼   $143,000 average net worth
                                                                                                                                                                                                                                 17.9%
    ◼   $28,000 average balance at TradeStation                                           ◼   $8,000 average balance at TradeStation
                                                                                                                                                                                 5.0%
    ◼   Heavy desktop platform use                                                        ◼   Attracted to mobile products and social
                                                                                                                                                              As of       March 31, 2019                                   March 31, 2022
                                                                                              platforms
                                                                                                                                                                         Baby Boomer/Gen X (Born 1946-1980)
                                                                                                                                                                         Millennials/Gen-Z (Born after 1980)

    Source: Based on client onboarding information and other company data. Data as of March 31, 2022

5   Note: This page contains forward-looking statements, which involve numerous risks and uncertainties. Actual results may differ materially from those described in or implied by any forward-looking statements. Please see Disclaimers on Page 1 of
    this presentation for additional information.
EMPOWERING TRADERS TO CLAIM THEIR FINANCIAL EDGE - April 2022
TradeStation Seeks to Capture Traders and Active Investors from Legacy
    and Challenger Brokers and can be a Bridge to the Traditional Asset Classes for Crypto Traders

                                                                                              Legacy                            Challenger                                                                     Crypto
                                                                                              Brokers                            Brokers                                                                     Exchanges
                                                                                        Traditional Investors,               Beginner Investors &                                                          Crypto Investors &
                                                                                          Traders, Advisors                       Traders                                                                       Traders

                 Cryptocurrency Trading

                 Self-Clears Stocks, Options, and Futures

                  Strategy Back-Testing & Automation

                  Advanced, Multi-Asset API Technology

                 Education & Social Community

6   Note: This page contains forward-looking statements, which involve numerous risks and uncertainties. Actual results may differ materially from those described in or implied by any forward-looking statements. Please see Disclaimers on Page 1 of
    this presentation for additional information.
EMPOWERING TRADERS TO CLAIM THEIR FINANCIAL EDGE - April 2022
Track Record of Account Growth Driven in Part From New Product and Feature Rollouts
    230
                                                                                                                                                                                                                        FYE 2022
    210    Average Total Customer                                                                                                                                                                                       ▪   Simplified Balance View
                                                                                                                                                                                                                        ▪   Crypto IRA                        203(2)
           Accounts(1)                                                                                                                                             FYE 2021                                             ▪   Crypto FIX API
           (in thousands)                                                                                                                                                                                               ▪   Enhanced Options API
                                                                                                                                                                   ▪   Crypto in Web API
    190                                                                                                                                                            ▪   Crypto Added to TradingView

                                                                                                                      FYE 2020                                                                                                                       170(2)
    170                                                                                                           ▪    Commission Free Trading
                                                                                                                  ▪    TradeStation Crypto                                                                                                 160
                                                                                                                  ▪    YouCanTrade
                                                                                                                  ▪    New Futures Options Platform
                                                                                                                                                                                                                             152
    150                                                         FYE 2019                                          ▪    TradingView Alliance
                                                                ▪   Web API                                       ▪    New TradeStation.com Website                                                           138
                                                                ▪   Fully Paid Lending                            ▪    Real-time Account Funding
                                                                ▪   Account Opening                               ▪    Data-Driven Marketing Mix                                                  129
    130        FYE 2018                                             Process Redesign
                                                                                                                                                                                      122
               ▪   Brand Refresh
               ▪   Simplified Pricing                                                                                                                                  113
               ▪   TradeStation 10
    110                                                                                                                                      103          104
                                                                                                                   98            102
                                                                                                      95
                                                                                        92
    90                                                                      88
                                                              83
                                                 79
                                    76
          70           73
    70

    50
          Q1          Q2          Q3            Q4           Q1           Q2            Q3           Q4            Q1           Q2           Q3           Q4            Q1           Q2           Q3           Q4            Q1           Q2             Q3      Q4

                            FYE 3/31/18                                       FYE 3/31/19                                        FYE 3/31/20                                      FYE 3/31/21                                             FYE 3/31/22
      (1) "Average Total Customer Accounts” for each fiscal quarter is calculated by adding the ending balance of total customer accounts for the last month of the prior fiscal quarter and the ending balance of total customer accounts for each of
      the three months of the fiscal quarter being measured and dividing the sum by four.

7     (2) Total Customer Accounts and Gross New Accounts at and for Q3 FYE 3/31/2022 included approximately 4,950, and at and for Q4 FYE 3/31/2022 included approximately 37,900, customer crypto accounts opened through a marketing
      promotion that began December 20, 2021 in which TradeStation makes the initial account funding (BTC equal to USD 10.00) and which had not had any account activity as of the end of those respective periods.
EMPOWERING TRADERS TO CLAIM THEIR FINANCIAL EDGE - April 2022
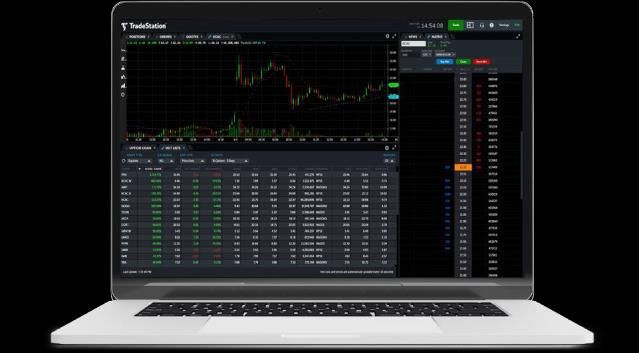
Core Brokerage Business Positioned to Scale

         Current Offering:                                                                                                                                              Gross Brokerage Revenue(1)
                                                                                                                                                                                          ($ in millions)
              ◼    Self-Clearing of Stocks, Options and Futures
              ◼    Award-Winning Trading and Analysis Tools                                                                                                                                    $199.7
                                                                                                                                                                                                                           $194.8
              ◼    Robust Middle and Back Office Brokerage
                                                                                                                                                                   $175.9
              ◼    Technology Platform that Provides Operating Leverage
              ◼    Track Record of Sustaining Heavy Volume

         Planned Initiatives to Further Accelerate Growth:

                                 Further Simplify User Experience

                                 Insights & Education

                                 Peer-to-Peer Community                                                                                                                            Fiscal years ended March 31,
                                                                                                                                                                    2020                        2021                        2022

    (1) “Gross Brokerage Revenue” includes trading-related revenue and net interest income in respect of equities (including equity options) and futures customer brokerage accounts and transactions.
8   Note: This page contains forward-looking statements, which involve numerous risks and uncertainties. Actual results may differ materially from those described in or implied by any forward-looking statements. Please see Disclaimers on Page 1 of
    this presentation for additional information.
EMPOWERING TRADERS TO CLAIM THEIR FINANCIAL EDGE - April 2022
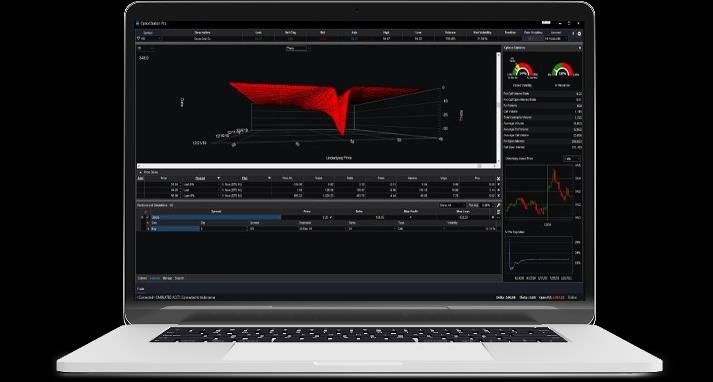
Robust Crypto Offering Poised for Growth

           Current Crypto Offering:                                                                                                                                Crypto Accounts Have Grown Rapidly(1)
          ◼   Bitcoin, Bitcoin Cash, Ethereum, Litecoin, USDC Stable Coin
                                                                                                                                                                                                                                   56,549
          ◼   Support for Self-Directed IRA Accounts
          ◼   Multiple Liquidity Sources Aggregated into One Feed
          ◼   Transparent Pricing
          ◼   Powerful Trading Tools

          Planned Initiatives to Further Accelerate Growth:                                                                                                                                                                         42,916

                               Native Integration with TradeStation
                                                                                                                                                                                                                   16,213

                                                                                                                                                                                                                   4,950
                                                                                                                                                                                7,897             9,218
                               New Cryptocurrencies
                                                                                                                                                             5,179                                                                  13,633
                                                                                                                                                                                                                   11,263

                                                                                                                                                                                                   As of
                                                                                                                                                            Mar '21           Jun '21           Sep '21          Dec '21           Mar '22
                               Further Expansion to Non-U.S. Customers

                                                                                                                                                                           New Accounts               Crypto Promotion
                                                                                                                                                                                                       Activity Pending(1)

    (1) The 4,950 and 42,916 numbers in the lighter-shaded parts of the columns for Dec ’21 and March ’22 represent, as of the end of those respective quarterly periods, the customer crypto accounts opened through a marketing promotion that began
    December 20, 2021 in which TradeStation made the initial account funding on behalf of the customer (BTC equal to USD 10.00) and which had not had any further account activity as of the end of those respective periods.
9   Note: This page contains forward-looking statements, which involve numerous risks and uncertainties. Actual results may differ materially from those described in or implied by any forward-looking statements. Please see Disclaimers on Page 1 of
    this presentation for additional information.
Expand Third-Party Relationships That Can Generate Account Growth and Revenue

      Current API-Centered Offerings:
     ◼   Brokerage services provider for Brokerage-as-a-Service (“BaaS”) Model

     ◼   Execution, Clearing, Settlement and Custody

     ◼   Equities, Options, Futures, Futures Options and Crypto
     ◼   FIX and Web APIs for Market Data and Execution

      Third-Party Relationship Categories:
     ◼   FinTechs
     ◼   Equities & Futures Introducing Brokers
     ◼   Crypto Brokers & Exchanges
     ◼   Referral-Centered Relationships

      Planned Initiatives to Further Accelerate Growth:

                    Account Opening and Cash Management via API

                    Customer Self-Service via API

                    BaaS Portal for Relationship Management
                    with BaaS provider

     Note: Third-party relationships that can generate account growth and revenue are business arrangements with third parties created by commercial contracts, and are not partnerships, joint ventures or any similar type of agency relationship or
     business combination. These may include (i) API-centered arrangements that enable third-party platforms to access TradeStation’s brokerage services and back-office systems, (ii) API-centered arrangements that enable TradeStation to access or be
     integrated with third-party platforms and back-office systems (such as other brokerage firms to which TradeStation licenses or makes available its platform) and (iii) customer lead referral-centered arrangements.

10   Note: This page contains forward-looking statements, which involve numerous risks and uncertainties. Actual results may differ materially from those described in or implied by any forward-looking statements. Please see Disclaimers on Page 1 of
     this presentation for additional information.
RECENT OPERATING AND
FINANCIAL HIGHLIGHTS
Three Months and Fiscal Year Ended March 31, 2022
Total Customer Accounts Exceed 226,000(1) as TradeStation Executes Growth Strategy

     Customer Metrics                                                                                                                         Total Customer Accounts, Total Customer Assets and
     ◼         Total Customer Accounts(1) of 226,506 as of March 31, 2022,                                                         $240                      Total Customer Cash             226.5                                               $20.0
               representing 55.3% year-over-year growth
                   Total Customer Accounts grew by 25.8% year over year when excluding                                             $200
               ▪                                                                                                                                                                                              178.9
                   crypto account-opening promotion accounts                                                                                                                              162.8                                                  $15.0
                                                                                                                                                                      157.0                                   $12.3
                                                                                                                                   $160          145.9                                                                             $12.0
                                                                                                                                                                      $11.4                $11.3
     ◼         62,787 Gross New                Accounts(1)
                                             added during the fiscal fourth                                                                     $10.3
               quarter, a year-over-year increase of 130%                                                                          $120                                                                                                          $10.0
               ▪    Rate of Gross New Accounts added declined by 11.3% year over year when
                    excluding crypto account-opening promotion accounts                                                             $80
                                                                                                                                                                                                                                                 $5.0
                                                                                                                                                  $2.8                $2.9                 $2.9               $3.0                     $2.9
     ◼         Total Customer Assets increased by 16.4% year over year to                                                           $40
               $12.0 billion
                                                                                                                                     $0                                                                                                          $0.0
                                                                                                                                                                                   (As of period end)
     ◼         Total Customer Cash increased by 4.0% year over year to $2.9                                                                    March ‘21             June ‘21              Sep ‘21            Dec ‘21            March ‘22
               billion
                                                                                                                                          Total Customer Accounts                  Total Customer Assets                  Total Customer Cash
                                                                                                                                          (In thousands)                        ($, billions)                          ($, billions)

         (1)       Total Customer Accounts and Gross New Accounts at and for Q3 FYE 3/31/2022 included approximately 4,950, and at and for Q4 FYE 3/31/2022 included approximately 37,900, customer crypto accounts opened through a marketing

12                 promotion that began December 20, 2021 in which TradeStation makes the initial account funding (BTC equal to USD 10.00) and which had not had any account activity as of the end of those respective periods.
Increased Options and Futures Trading Highlights TradeStation’s Versatile Platform

     DARTs                                                                                                                                              DARTs and VIX Closing Average

     ◼   Daily Average Revenue Trades (DARTs) of 237,694 declined by                                                                320.0                                                                               40
         14.2% year over year                                                                                                                277.0
                                                                                                                                    280.0                                                                               35
         ▪   Equities DARTs declined by almost 30% due to comparison to prior-year elevated                                                                                                                  237.7
             activities during COVID-19                                                                                             240.0                     214.5                           214.7                     30
                                                                                                                                                                              203.3                          25.4
         ▪   Average VIX of 25.4 was 9% higher than prior-year average of 23.2
                                                                                                                                    200.0                                                                               25
         ▪   Options trading increased by 21.5% and futures trading by 14.6% year over year,                                                                                                  19.3
                                                                                                                                             23.2             18.0             18.3
             highlighting TradeStation’s multi-asset platform                                                                       160.0                                                                               20

                                                                                                                                    120.0                                                                               15
     ◼   DARTs increased by 10.7% quarter over quarter
                                                                                                                                     80.0                                                                               10
         ▪   Futures trading increased by 24.8%, options by 17.3% quarter over quarter
         ▪   Equities increased slightly                                                                                             40.0                                                                               5
         ▪   Average VIX increased 31.7% quarter over quarter to 25.4                                                                 0.0                                                                               -
                                                                                                                                                                          Three months ended,
                                                                                                                                            Mar ‘21         June ‘21          Sep ‘21        Dec ‘21        Mar ‘22

                                                                                                                                                            Total DARTs               VIX Closing Average
                                                                                                                                                         (In thousands)

                                                                                                                                            31-Dec-20       31-Mar-21        30-Jun-21       31-Sep-21      31-Dec-21

     Year over year compares results for the three months ended March 31, 2022 to the three months ended March 31, 2021.
13   Quarter over quarter compares results for the three months ended March 31, 2022 to the three months ended December 31, 2021.
Prior-Year Trading Levels Impacts Fourth Quarter Comparisons

                                                                                                                                                                  Revenue Source
                                                                                                                                                                            ($, millions)
                                                                                                                         $70.0         $65.0
     Total Net Revenues
         Decreased by 19.1% year over year                                                                               $60.0                    $2.4                                              $53.9
     ◼                                                                                                                                 $10.9             $52.8                                                         $52.6
                                                                                                                                                                                $50.4
         ▪   Trading-related revenue decreased by 14.8%                                                                   $50.0                                                                                $1.1     $10.1
                                                                                                                                                          $10.7
                                                                                                                                                                     $1.6
                                                                                                                                                                                            $1.6
                                                                                                                                                                                                     $11.3
         ▪   Net interest income decreased by 7.9%                                                                                                                               $9.3
                                                                                                                         $40.0

     ◼   Decreased by 2.3% quarter over quarter                                                                           $30.0
                                                                                                                                       $51.7
         ▪   Trading-related revenue increased by 6.3%                                                                                                                                              $41.5              $44.1
                                                                                                                          $20.0                           $40.3                 $39.5
         ▪   Net-interest income decreased by 10.8%
                                                                                                                          $10.0
                                                                                                                                                                                                                                  $(1.5)
                                                                                                                             $-
                                                                                                                                      31-Mar-21          30-Jun-21
                                                                                                                                                                     Three 30-Sep-21
                                                                                                                                                                           months ended,           31-Dec-21          31-Mar-22

                                                                                                                         $(10.0)      Mar ‘21             Jun ‘21              Sep ‘21             Dec ‘21            Mar ‘22

                                                                                                                                    Trading-Related Revenue       Net-Interest Income          Subscription and Other Revenue

     Year over year compares results for the three months ended March 31, 2022 to the three months ended March 31, 2021.
14   Quarter over quarter compares results for the three months ended March 31, 2022 to the three months ended December 31, 2021.
Trading-Related Revenue Declines YoY on Lower DARTs, Volatility

                                                                                                                                                       Trading Related Revenue

                                                                                                                                      $51.7
                                                                                                                                      $3.0                         ($, millions)
                                                                                                                                                                                                              $44.1
     Trading-Related Revenue                                                                                                                         $40.3
                                                                                                                                                                                         $41.5
                                                                                                                                                                       $39.5                                  $2.9
     ◼   Decreased by 14.8% year over year                                                                                            $16.6
                                                                                                                                                      $2.5
                                                                                                                                                                                         $2.6
                                                                                                                                                                        $2.4
           ▪    Trading lower due to high prior-year comps related to elevated
                levels during COVID-19 pandemic, offset by account growth and                                                                                                                                 $14.2
                increased futures trading activity                                                                                                    $13.2                              $13.8
                                                                                                                                                                        $13.0

     ◼   Increased by 6.3% quarter over quarter
           ▪    Growth driven by increase in customer accounts, DARTs and
                trading mix toward options and futures                                                                                $32.2
           ▪    VIX elevated during quarter                                                                                                           $24.6             $24.1            $25.1                $27.0

                                                                                                                                                                Three months ended,
                                                                                                                                    Mar ‘21          June ‘21          Sep ‘21          Dec ‘21               Mar ‘22

                                                                                                                                       Commissions     Payment for Order Flow      Account and Service Fees

     Year over year compares results for the three months ended March 31, 2022 to the three months ended March 31, 2021.
15   Quarter over quarter compares results for the three months ended March 31, 2022 to the three months ended December 31, 2021.
Net Interest Income Expected to Benefit from Rising-Rate Environment

                                                                                                                                                                           Net Interest Income
                                                                                                                                                                                      ($, millions)
                                                                                                                          $12                                                                                     $11.3
                                                                                                                                         $10.9                    $10.7
                                                                                                                                                                                                                  $1.1                    $10.1
     Net Interest Income                                                                                                  $10             $1.5                    $1.3                    $9.3                                            $0.7
     ◼   Net interest income decreased by 7.9% year over year
                                                                                                                                                                                          $0.4
             ▪    Lower crypto lending as well as lower interest earned on total customer
                  cash and lower margin lending revenue                                                                     $8
                                                                                                                                          $3.3                                                                    $4.6
             ▪    Securities lending increased year over year                                                                                                     $4.0                                                                    $3.8
                                                                                                                                                                                          $3.5

                                                                                                                            $6
             ▪    Net interest income decreased by 10.8% quarter over quarter
             ▪    Lower crypto lending, securities lending and margin lending
                                                                                                                                          $3.0
             ▪    Interest income on total customer cash increased                                                          $4                                                                                                            $2.8
                                                                                                                                                                  $3.1                    $3.1                    $3.2

     ◼   Rising fed fund rates should benefit net interest income
                                                                                                                            $2
         ▪   Based on current Total Customer Cash balances, each 25-basis point                                                           $3.1
             increase to fed fund rates could increase interest income earned on                                                                                  $2.3                    $2.3                    $2.4                    $2.8
             customer cash balances by up to approximately $7.0 to $7.5 million
             annualized(1)                                                                                                  $0
                                                                                                                                                                                Three months ended,
                                                                                                                                      31-Mar-21               30-Jun-21
                                                                                                                                                                Jun ‘21
                                                                                                                                                                                      30-Sep-21
                                                                                                                                                                                        Sep ‘21
                                                                                                                                                                                                              31-Dec-21
                                                                                                                                                                                                                Dec ‘21
                                                                                                                                                                                                                                      31-Mar-22
                                                                                                                                                                                                                                        Mar ‘22
                                                                                                                                        Mar ‘21
                                                                                                                                 Total Customer Cash              Margin Lending               Securites Lending                Crypto Lending

     Year over year compares results for the three months ended March 31, 2022 to the three months ended March 31, 2021.
     Quarter over quarter compares results for the three months ended March 31, 2022 to the three months ended December 31, 2021.

16   Note: This page contains forward-looking statements, which involve numerous risks and uncertainties. Actual results may differ materially from those described in or implied by any forward-looking statements. Please see Disclaimers on Page 1 of
     this presentation for additional information.
Increased Spending Aligned with Execution of Growth Strategy

                                                                                                                                                                                Expenses
                                                                                                                                                                                                         $69.5        $68.7
                                                                                                                               $70
                                                                                                                                                                                 ($, millions)
                                                                                                                                                                                                         $5.7          $6.0
     Expenses
                                                                                                                               $60                               $54.7             $55.7                 $8.2
                                                                                                                                                                                                                       $11.4
     ◼   Increased by 78.1% year over year                                                                                                                        $5.6              $5.7                 $8.2
                                                                                                                               $50
           ▪    Marketing expense increased 233% as TradeStation invested in brand                                                             $38.6                               $7.8                                $10.2
                                                                                                                                                                 $13.6
                awareness and performance-based marketing as part of growth strategy                                           $40
                                                                                                                                                $5.6                               $8.4
           ▪    Employee compensation and benefits expense increased 8.4%, driven by                                                                                                                     $24.7
                headcount growth to support product enhancement and operations                                                                  $9.1              $8.6
                                                                                                                               $30                                                                                    $23.0

                                                                                                                                                                                   $22.7
     ◼   Decreased by 1.2% quarter over quarter                                                                                $20
                                                                                                                                               $21.2             $21.2
           ▪    Marketing expense decreased 20.1%, due in part to increased spending in
                                                                                                                               $10                                                                       $22.7
                fiscal third quarter that had been planned for fourth quarter, as well as                                                                                                                              $18.1
                efforts to improve account acquisition cost efficiencies                                                                                                           $11.2
                                                                                                                                                $5.4              $5.7
           ▪    Employee compensation and benefits decreased 6.7% due to increased                                                  $0
                capitalization rate and lower employee expense accruals partially offset by                                                    -$2.7
                                                                                                                                                                           Three months ended,
                headcount growth                                                                                              -$10
                                                                                                                                               Mar ‘21           Jun ‘21           Sep ‘21               Dec ‘21      Mar ‘22
                                                                                                                                          Marketing                                        Employee Compensation and Benefits
                                                                                                                                                                                                   (1)
                                                                                                                                          Cost of Services Provided                        Other
                                                                                                                                          Interest, Depr & Amort
                                                                                                                                    (1)   Other includes Communications, Professional Services, Occupancy and Equipment, and Other
                                                                                                                                          Expense (Income).

     Year over year compares results for the three months ended March 31, 2022 to the three months ended March 31, 2021.
17   Quarter over quarter compares results for the three months ended March 31, 2022 to the three months ended December 31, 2021.
Appendix
Operating Metrics
                                                                                                                                                                           Operating Metrics Definitions:
                                                                                                                                                                           Total Customer Accounts is the number of customer brokerage accounts
                                                                                                                                                                           with a positive account balance at the end of the period presented.

                                                                   As of March 31,                                                                                         Total Customer Assets is total cash and assets held in customer brokerage
                                                             2022                        2021                                                                              accounts at the end of the period presented.
      Total Customer
                                                                                                                                                                           Total Customer Cash is the aggregate cash held in
      Accounts(1)                                          226,506                     145,887
                                                                                                                                                                           customer brokerage accounts (equities and futures accounts – no cash is
      (in thousands)
                                                                                                                                                                           held in customer cryptocurrency accounts) at the end of the period
                                                                                                                                                                           presented.
      Total Customer Assets
      ($, billions)                                          $12.0                       $10.3                                                                             Daily Average Revenue Trades (DARTs) means daily average revenue trades
                                                                                                                                                                           made by customers. A revenue trade means one completed customer
      Total Customer Cash                                                                                                                                                  equities, options, futures, or crypto trade, regardless of the number of
                                                             $2.9                        $2.8
      ($, billions)                                                                                                                                                        shares, contracts, or units included in such trade, and includes trades
                                                                                                                                                                           completed under TradeStation’s “zero commission” plans (which are
                                                                                                                                                                           supported by payment-for-order-flow revenue). Each “side” of a futures
                                                                                                                                                                           trade is counted as one revenue trade. Partial fills of an equities order on
                                                                                                                                                                           the same day are aggregated and counted as one revenue trade. DARTs
                                                                                                                                                                           are calculated by dividing the total number of revenue trades in the period
                                                                                                                                                                           presented by the total number of “Trading Days” in the period
                                                             Three Months Ended                                            Fiscal Year Ended
                                                                                                                                                                           presented. A “Trading Day” means each day during the period presented
                                                                  March 31,                                                    March 31,
                                                                                                                                                                           that trading is open on NYSE and Nasdaq markets. A day on which such
                                                             2022                        2021                            2022                        2021                  markets close early, such as the Friday after Thanksgiving, is counted as
                                                                                                                                                                           half a day. DARTs is a general indicator, as each of the asset classes
      Daily Average Revenue                                                                                                                                                TradeStation offers has a different fee structure and level of profitability.
      Trades (DARTs)                                         237.7                      277.0                            217.4                      229.8
      (in thousands)                                                                                                                                                       Gross New Accounts is the total number of approved customer brokerage
                                                                                                                                                                           accounts funded during the period presented, and includes accounts
      Gross New         Accounts(1)
                                                             62.8                        27.3                            129.3                        79.1                 funded during the period presented that were opened and approved (but
      (in thousands)
                                                                                                                                                                           not funded) in a prior period, as well as accounts that were opened and
                                                                                                                                                                           funded in a prior period, but then went to a zero balance and were
                                                                                                                                                                           subtracted from Total Customer Accounts, but then were again funded
                                                                                                                                                                           during the period presented.

19   (1) Total Customer Accounts and Gross New Accounts at and for Q3 FYE 3/31/2022 included approximately 4,950, and at and for Q4 FYE 3/31/2022 included approximately
         37,900, customer crypto accounts opened through a marketing promotion that began December 20, 2021 in which TradeStation makes the initial account funding (BTC
         equal to USD 10.00) and which had not had any account activity as of the end of those respective periods.
How TradeStation Generates Revenue

                                                                                                                                                 Net Revenues
                                                                                                                                                 (% of Total Revenue)

        Trading-Related Revenue
                                                                                                                                                                    4%                 1%
     Includes brokerage commissions received on equities, futures and options trading; commissions                                          5%
                                                                                                                                                          18%              20%
     received on cryptocurrency trading; services fees; other customer fees and charges; and payments for
     order flow                                                                                                                  35%

        Net Interest Income
     Includes net interest income from securities lending, cryptocurrency lending, margin lending and                                                    78%               79%
     investment returns from customer cash in custody and TradeStation assets
                                                                                                                                60%

        Subscription and Other Revenue
     Includes subscriptions, B2B platform license royalties, development and technology support services                      FYE 3/31/20             FYE 3/31/21        FYE 3/31/22
     provided to Monex and other miscellaneous revenues                                                     Net Revenue:       $189                     $219               $210
                                                                                                            ($ in millions)

20
Condensed Income Statement (GAAP)

                                                                                         Three Months Ended March 31,                              Fiscal Year Ended March 31,

             ($, thousands)                                                                  2022                               2021                 2022               2021
                                                                                                          (unaudited)                             (unaudited)
             Trading-related revenue
                                                                                                     $44,087                           $51,748            $165,421          $170,046
             Net interest income
                                                                                                       10,073                           10,937             41,344                39,835
             Subscription and other revenue
                                                                                                        (1,548)                          2,322              2,854                 8,771
             Total Net Revenues
                                                                                                      $52,612                          $65,007           $209,619           $218,652
             Employee compensation and benefits
                                                                                                       23,036                           21,246             91,664                74,297
             Cost of services provided
                                                                                                        10,160                           9,054             35,345                33,493
             Marketing
                                                                                                        18,138                           5,446             57,733                17,395
             Other(1)
                                                                                                        10,416                           8,910             42,374                33,951
             Interest, depreciation & amortization
                                                                                                         6,982                          (6,065)            21,603                26,883
             Total Expenses
                                                                                                      68,732                            38,591           248,719               186,019
             Income (Loss) Before Income Taxes
                                                                                                      (16,120)                          26,416            (39,100)               32,633
             Income Taxes (Benefit)
                                                                                                        (1,369)                          7,149            (7,406)                8,843
             Net Income (Loss)
                                                                                                    ($14,751)                          $19,267           ($31,694)          $23,790

             (1)   Other includes Communications, Professional Services, Occupancy and Equipment, and Other Expense (Income).

21
EMPOWERING TRADERS TO CLAIM THEIR FINANCIAL EDGE

April 2022
You can also read