Energy sanctions against Russia: What options does the EU have and how costly are they? - 20th Anniversary of the Germán Bernácer Prize From ...
←
→
Page content transcription
If your browser does not render page correctly, please read the page content below

Energy sanctions against Russia:
What options does the EU have and how costly are they?

 Benjamin Moll

 20th Anniversary of the Germán Bernácer Prize
 From Covid-19 to the war in Ukraine:
 EU’s macroeconomic policies in times of disruption

 May 25, 2022

What if . . . ? The Economic Effects for Germany of a Stop of
 Energy Imports from Russia

 Bachmann, Baqaee, Bayer, Kuhn, Löschel, Moll, Peichl, Pittel, Schularick
 (heavily building on work by the late Emmanuel Farhi with David Baqaee)

 March 7, 2022
Energy Sanctions Roadmap: Recommendations for Sanctions
 against the Russian Federation

 The International Working Group on Russian Sanctions
 https://fsi.stanford.edu/working-group-sanctions

 May 9, 2022
The need for energy sanctions against Russia
▶ Russia’s economy and budget are underpinned by revenues from the sale of oil and
 gas, primarily to Europe.

▶ Since the start of the war, EU has paid the Kremlin around $800 million daily to
 import Russian oil and gas

▶ These payments finance Putin’s war against Ukraine (either directly or indirectly)
 ▶ see e.g. work by Sergei Guriev and Oleg Itskhoki

▶ Needed: immediate European action to
 1. reduce Russia’s oil and gas revenues rapidly
 2. combined with longer-term actions to eliminate Russian oil and gas sales to Europe
 and the Russian threat to European energy security

 1 / 21
Oil embargo and other policy options

European Commission, May 4: complete import ban on all Russian oil in 3-6 months

Problems:
 ▶ severe political resistance from Hungary etc
 ▶ 3-6 months is too slow
 ▶ announced embargo may have counterproductive effect: increase short-run
 demand for Russian oil and hence its price

⇒ complement or substitute with other policies

 2 / 21
Some excerpts from “Energy Sanctions Roadmap” paper
See https://drive.google.com/file/d/1FP3R-jMvO5zw5Jin8L8LTWqRLAQIhbgJ/view

 1. Tax on the sellers of Russian energy into Europe, separate rates for oil and gas

 2. Escrow regime to capture the balance of Russian export earnings

 3. European gas negotiator to counter Putin’s divide-and-conquer strategy (rubles)

 4. another promising policy idea: if keep announced embargo, complement with price
 cap (Johnson and Rachel)
 https://www.latimes.com/opinion/story/2022-05-09/european-union-embargo-imports-russian-oil-price-cap

My personal opinion: really doing pretty much anything is better than doing nothing!

 3 / 21
Cost of sanctions: “What if...?" paper
Assess economic consequences for Germany of cut-off from Russian energy imports
 ▶ either embargo by Germany/EU
 ▶ or stop of deliveries by Russia

Worst-case scenario of cold turkey complete import stop
 ▶ arguably bounds other scenarios, say tariff
 ▶ less extreme policies may trigger full stop by Russia

Get sense of rough magnitudes of economic losses relative to “do nothing” baseline
 1. Small GDP decline, say 0.5-1%, perhaps not even a recession?
 2. Like Covid = 4.5% decline in German GDP?
 3. Like Spain or Portugal during Euro crisis (5.1% & 7%)?
 4. “Mass unemployment and poverty” (Habeck), “millions of lost jobs” (Scholz)
 So perhaps like Great Depression? 4 / 21
Takeaways
Economic losses relative to “do nothing” baseline?

 1. Small GDP decline, say 0.5-1%, perhaps not even a recession?

 2. Like Covid = 4.5% decline in German GDP?

 3. Like Spain or Portugal during Euro crisis (5.1% & 7%)?

 4. “Mass unemployment and poverty” (Habeck), “millions of lost jobs” (Scholz)
 So perhaps like Great Depression?

Headline numbers: GDP decline between 0.5% and 3%

Takeaway: Import stop likely somewhat less severe than Covid recession

 5 / 21
Really a paper about gas not oil

▶ Elephant in room in Germany

▶ Will talk about oil at end

▶ Related historical episode: Chile cut off from Argentinean gas in 2007
 https://www.project-syndicate.org/commentary/
 russian-gas-chiles-lessons-for-germany-europe-by-andres-velasco-and-marcelo-tokman-2022-04?

▶ Also not a paper about inflation, though will also talk about it at the end

 6 / 21
German primary energy usage

 Oil Gas Coal Nuclear Renew. Rest Total
 TWh 1077 905 606 209 545 45 3387
 % 31.8 26.7 17.9 6.2 16.1 1.3 100

 of which Russia 34% 55% 26% 0% 0% 0% 30%

Oil and coal have global market (+ a strategic reserve)

Gas much trickier due to pipeline network, small LNG supplies ⇒ focus on gas

 7 / 21
Size of the gas shock
Lose 55% of gas but some substitution possible (Bruegel, 2022, and others)
 ▶ Relevant time horizon: roughly until next winter (seasonality of gas demand)
 ▶ Increase gas imports from NOR, NL,...
 ▶ Substitute some gas in electricity generation (lignite, hard coal, nuclear)
 ▶ Lose 55% of gas, import or substitute 25% ⇒ gas ↓ 30%
 ▶ ⇒ energy shock: gas ↓ 30% or equivalently energy (gas+oil+coal) ↓ 8%

German government report on May 1: in mid April dependence on Russian
 ▶ gas down to 35% (from 55%), oil down to 12% (from 35%), coal down to 8%
 https://www.bmwk.de/Redaktion/DE/Downloads/Energie/0501_fortschrittsbericht_energiesicherheit.html

Right in line with our assumptions, arguably faster:
 ▶ still lots of time until next winter (= our time horizon for substitution)
 ▶ still room for substituting gas in electricity generation (12% of total)
 8 / 21
Some Facts about German Economy
 1. Consumption of gas, oil and coal: 4% of GDP

 2. Imports of gas, oil and coal: 2.5% of GDP

 3. Consumption of gas (also = imports): 1% of GDP

 4. Gas usage and economic importance of broad economic sectors

 Households Industry Services, T&C Electricity Gen. Other
 Gas usage (%) 30.8 36.9 12.8 12.6 6.9
 Employment (%) 22.6 72.8 0.6 2.9
 Gross Value Added (%) 25.9 69.7 2.2 2.3
Sources: BDEW (2021) and Eurostat (2020)
https://ec.europa.eu/eurostat/databrowser/view/NAMA_10_A64_E__custom_2410757/default/table?lang=en
https://ec.europa.eu/eurostat/databrowser/view/NAMA_10_A64__custom_2410837/default/table?lang=en

Numbers in 1.-3. small. But energy = critical input ⇒ amplification important.
 9 / 21
Macro models
 ▶ Starting from facts, map energy shock into GDP losses using macro models
 ▶ e.g. recall gas ≈ 1% of GDP, gas shock = −30%
 ▶ Two extreme non-sensical calculations that are inconsistent with data
 ▶ GDP loss = 1% × −30% = −0.3%
 ▶ no substitutability whatsoever: GDP falls one for one with gas, i.e. −30%
 ▶ Our results: large amplification rel. to naive 0.3% calc but by factor of 10 not 100

Simplest model: CES production function
 [ 1 σ −1 1
 ] σ
 σ −1 σ −1
 Y = (1 − α) σ F (K , L) σ + α σ Gas σ

 ▶ Key parameters: elasticity of substitution σ, gas share α
 ▶ Two extreme cases above are Cobb-Douglas, σ = 1, and Leontief, σ = 0
 10 / 21
Richer models with supply chains and trade (Baqaee-Farhi)
 ▶ Complex production network, i.e. supply chains/production cascades
 ⇒ allows for spill-overs and increased damages
 ▶ Multi-country ⇒ substitution via imports possible, e.g. import energy-intense
 products instead of energy (e.g. basic chemicals, raw metals)

 11 / 21
The Numbers

 Baqaee- Baqaee- Simplest model Simplest model
 Farhi Farhi
 suff. statistic simulation 10% energy ↓ 30% gas ↓

GNE Loss, in %
Other Studies Estimates of the economic consequences of an intensification of the conflict – excerpt from the updated Economic Outlook March 2022 TABLE 3 Selected scenarios on the consequences of an intensification of the conflict for the economic outlook GDP- Additio- Institution Scenario Assumptions deduc- nal infla- Region tion1 tion1 Effects relative to a baseline scenario incorporating the state of the conflict and sanctions at time of publication Deutsche Bank Research2 Negative scenario with a temporary import stop of Sharply higher energy prices (Oil 140 US-$/barrel; natu- 1.5 1–1.5 Germany Table from excellent review by German Coun- natural gas and oil from Russia ral gas 150 €/MWh) ECB2 Adverse scenario Sharp temporary increase of natural gas prices and 1.2 0.8 Euro area cil of Economic Experts increase of oil prices ECB2 Severe scenario Sharper and longer increase 1.4 2.0 Euro area 2 of natural gas and oil prices; strong second round effects Our review with additional studies: Oxford Economics Stop of Russian natural gas Oil price between 100 and 1.5 2.6 Euro area imports for 6 months 115 US-$/barrel, natural https://benjaminmoll.com/RussianGas_Literature/ gas price at 190 €/MWh Goldman Sachs2 Stop of russian natural gas imports 2.2 – Euro area Effects relative to a baseline scenario not incorporating the state of the conflict and sanctions at time of publication EcoAustria2 Increase of natural gas Natural gas price of 172 €/ 1.3 – Austria (Köppl- Turyna et al.) prices and stop of exports to Russia MWh and no exports to Russia and to Ukraine Summary: no single study has found NIESR2 Oil price at 140 US-$/barrel 0.8 2.5 Euro area ▶ GDP deviation > 5.3% (Liadze et al.) higher public spending Estimates of Bachmann et al. (2022) Bachmann et al.3 Cessation of trade between Introduction of trade barriers 0.2–0.3 – Germany Russia and the EU in the model of Baqaee and Farhi (2021), which lead to a stop of all imports from Russia to the EU ▶ recession with GDP drop > 2.5% Bachmann et al.4 Stop of Russian natural gas 30 % decline of natural gas 2.2 – Germany imports imports; elasticity of subs- titution between natural gas and other inputs of 0.1 Bachmann et al.5 Stop of Russian energy 30 % decline of energy 1.4 – Germany imports imports; change of the cost share of energy imports in the GNE by 5 percentage points to 7.5 % 1 – In percentage points relative to the baseline. 2 – Deduction or addition for the year 2022. 3 – The estimate based on the trade model of Baqaee and Farhi (2021) compares two different long run equilibria with different 13 / 21
Alternativszenario – Methodenbeschreibung

 Milliarden Kubikmet
 10

 Die Spannbreite der Ergebnisse zeigt allerdings, dass es auch zu Engpässen bei den nichtindustriellen

 Gemeinschaftsdiagnose (main econ institutes joint analysis)
 5
 Verbrauchern kommen kann und dass die Industrie in Extremfällen kein Erdgas bekommen würde. Ein
 solcher Fall tritt aber in weniger als einem Viertel der Simulationsläufe ein. Gleichzeitig zeigt die
 0
 Simulation, dass eine Angebotserweiterung und die Realisierung des Einsparpotentials auf der
 Nachfrageseite einen Erdgasmangel in der Industrie in günstigen Fällen vermeiden können.
 -5
 Die Institute unterstellen, dass der Effekt der Erdgasverknappung auf die erdgasintensiven Bereiche im
 -10 Produzierenden Gewerbe von den Erdgasanteilen am Endenergieverbrauch eines Wirtschaftsbereichs
 Apr Mai Jun Jul Aug Sep Okt Nov Dez Jan Feb Mrz Apr Mai Jun Jul Aug Sep Okt Nov Dez
 abhängt (vgl. Tabelle 2). Als erdgasintensiv gilt eine Branche, wenn mindestens 25% des Endenergie-
 22 22 22 22 22 22 22 22 22 23 23 23 23 23 23 23 23 23 23 23 23

 Full-blown macro analysis, including detailled modeling of energy sector, gas storage
d Prognose der Deutschen Wirtschaft
 Median Spannbreite 50% Konfidenzintervall
 bedarfs über Erdgas abgedeckt wird. Diese Anteile werden zur Ermittlung der Wertschöpfungseffekte
 im Verarbeitenden Gewerbe herangezogen. Die Erdgasverknappung für die Wirtschaftszweige ent-
 Quelle: Berechnungen und Darstellung der Institute. spricht der reduzierten Menge in der Simulation in Relation zur bislang eingesetzten Menge (vgl.

 etc © GD April 2022 Tabelle A.1 im Anhang). Es wird angenommen, dass in Engpasssituationen die Gasversorgung in jedem
 Wirtschaftsbereich prozentual um denselben Betrag gekürzt wird. Da die Erdgasimporte kurzfristig kaum
 substituierbar sind, geht die Bruttowertschöpfung der einzelnen Bereiche jeweils proportional zurück.

 Abbildung 3 Tabelle 2
 Erdgasanteil an Endenergieverbrauch nach Wirtschaftsbereichen
 Füllstand der Erdgasspeicher
 Erdgas (TTF 1st Future day)
 Wirtschaftszweig WZ 2008 Erdgasanteil
 100%
 Euro je MWh Herstellung von Glas und Glaswaren, Keramik, Verarbeitung von Steinen und Erden 23 76%

 200 90% Herstellung von Nahrungs- und Futtermitteln, Getränkeherstellung, Tabakverarbeitung 10, 11, 12 54%
 Herstellung von chemischen Erzeugnissen 20 39%
 80% Metallerzeugung und -bearbeitung 24 34%
 Maschinenbau 28 33%
 70%
 150 Kohlenbergbau, Gewinnung von Erdöl und Erdgas 05, 06 31%
 60% Herstellung von Kraftwagen und Kraftwagenteilen 29 30%
 Herstellung von Gummi- und Kunststoffwaren 0,38 27%
 50%
 100 Quellen: AG Energiebilanzen e.V.; Berechnungen der Institute.
 40%
 Für die Berechnung der Effekte einer Gasverknappung auf die erdgasintensiven Bereiche des Produzie-
 30%
 renden Gewerbes in Deutschland werden die reduzierten Erdgasverbrauchsmengen ( ) aus dem
 50 20% monatlichen Erdgasmodell verwendet. Für die Wirtschaftszweige ( , ∈ 1, … , ) werden Produktions-
 10%
 funktionen vom Leontief-Typ unterstellt. Daraus folgt, dass sich die Produktion ( ) eines Sektors durch
 das Minimum der verfügbaren Vorleistungsgüter ( ) in Relation zu den benötigten Mengen pro Pro-
 0 0%
 II III IV I II III IV I II III IV I II III IV Apr Mai Jun Jul Aug Sep Okt Nov Dez Jan Feb Mrz Apr Mai Jun Jul Aug Sep Okt Nov Dez
 duktionseinheit ( , ) ergibt:
 2023 2021 2022 2023 22 22 22 22 22 22 22 22 22 23 23 23 23 23 23 23 23 23 23 23 23
 ,
 = min � : ∀ � .
 Basisszenario Alternatives Szenario Median Spannbreite 50% Konfidenzintervall ,
 Quelle: Berechnungen und Darstellung der Institute.
 © GD Frühjahr 2022 © GD April 2022
 Dementsprechend reduziert sich die Produktion proportional zum Rückgang des Einsatzes eines Vor-
 leistungsgutes. Weiterhin wird angenommen, dass zwischen Bruttowertschöpfung ( ) und Produk-
 tion in allen Wirtschaftszweigen eine proportionale Beziehung besteht:

 Interestingly, Gemeinschaftsdiagnose model has Leontief production all over the place Seite 4 von 10
 1 1 ,1
 0
 ,
 = 0 = ,0 = � ,0 : ∀ � =
 ,
 ,1
 1 0
 0 0
 .

wie lange sie erhöht von 200 Euro je MWh im zweiten Quartal nur allmählich Die Erstrundeneffekte auf die Bruttowertschöpfung resultieren unmittelbar aus der Reduktion des Erdgasein-
 in welchem Umfang sinkt und auch am Ende des Prognosezeitraums noch dop- satzes. Diese Erstrundeneffekte strahlen auf die nachgelagerten Produktionsstufen aus. Die Bestimmung
 zusätzliches Angebot pelt so hoch ist wie im Basisszenario. dieser Zweitrundeneffekte erfolgt anhand einer Input-Output-Analyse, der die OECD-Input-Output-Tabelle
nn durch eine erhöhte
rn mit substanziellen
 Main text https://gemeinschaftsdiagnose.de/wp-content/uploads/2022/04/GDF2022_Gesamtdokument_unkorrieigert_12.4_13h.pdf
 Die höheren Energiepreise bremsen weltweit die Konjunk-
Arabien, das Aufheben tur. In Europa kommt hinzu, dass in einer Reihe von Ländern
 schränkungen gegen- Appendix https://gemeinschaftsdiagnose.de/wp-content/uploads/2022/04/GD22F_Hintergrund-Alternativszenario_final.pdf
 russisches Gas als Rohstoff so wichtig ist, dass es kurzfristig
durch das Hochfahren nicht vollständig ersetzt werden kann und – wie in Deutsch- Seite 5 von 10
 Ölquellen (Schieferöl land – mit Rationierungen zu rechnen ist, welche die Indus-
en spielt eine Rolle, wie trieproduktion zeitweise deutlich sinken lassen werden. Die
 n nichtsanktionieren- wirtschaftlichen Einbußen sind zwar umso stärker, je höher
n, findet. Die Institute die Abhängigkeit von russischem Erdgas ist, sie betreffen
ass der Preis für Öl der aber alle Branchen und Länder indirekt. Denn über die
 14 / 21
Bruttowertschöpfung der Wirtschaftsbereiche 0,1 0,4 0,8 0,3 –0,5 –4,5 –0,3 5,3 1,6 –2,2
 darunter:
 Lage und Prognose der Deutschen Wirtschaft
Gemeinschaftsdiagnose (main econ institutes joint analysis)
 Produzierendes Gewerbe ohne Baugewerbe
 darunter:
 1,1 –1,8 1,4 0,3 –0,6 –13,2 –2,1 15,9 0,8 –7,7

 ▶ Verarbeitendes
 GDP deviations
 Gewerbe rel. to 0,8“do –2,0
 nothing”:
 1,5 -0.8%
 0,3 –0,5in 2022,
 –13,0 -5.3%
 –2,0 in 20230,3(-3.05% –7,7ave)
 15,7
 Energieversorgung, Wasserversorgung u. Ä. 3,0 –0,3 0,5 0,2 –0,6 –14,2 –2,3 17,4 3,9 –7,8
 ▶Baugewerbe
Tabelle Year-to-year GDP change
 2.18
 2,5 with
 0,2 import
 0,7 stop:
 0,3 +1.9%
 –0,1 –3,5 in–0,5
 2022,4,2-2.2% 3,0in 2023 –1,9
 Handel, Verkehr, Gastgewerbe –1,2 1,1 0,5 0,2 –1,2 –3,0 0,2 4,4 2,0 –2,0
Bruttoinlandsprodukt und Bruttowertschöpfung nach Wirtschaftsbereichen – Alternativszenario
 Information und Kommunikation 0,1 0,8 0,3 0,2 –0,7 –1,6 0,6 1,8 3,1 –0,8
 Finanz- und Versicherungsdienstleister –0,2 0,1 0,4 0,4 0,1 0,0 0,1 0,1 1,1 0,6
 2022 2023
 Grundstücks- und Wohnungswesen 0,1 0,3 0,1 0,1 0,1 –0,6 0,3 0,8 0,6
 2022 0,2
 2023
 Unternehmensdienstleister I 0,0 II 0,5 III0,5 IV 0,2 I–0,4 II–4,2 III–0,2 IV5,6 2,8 –1,9
 1,8 Veränderung
 1,1 gegenüber
 0,4 dem Vorquartal in 0,0
 % Veränderung
 1,5 gg. dem Vorjahr 1,5
 in %
 1 2
 Öffentliche Dienstleister 0,0 0,0 0,4 0,4
 Bruttoinlandsprodukt
 Sonstige Dienstleister 0,1
 –2,5 0,4 0,8
 5,5und Prognose
 Lage 0,3
 2,0 der Deutschen
 0,5 –0,5
 –1,8
 Wirtschaft–4,5
 –3,9 –0,3
 0,3 5,3
 3,5 1,9
 1,0 –2,2
 –1,2
 Lage und Prognose der Deutschen Wirtschaft
 darunter: Abweichung vom Basisszenario in Prozentpunkten
 Bruttowertschöpfung der Wirtschaftsbereiche
 Bruttoinlandsprodukt 0,1
 0,0 0,4
 -0,3 0,8
 –0,8 0,3
 –0,7 –0,5
 –1,2
 und schwächt
 –4,5
 –5,2
 hierzulande
 –0,3
 –0,8
 die Nachfrage.
 5,3
 4,9
 Zugleich kommt
 1,6
 –0,8 –2,2
 –5,3
 Abbildung 2.1 Abbildung 2.17 möglich. Allerdings fehlt bislang auch ein Mechanismus, der
 darunter:
 darunter: Reales Bruttoinlandsprodukt in Deutschland
 es durch die kriegsbedingten Störungen zu neuen Liefer- es einem industriellen Verbraucher ermöglichen würde, durch
 Szenarienvergleich - Reales
 engpässen, die kurzfristig Bruttoinlandsprodukt
 nicht zuletzt die Automobil- eine vorgezogene Reduktion des Gasverbrauchs Reserven
 Produzierendes Gewerbe
 Bruttowertschöpfung ohne Baugewerbe
 Saison- und kalenderbereinigter
 der Wirtschaftsbereiche 0,0 Verlauf–1,8
 1,1 -0,3 1,4
 –0,8 0,3Verkettete
 –0,7 industrie –0,6
 –1,2
 treffen. –13,2
 Volumenangaben –2,1 saison- und
 –5,2 in Mrd. Euro;
 –0,8 15,9
 4,9 0,8
 –0,8
 für die Engpassphase zu –7,7
 –5,3
 bilden. In der Folge wird die
 kalenderbereinigter Verlauf
 Verkettete Volumenangaben in Veränderung gegenüber Produktion der gasverbrauchenden Industrie im Vorfeld des
 darunter:
 darunter: Mrd. Euro dem Vorquartal in % Im zurückliegenden Winterhalbjahr haben vor allem die Engpasses noch nicht angepasst.
 870 10,0
 Maßnahmen zum Infektionsschutz die Wirtschaftsleis-
 Verarbeitendes
 Produzierendes Gewerbe
 Gewerbe ohne Baugewerbe 0,8
 0,0 –2,0
 –0,3 1,5
 –1,0
 3,1 0,3 860tung gedämpft
 –1,6 –0,5 (vgl. Tabelle
 –2,2 –13,0 2.1). Unter
 –14,5 –2,0
 –2,8 15,7
 15,4
 der Voraussetzung,
 0,3
 –1,1 –7,7
 –12,8
 Die Verbraucherpreise werden weitaus stärker steigen als
 Energieversorgung, Wasserversorgung u. Ä.
 Basisszenario
 darunter: 830
 3,0 –0,3 2,7
 0,5 5,0
 0,2 840dass das–0,6
 Kriegsgeschehen
 –14,2 in der Ukraine
 –2,3 mit Blick
 17,4auf 3,9 –7,8 2.18). Maßgeblich sind die
 im Basisszenario (vgl. Abbildung
 1,1 die ökonomische Aktivität nicht weiter eskaliert, dürften spürbar höheren Rohstoffpreise. Vor allem die Preise für
 Baugewerbe
 Verarbeitendes Gewerbe 1,1 2,5
 0,0 2,9
 0,2
 -0,3 0,7
 –1,0 0,3 820die konjunkturellen
 –1,7 –0,1
 –2,3 –3,5
 –14,5
 Auftriebskräfte–0,5
 –2,8
 ab dem Frühjahr 4,2 die
 15,2 3,0
 –1,1 –1,9
 –13,1
 Gas, das zuletzt 2,5% des Warenkorbs der Verbraucher aus-
 Oberhand gewinnen (vgl. Abbildung 2.1). Nach einem machte, steigen kräftig. Höhere Marktpreise für Gas machen
 Handel, Verkehr, Gastgewerbe
 Energieversorgung, Wasserversorgung
 790 u. Ä. –1,2
 0,0 1,1
 –0,8 0,5
 –1,0 0,2 schwachen
 0,0 –0,8
 800
 –1,2 Jahresauftakt
 –1,4 –3,0 dürfte–2,8
 –14,8 0,2 Bruttoinlands-
 das 4,4
 16,9 2,0
 –1,3 –2,0
 –11,0
 sich in der Verbraucherpreisinflation aufgrund bestehender
 produkt im zweiten Quartal zwar deutlich zulegen, ohne Lieferverträge für gewöhnlich erst nach und nach bemerkbar.
 Information
 Baugewerbeund Kommunikation 0,1
 0,0-4,6 0,8
 0,0 0,3
 –0,3 0,2 780die Belastung
 -0,2 –0,7 durch den
 –0,5 –1,6Krieg in der
 –3,9 0,6
 –0,9
 Ukraine würde
 1,8das
 3,8 3,1
 –0,2 –0,8
 –3,3
 Daher werden die höheren Gaspreise in weiten Teilen des
 760 Alternativszenario Prognosezeitraums die Verbraucherpreisinflation anfachen.
 Finanz-
 Handel,und Versicherungsdienstleister
 Verkehr, Gastgewerbe
 750
 –0,2
 0,0 0,1
 –1,2 0,4
 –1,5
 -5,0
 0,4 Plus aber
 –0,7 0,1kräftiger ausfallen.
 –1,8 0,0
 –3,5 Insgesamt
 0,1 verzögert4,1
 –0,1 0,1sich 1,1
 –1,9 0,6unmittelbar höheren Energie-
 –5,0
 Neben den damit verbundenen
 damit
 740
 der Erholungsprozess abermals. Das Vorkrisen-
 preisen werden die Verbraucherpreise zusätzlich durch die
 Grundstücks- undKommunikation
 Information und Wohnungswesen 0,1
 0,0 0,3
 -0,1 0,1
 –0,5
 Prognose 0,1 niveau der
 –0,3 0,1
 –1,2 –0,6 wird demnach
 –2,1
 Wirtschaftsleistung 0,3 erst im dritten
 0,1 0,8
 1,3 0,6
 –0,4 0,2
 –2,9
 Quartal des laufenden Jahres erreicht werden und damit
 720
 angesichts der höheren Rohstoffpreise deutlich anziehenden
 710 -10,0
 Unternehmensdienstleister
 Finanz- und Versicherungsdienstleister 2018 2019 0,0
 0,0
 2020 2021 0,5
 0,0 2022 0,5
 0,1
 2023
 0,2 ein halbes –0,4 –4,2
 0,0Jahr später, als von den–0,2
 –0,1 0,0
 Instituten in 0,0 5,6
 ihrem 2,8
 0,1 –1,9
 Erzeugerpreise steigen. Insgesamt
 0,1 dürfte die Inflation im
 700 laufenden Jahr bei 7,3% liegen (Basisszenario: 6,1%) und
 Herbstgutachten erwartet worden war (vgl. Kasten 2.1).
 Öffentliche
 Grundstücks-Dienstleister
 und Wohnungswesen
 Volumen (linke Skala)
 0,0
 Laufende Rate (rechte Skala)
 Jahresdurchschnitt¹ (linke Skala)
 1,8
 0,0 1,1
 –0,1 0,4 Maßgeblich
 –0,1 0,0 für die2020
 –0,1
 2019
 0,0 2021 0,1
 –0,8
 Prognoserevision 0,4ist dabei
 2022
 0,4nur
 0,6
 nicht
 2023
 1,5
 –0,1 1,5ausgesprochen15
 –0,6
 in 2023 mit 5% (2,8%) weiter / bleiben.
 hoch 21
Oil Embargo: Bundesbank
In contrast to gas, no shortages. But higher prices. Bundesbank separates price effects:
 ▶ −1.85% GDP rel. to baseline, +1.15% growth in 2022, more in 2023 and 2024
 ▶ +1.5% extra inflation in 2022, more in 2023 and 2024

 16 / 21
France and other EU countries, embargo vs tariff
Report for French CEA w Landais & Martin https://www.cae-eco.fr/staticfiles/pdf/cae-focus84.pd
 b. Impact of a complete ban vs a 40% tariff on Russian energy imports the most pessimistic calibration
 in terms of substitution

 17 / 21
Conclusion
Energy sanction options
 ▶ oil embargo plans not enough, too slow
 ▶ many other policy options available, see “Energy Sanctions Roadmap” paper

Bounding the economic costs
 ▶ Estimated costs of complete import stop are substantial, but not catastrophic.
 ▶ Ballpark: somewhat smaller than COVID, worst-case 3% GDP on impact
 ▶ That was recession in which we were able to provide insurance, compensate losers
 ▶ tariffs allow to “calibrate" these costs

Policy
 ▶ Make sure the price mechanism works, want people and firms to substitute
 ▶ Bad fiscal policies: tax subsidies on energy, ...
 ▶ Monetary policy: raise interest rates to control inflation
 18 / 21
19 / 21
Facts II: Hardest Hit Industries
 2022 Crisis (Import Stop) 2020 Crisis (Covid-19)
 Chemicals Food+ Metal Air Trans. Hosp. Entert.
 Employees (in 1,000) 352 941 271 66 1894 693
 Employees (% of total) 0.78 2.08 0.60 0.15 4.18 1.53
 GVA (in ebln) 46 47 21 7 51 43
 Gross Output (in ebln) 137 195 104 25 104 69
 Share males (in %) 74 52 88 46 47 49
 Share gas (%) 37 12 10
Source: Volkswirtschaftliche Gesamtrechnungen (2019)

3 hardest hit sectors:
 ▶ Make up 59% of industrial gas usage
 ▶ In terms of GVA, wages, and employees comparable to hardest hit sectors in 2020
 ▶ Big difference in gender to sectors shut down in 2020
 20 / 21
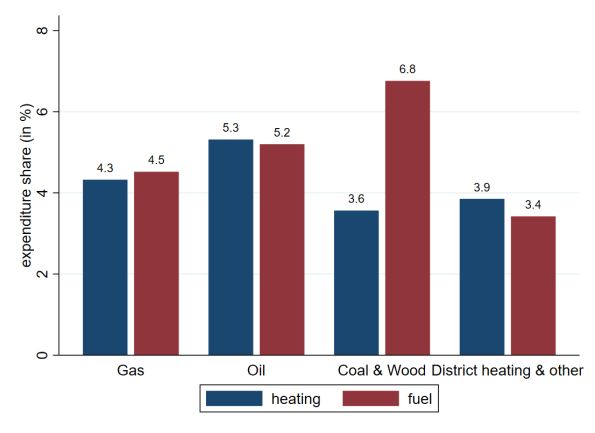
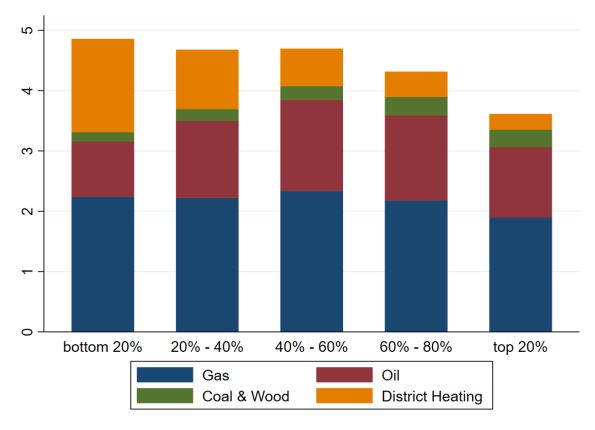
Facts III: Direct exposure across the income distribution
 ▶ Expenditure shares for heating
 between 3-5%
 ▶ Relatively flat in income
 (=declining income share)
 ▶ Larger households have smaller
 heating shares (not shown)
 ▶ Gradient in income the same
 across household sizes
 ▶ Share of car fuels (not shown):
 inverse U-shape in income
 (b) By income

holds by type of heating for heating (blue bars) and for fuel (red bars). 21 / 21
You can also read