Environmental Impact of Breastmilk Substitutes - the Carbon Footprints of Infant Formula - GIFA

Page created by Janet Mejia
 
CONTINUE READING
Environmental Impact of Breastmilk Substitutes - the Carbon Footprints of Infant Formula - GIFA
Environmental Impact of Breastmilk
Substitutes – the Carbon Footprints of
            Infant Formula

         Dr. JP Dadhich MD (Paediatrics)
    National Coordinator and Technical Director,
     Breastfeeding Promotion Network of India
          Member, IBFAN Global Council

    3rd World Breastfeeding Conference, Rio de Janeiro, Brazil
                      11-15 November, 2019
Environmental Impact of Breastmilk Substitutes - the Carbon Footprints of Infant Formula - GIFA
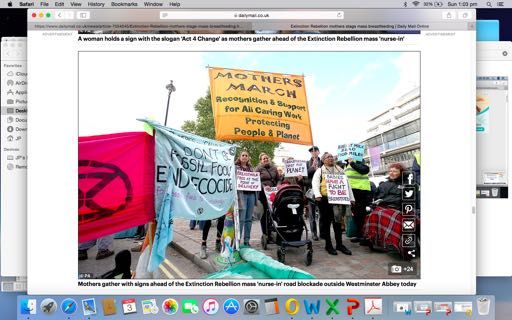
Recognizing Environmental Impact of BMS
Use

                  2015            2016
    2014

                              2
Environmental Impact of Breastmilk Substitutes - the Carbon Footprints of Infant Formula - GIFA
Average GHG Emissions (kg CO2 eq) per
kg of different category of Milk Formula

                        Standard Milk
                        Formula/Special
                        Milk Formula
                        3.95 kg Co2 eq per kg

                         FU Milk Formula/
                         Toddler’s Milk Formula
                         4.04 kg Co2 eq per kg

                                      3
Environmental Impact of Breastmilk Substitutes - the Carbon Footprints of Infant Formula - GIFA
Recognition by Researchers – Lancet
Series on Breastfeeding 2016
Breastmilk substitutes leave an ecological footprint –
! Need energy and water to manufacture
! Materials for packaging
! Fuel for transport distribution
! Water, fuel, and cleaning agents for daily
  preparation and use

 Rollins NC, Bhandari N, Hajeebhoy N et al. Why invest, and what it will take to
      improve breastfeeding practices? Lancet. 2016;387(10017):491-504.

                                                               4
Environmental Impact of Breastmilk Substitutes - the Carbon Footprints of Infant Formula - GIFA
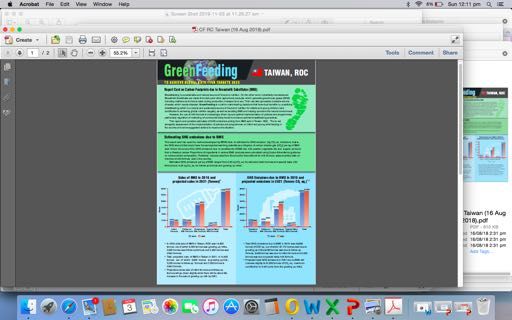
Publications in Peer-reviewed Journal 2019
Breastfeeding has lower CFs than BMS

“..This was true for all four countries studied in
the assessment: UK, China, Brazil and
Vietnam, where the impact of breastfeeding
was 40%, 53%, 43% and 46% lower,
respectively, than that arising from using
BMS..”
   Karlsson JO, Garnett T, Rollins NC, Röös E. The carbon footprint of breastmilk
   substitutes in comparison with breastfeeding. J Clean Prod. 2019 Jun
   10;222:436-445.

                                                                    5
Environmental Impact of Breastmilk Substitutes - the Carbon Footprints of Infant Formula - GIFA
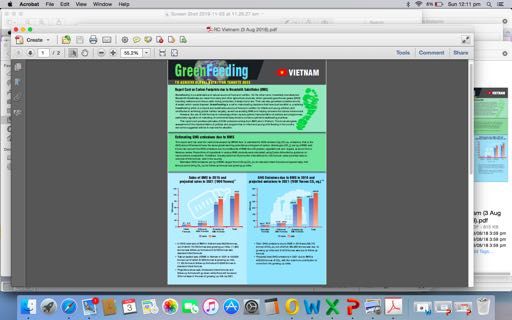
Recognition by Researchers – BMJ
Editorials 2019

                              6
Environmental Impact of Breastmilk Substitutes - the Carbon Footprints of Infant Formula - GIFA
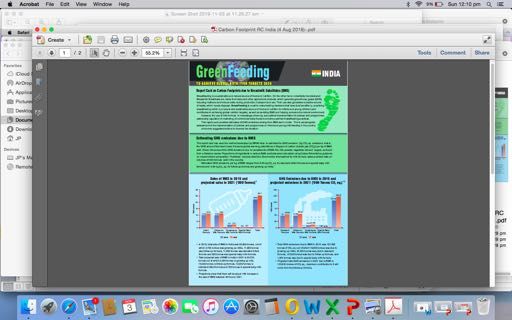
Community voices - Extinction Rebellion
Mother’s March in London – October, 2019

     https://www.dailymail.co.uk/news/article-7554245/Extinction-Rebellion-mothers-stage-
     mass-breastfeeding.html
                                                                             7
Environmental Impact of Breastmilk Substitutes - the Carbon Footprints of Infant Formula - GIFA
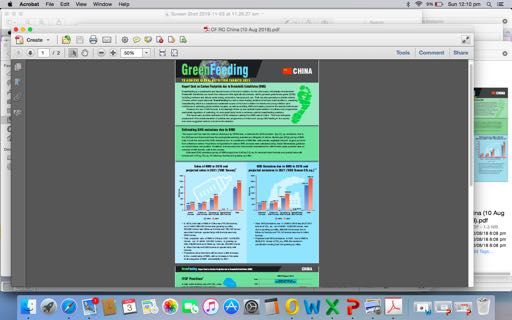
https://www.bpni.org/wp-content/uploads/2018/11/Green-Feeding-RC-Carbon-Footprint-10-
Asian-Countries.pdf                                                                     8
Environmental Impact of Breastmilk Substitutes - the Carbon Footprints of Infant Formula - GIFA
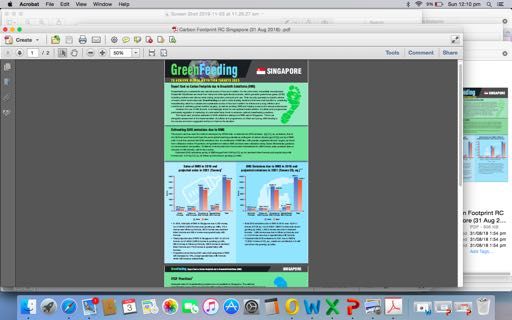
GHG emissions in study countries due to BMS
(2016), projections (2021) and % change

                                                       2016      2021       change
                   8    28%                                                                                             30%
                                                                                                                 7.15
                   7
                                                                                                               23%      25%
                                                                            23%
                                                                                                              5.82
                   6
                                                        19%
                                   18%                                                                                  20%
  Million Tonnes

                   5
                          3.93               15%
                   4                                              14%                                                   15%
                       3.06
                   3                                                                    9%
                                                                                                                        10%
                                                                                                  7%
                   2                 1.37
                                  1.16
                                               0.63      0.43                                                           5%
                                                                   0.25       0.27                     0.15
                   1                        0.55                                         0.12
                                                      0.36      0.22       0.22       0.11      0.14
                   0                                                                                                    0%
                       China     Indonesia Thailand   Vietnam Phillippines Malaysia   India Others (K,S,T) Total

                                                                                                   9
Environmental Impact of Breastmilk Substitutes - the Carbon Footprints of Infant Formula - GIFA
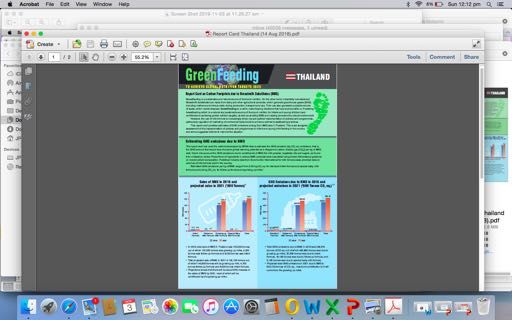
Country-wise contribution to GHG
emissions due to BMS (2016)
                                            Vietnam
                                               6%
                        Thailand
      Taiwan -ROC
                          9%
          1%
      Singapore
                  ROK
           0%
                   1%
     Phillippines
          4%

          Malaysia
            4%                                                                 China
                                                                                53%

                   Indonesia
                      20%

                                         India
                                          2%
  China   India   Indonesia   Malaysia   Phillippines   ROK   Singapore            10
                                                                          Taiwan -ROC   Thailand   Vietnam
Per Capita GHG emissions Kg CO2 eq
                            7.00

                                         Total
                            6.00

                            5.00
  Tonnes of GHG emissions

                            4.00
                                         CHINA

                            3.00
                                                        INDONESIA

                            2.00
                                                        VIETNAM                                  THAILAND
                                                                       MALAYSIA
                                       PHILIPPINES
                            1.00                              TAIWAN ROC
                                                  ROK
                               INDIA                                               SINGAPORE

                            0.00
                                0.00      20.00      40.00     60.00   80.00   100.00   120.00   140.00     160.00   180.00
                                                                       Per Capita GHG
Contribution of GHG Emissions by different type
of BMS in study countries – 2016 (n=10)

                          Special formula      Standard
                                1%             formula
                                                 18%

                                                          Follow-up
    Growing-up milk                                        formula
       formula                                               21%
         60%

                      Total GHG emissions 5.82 M Tonnes
                                                                  12
Type of BMS which is leading contributor to
GHG emissions in countries (2016)
                Standard( Follow1up(   Growing1up(      Special(
   Country(
                 formula(  formula((   milk(formula((( formula((
China(             24%(      27%(          49%(           0%(
India(             44%(      44%(          10%(           2%(
Indonesia(         11%(      13%(          75%(           0%(
Malaysia(           8%(      11%(          80%(           1%(
Phillippines(      26%(      23%(          49%(           3%(
ROK(               36%(      35%(          27%(           1%(
Singapore(          8%(       9%(          72%(          11%(
Taiwan(1ROC(       18%(      17%(          58%(           7%(
Thailand(           6%(       3%(          90%(           1%(
Vietnam(            7%(      13%(          79%(           0%(
                                                13
How significant is GHG produced by BMS

     Food Item (1 kg)      GHG emissions in Kg CO2 eq
   BMS (Only production)    Standard infant formula – 3.95
                               FUF/GUM formula – 4.05
         Chicken                         4.7
           Fish                          3.1
           Egg                           3.0
           Milk                          1.0
           Bean                         0.86
           Rice                          1.2
          Wheat                         0.58
          Potato                        0.19
          Apple                         0.28

                                            14
Equivalent activities for total GHG emission due
to milk formula in study countries (5.82 M tonnes)

Equivalent to annual       14.2 Billion Miles driven by an
Greenhouse Gas             average passenger vehicle
emissions from
Greenhouse Gas      221 Million Incandescent lamps
emission avoided by switched over to LEDs
Carbon sequestered         96.2 Million tree seedlings grown
by any one of these        for 10 years
                           6.8 Million acres of U.S. forests in
                           one year

   https://www.epa.gov/energy/greenhouse-gas-equivalencies-calculator

                                                       15
Equivalent activities for total GHG emission due
to milk formula in study countries (5.81 M tonnes)

                                                                                      7.5 Billion copies of
                                                                                          the Guardian
                                                                                      newspaper, recycled

                                                                                  828 Billion typical Google
                                                                                       searches made

   https://www.theguardian.com/environment/green-living-blog/2010/nov/04/carbon-footprint-newspaper

         https://searchengineland.com/calculating-the-carbon-footprint-of-a-google-search-16105
                                                                                                  16
Average WBTi Policy & Programme
Indicator Score (n=10)

   8

   7                                                               6.7
                                 6.15   6.3
                     5.9   5.8                       5.75
   6   5.55                                   5.65                       5.64

   5          4.75

                                                            3.85
   4

   3

   2

   1

   0

                                                                         17
Trends in sales of BMS in some select Asian
Countries and their WBTi score for the Code
implementation
                                  800000                      761000                                                    40%
                                                       36%
                                                                                                                        35%
                                  700000 Code Ind
Sales of Milk Formula in Tonnes

                                           score 4                                                                      30%
                                                                                       29%
                                  600000             560000
                                                                                                                        25%
                                  500000
                                                                                                                        20%
                                                                                 Code Ind
                                  400000                                         score 6                                15%
                                                                                       287000                           10%
                                  300000
                                                                              222800                      Code Ind
                                                                                                          score 9.5     5%
                                  200000
                                                                                                                        0%
                                                                                                               -3%
                                  100000
                                                                                                       27783    26900   -5%

                                       0                                                                                -10%
                                                         China                  Indonesia                  India

                                                                       2012    2016         % Change

                                                                                                          18
Conclusions

!   Environmental impact of BMS use is significant
!   It is being increasingly being recognized globally
!   FUF and GUM are the leading category among
    BMS for GHG emissions
!   Urgent action is required for enhancing
    breastfeeding and decreasing BMS use
    ◦ Strengthening of Policy and Programmes for Protection,
      Promotion and Support of Breastfeeding
    ◦ Effective implementation of the International Code of
      Marketing of BMS
                                                    19
Thanks for
                                                    your attention!

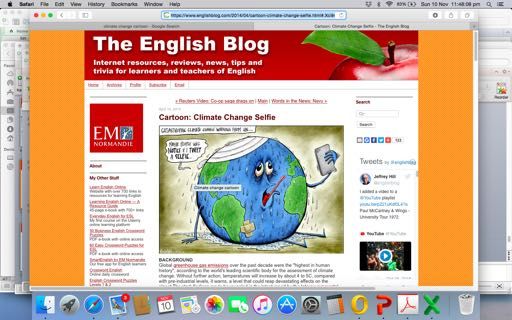
https://www.englishblog.com/2014/04/cartoon-climate-change-
selfie.html#.Xci9rq2ZPBI                       Thanks !
                                                    20
Acknowledgment

!   Dr. Julie Smith, Economist, Australian National
    University
!   Naomi Hull, IBCLC, RN, Australia
!   Dr. Phillip Baker, Australian National University
!   IBFAN country coordinators from 10 Asian
    countries

                                             21
You can also read