Environmental Linkages - Federal Reserve Bank of Kansas City
←
→
Page content transcription
If your browser does not render page correctly, please read the page content below
Environmental Linkages
                            Wolfram Schlenker
Columbia University - Center for Environmental Economics and Policy (CEEP)
             National Bureau of Economic Research (NBER)

                               May 25, 2021

      Federal Reserve Bank of Kansas City: 2021 Agricultural Symposium
                The Roots of Agricultural Productivity Growth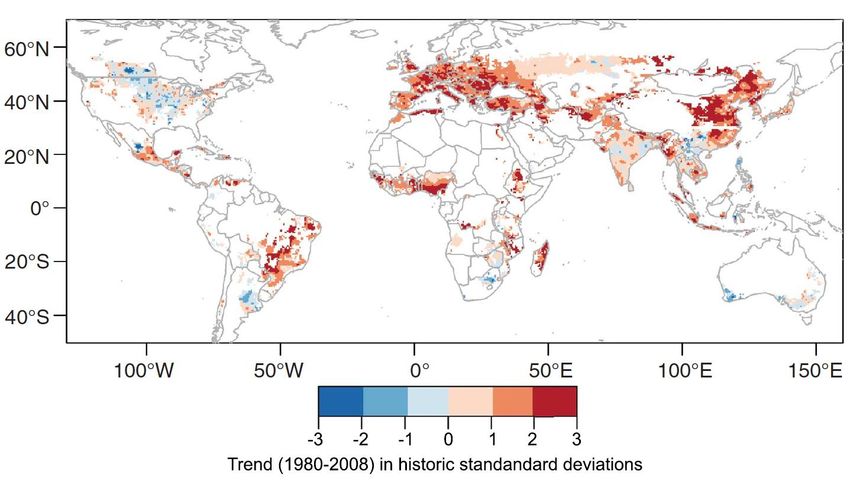
Productivity: US Corn Yields 1866-2019

• Phase 1 (1866-1940)
   • Fairly constant average yields
• Phase 2 (1940-1980)
   • Exponential growth in yields
• Phase 3 (since 1980)
   • Linear growth in yields

• Fluctuation around average
   • Constant in percent terms
   • Environmental factors are key

                                         1
Environmental Drivers of Corn Yields
• Growing Season
   • April - September

• Peak exposure crucial
   • Temperatures
   • Ozone

• Temperature
   • Degree days above 86F
• Ozone
   • Exposure above 70ppb
• Precipitation
   • Season-total
                                       2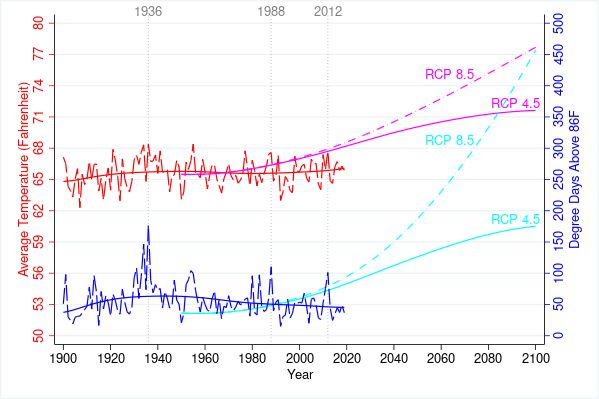
Key Concept: Measures of Peak Exposure

• Degree days above bound
  • measures how much above
  • measures how long above

• Degree days above 86F
  • Explains more than half of
    year-to-year variability in corn
    yields

• Peak ozone
  • Hourly ozone readings
  • Exceedance above 70ppb
  • Summed over all hours
                                         3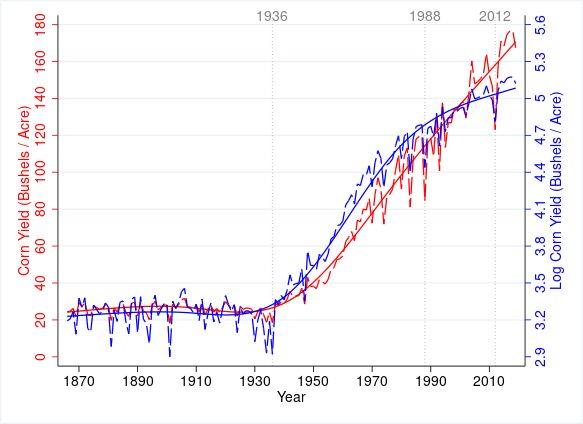
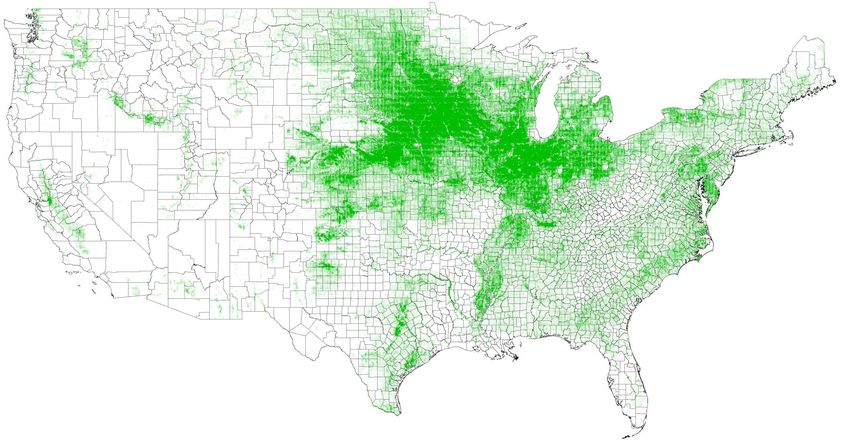
Average for US over Corn Growing Area

   • Cropland Data Layer (30x30m satellite data 2010-2018)
      • Average of grid that grows corn                      4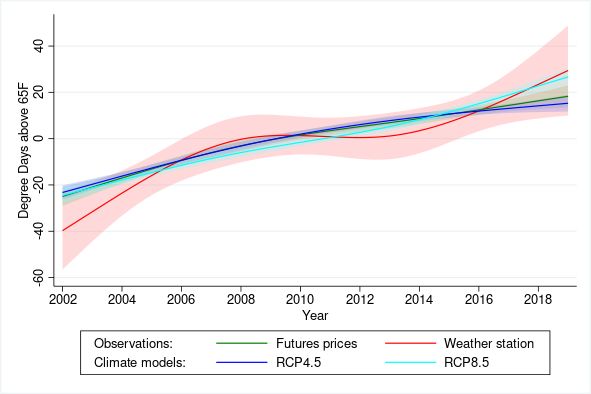
Ozone over Corn Area over Time
• Average ozone
  • Red line (left y-axis)
  • Minor decrease

• Peak ozone
  • Blue line (right y-axis)
  • Phased out
      • Clean Air Act
  • No further reduction
    going forward

                                 5
Temperature over Corn Area over Time
• Average temperature
• Red line (left y-axis)
• Small increase since 1980
• Not as much as predicted
• Degree days above 86F
• Blue line (right y-axis)
• Decrease 1980-2020
• Cooling effect of irrigation
• Intensification of agriculture
• Predicted to increase
• Especially under RCP 8.5
6Weather Derivatives at US Airports
• Weather futures
• Payout based on weather
• 8 airports in the US
• ATL, CVG, DFW, LAS, LGA,
MSP, ORD, SAC
• Prices have been rising
• Comparable trends
• Price of derivative (green)
• Actual weather (red)
• Climate models (blue)
• Schlenker & Taylor (JFE, 2021)
7Observed Trend over Agricultural Area • Ortiz-Bobea et al. (Nature Climate Change, 2021) 8
Climate Effect on Total Factor Productivity
• So far: focus on output
   • Yields
   • Climate change might impact
     required input use as well

• Total factor productivity
   • Output minus input
   • TFP growth since 1961 linked
     to weather
   • Ortiz-Bobea et al. (NCC, 2021)

• Observed climate change
  lowered TFP
   • Effect varies spatially
   • Hotter areas more impacted               9
Going Forward
• Climate change
• Four basic staple commodities (corn, wheat, rice and soybeans)
• 75% of calories that humans consume, US market share 25%
• Extreme heat will rise and lead to slowing of productivity growth
• So far increase in extreme temperature has been limited
• But local feedback loops can only counterbalance warming trends to a limited amount
• Peak ozone has been eliminated – further reduction not possible
• CO2 fertilization increases productivity growth
• Lower global agricultural productivity growth
• Increase in prices of basic food commodities
• Good for farmers, bad for consumers, especially in developing countries
• US: commodity cost small share of price in store
• Regional shifts are likely (e.g., growing area expansion in Russia) 10Conclusion: Socioeconomic Spillovers
• In the past, agricultural productivity declines had large ripple effects
• Dust Bowl: large outmigration, especially of younger population
• 1936 still year with highest number of degree days above 86F
• Climate projections predict this to be an average year by mid century (RCP 8.5)
• Migration in Africa
• Linking bi-national flows to price shocks caused by world markets
• If prices of cash crops decrease, outmigration increased
• If prices on non-cash crops decreased, no effect on outmigration
• Conclusion
• Agriculture still very much dependent on environmental inputs
• Relationship often highly nonlinear (temperature, droughts, ozone)
• Climate change lowers productivity growth in current growing areas
11You can also read