The Weather Analysis Display (WAND) Tool: Developing a Meteorological Data Display Tool for Situational Awareness during Day of Launch of Space ...
←
→
Page content transcription
If your browser does not render page correctly, please read the page content below
https://ntrs.nasa.gov/search.jsp?R=20190000729 2019-09-13T16:19:49+00:00Z

    The Weather Analysis Display (WAND) Tool:
    Developing a Meteorological Data Display Tool for
    Situational Awareness during Day of Launch of Space
    Launch Vehicles Using Python
John M. Orcutt1
Patrick White2

Ninth Symposium on Advances in Modeling and Analysis Using Python
Phoenix, AZ

1   Jacobs Space Exploration Group / Marshall Space Flight Center Natural Environments Branch
                                                                                                                        www.jacobs.com | worldwide
2   NASA / Marshall Space Flight Center Natural Environments Branch
Background
• Atmospheric environments are an
    important element in day-of-launch (DOL)
    operations of space launch vehicles.
• NASA Marshall Space Flight Center
    Natural Environments Branch provides
    multiple functions supporting DOL
    operations.
    – Generates a vertically complete profiles for
      trajectory and load calculations using the Profile
      Envision and Splicing Tool (Orcutt et al.; 2017)
    – Monitors atmospheric conditions for situational
      awareness

2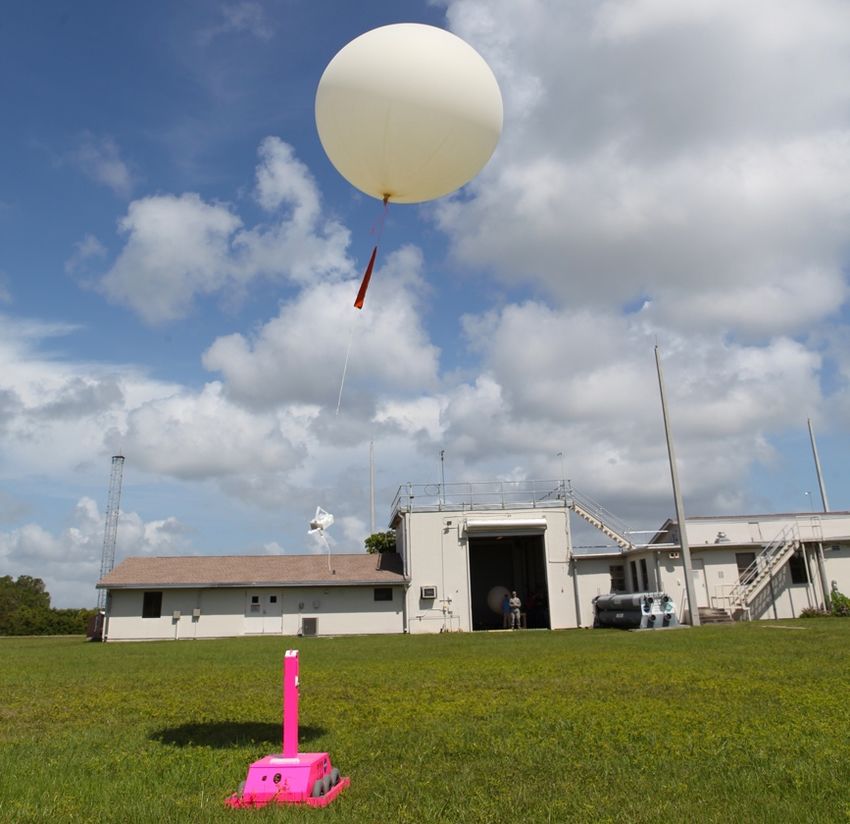
Weather Analysis Display (WAND) Introduction
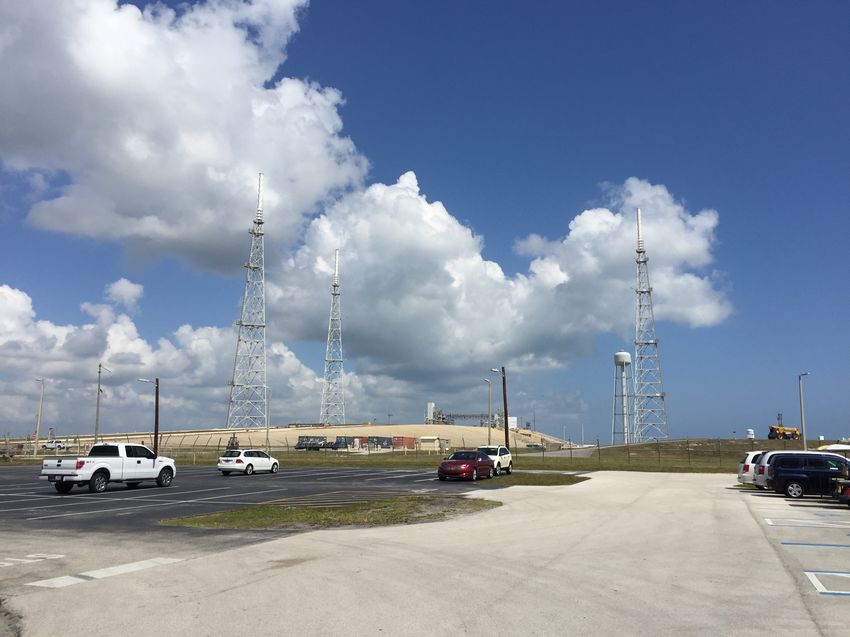
• The USAF’s Eastern Range contains of a highly dense network of weather instrumentation.
– A network of weather towers
– Weather balloons
– A network of Doppler Radar Wind Profiling (DRWP) systems
• Tropospheric DRWP at ~48-MHz
• Boundary Layer Profilers at 915-MHz
• WAND was developed by MSFC NE to provide MSFC NE DOL operators situational
awareness capability by presenting data in a multitude of ways.
– Observations
– Climatology
• Designed to operate within the “highly secured” environment at the Huntsville Operations
Support Center.
– WAND was coded using Python 3
– Has few dependencies
• Numpy – array handling
• Scipy – mathematical functions
• Matplotlib – data visualization
3
• Tkinter – create and execute the Graphical User Interface (GUI)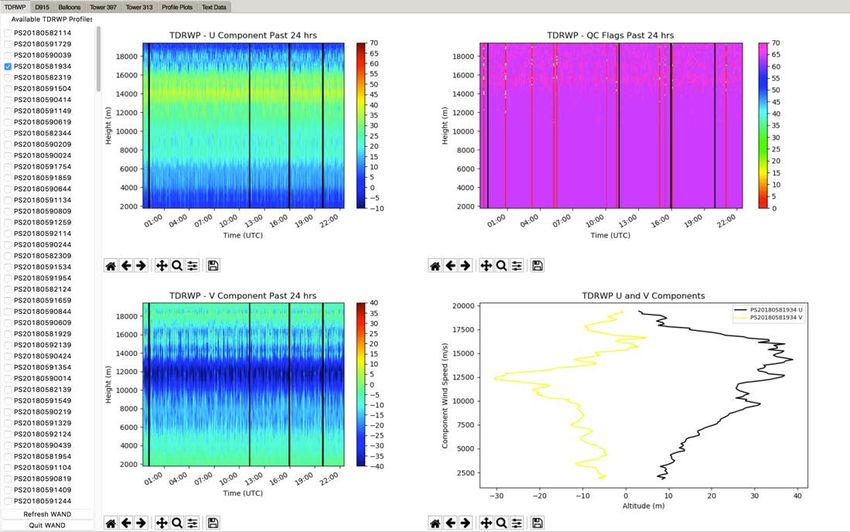
WAND Design

• This window is the initial window that appears when WAND is started.
• Allows the operator to select the desired input and output directories as well as set the
    desired angle for in-plane and out-of-plane wind component calculations.
• Clicking the “Search” button once all directories are supplied will get WAND to search for
    any data from the past 24 hours.

4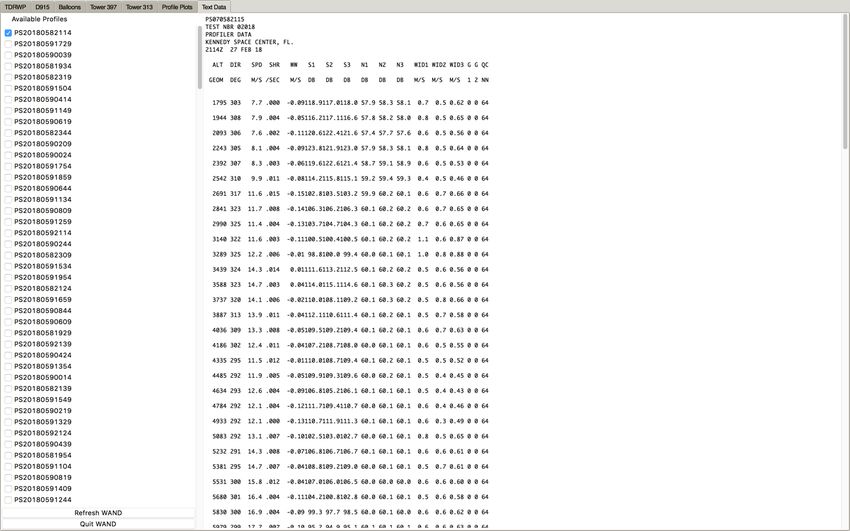
WAND Design
• WAND uses tabs to control which
     system is being displayed.
     – Tropospheric DRWP (TDRWP)
     – 915-MHz DRWP (D915)
     – Balloons
     – Tower 397 (located at the launch pad)
     – Tower 313 (located approximately 5 km from
       the launch pad)
     – Profile Plots
     – Text Data

 5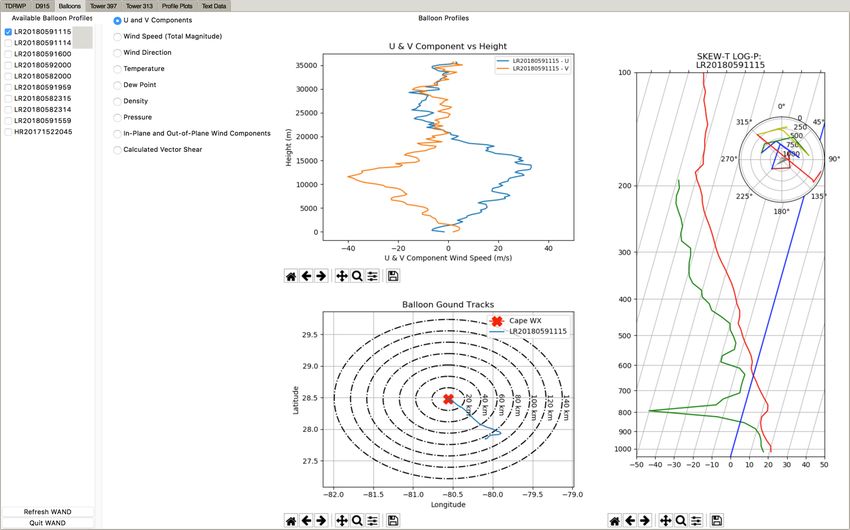
WAND Design
• WAND opens to the TDRWP tab.
• The TDRWP tab contains time-height cross-sections of the U and V wind components,
    the TDRWP’s QC flags, and profile plots of U and V.

6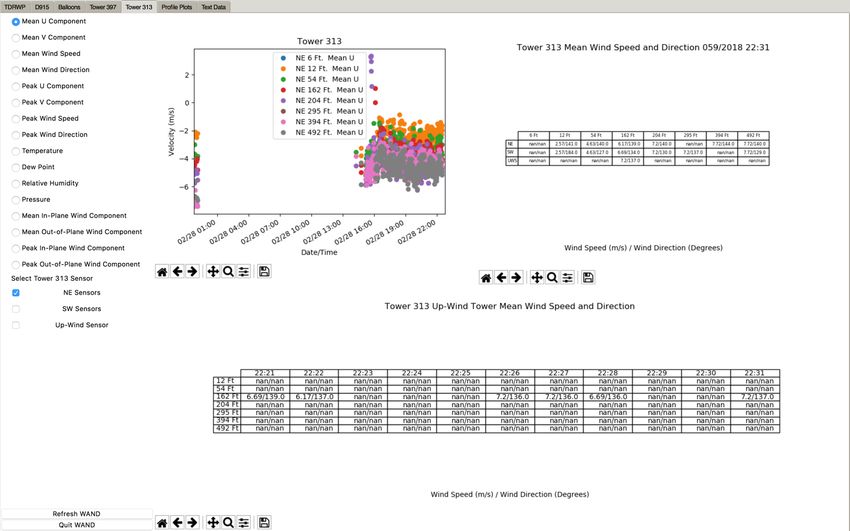
WAND Design
• The D915 tab is nearly identical to the TDRWP tab, but does not have a QC flag time-
    height cross-section plot.

7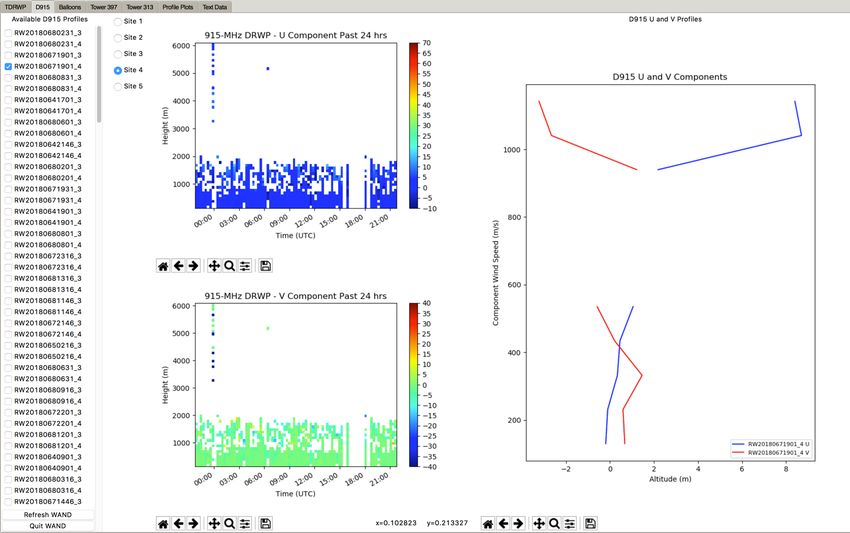
WAND Design
• The Balloons tab displays the vertical profile of all variables reported by the balloon
    systems, ground tracks of the balloons, and Skew-T Log-P.

8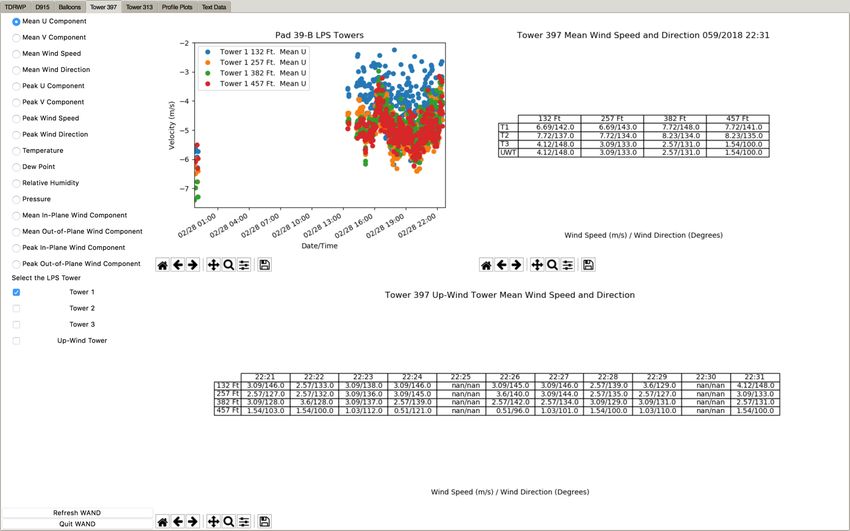
WAND Design
• The Tower 397 tab displays a time series of any variable that is measured by the towers, a table
    of the current conditions from all sensors, and a table of time series of the past 10 minutes of
    data from the up-wind tower (Orcutt et al., 2016).

9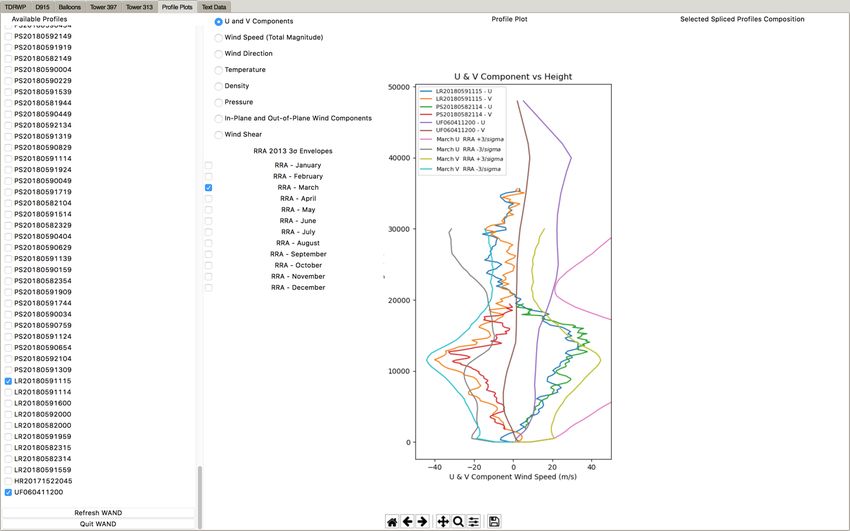
WAND Design
• The Tower 313 tab is identical in layout to the Tower 397 tab.

10
WAND Design
• The Profile Plots tab displays vertical profiles of any measurement from all of the
     DRWPs, balloons, Profile Envision and Splicing Tool (PRESTO) spliced profiles, upper
     level profiles, and statistical envelopes.

11
WAND Design • The Text Data tab displays the selected data file as text. 12
Summary
• MSFC NE developed a tool, WAND, using Python to provide DOL personnel
     with displays of the meteorological conditions at and around the launch site for
     situational awareness.
• WAND can display data from all systems at Kennedy Space Center and Cape
     Canaveral Air Force Station, as well as upper level wind forecasts and
     statistical envelopes.
• Forward work
     – Finish Formal Acceptance Testing

13
References
Orcutt, J. M., J.C. Brenton. (2016) The Quality Control Algorithms Used in the Process of Creating the NASA Kennedy Space Center
Lightning Protection System Towers Meteorological Database. Fifth Aviation, Range, and Aerospace Meteorology
Special Symposium. New Orleans, LA, Amer. Meteor. Soc. P828.
Orcutt, J. M., R.E. Barbré, J.C. Brenton, R.K. Decker. (2017) The Profile Envision and Splicing Tool (PRESTO): Developing an
Atmospheric Wind Analysis Tool for Space Launch Vehicles Using Python. Seventh Symposium on Advances in Modeling
and Analysis Using Python. Seattle, WA, Amer. Meteor. Soc.
14Questions? 15
You can also read