Find Out How You Stack Up to New Industry Benchmarks for Mobile Page Speed - Think with Google
←
→
Page content transcription
If your browser does not render page correctly, please read the page content below
Find Out How You Stack Up
to New Industry Benchmarks
for Mobile Page Speed

Published             Consumers are more demanding than ever
February 2017
                      before. And marketers who are able to deliver fast,
Topics                frictionless experiences will reap the benefits.
Mobile, Measurement
                      Global Product Lead Daniel An set out to help
                      marketers better understand how various industry
                      sectors are performing when it comes to mobile
                      page speed.

                      T
                              he average time it takes to fully load a mobile landing page is 22
                             seconds, according to a new analysis.1 Yet 53% of mobile site
                             visitors leave a page that takes longer than three seconds to load.2
                      That's a big problem.

                      It's no secret that shoppers expect a fast mobile experience. If there's too
                      much friction, they'll abandon their cart and move on. Today, it's critical
                      that marketers design fast web experiences across all industry sectors.
                      Consumers want to quickly pay bills on finance sites, get rapid results
                      when they're browsing vacation reviews, and view an article immediately
                      when they click through.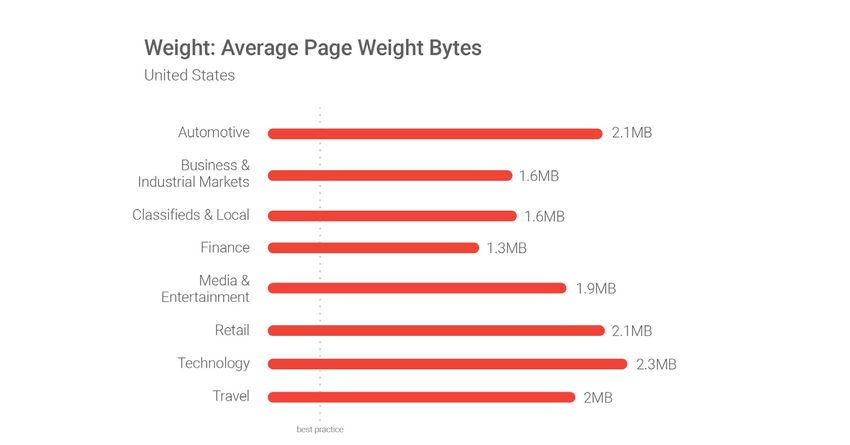
Despite the fact that more than half of overall web traffic comes from
mobile,3 our data shows that mobile conversion rates are lower than
desktop.4 In short, speed equals revenue.

Last month, in an effort to get a better sense of how Google's advertising
partners are doing, we did an analysis of 900,000 mobile ads' landing
pages spanning 126 countries.5 That new analysis confirmed our
thesis: The majority of mobile sites are slow and bloated with too many
elements.

We dug deep into a wide range of sectors, from finance to travel. Pages
from the automotive, retail, and technology sectors, on average, take the
longest to load. And they also have some of the most bloated pages on
the web.

Our research has been eye-opening. For 70% of the pages we analyzed, it
took nearly seven seconds for the visual content above the fold to display
on the screen, and it took more than 10 seconds to fully load all visual
content above and below the fold.

Recently, we trained a deep neural network—a computer system modeled
on the human brain and nervous system—with a large set of bounce
rate and conversions data. The neural net, which had a 90% prediction
accuracy, found that as page load time goes from one second to seven
seconds, the probability of a mobile site visitor bouncing increases 113%.
Similarly, as the number of elements—text, titles, images—on a page goes
from 400 to 6,000, the probability of conversion drops 95%.6

                                                                   thinkwithgoogle.com   2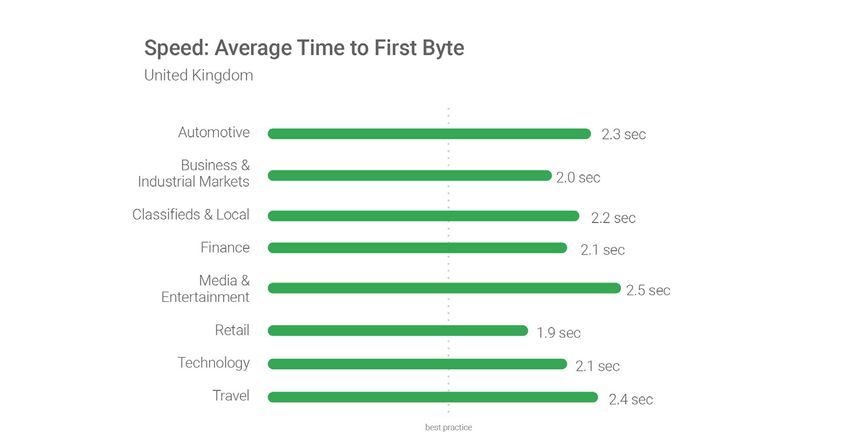
Source: Google/SOASTA Research, 2017.
No matter what, faster is better and less is more.
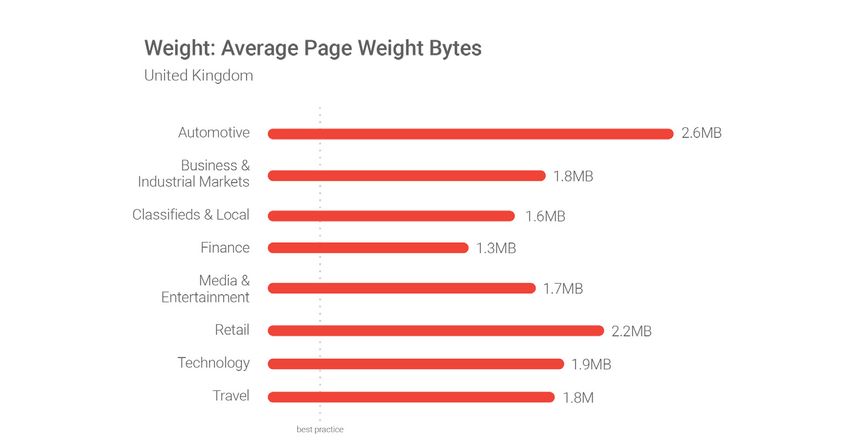
And sometimes, leaner is better too. We found that 70% of pages were
over 1MB, 36% over 2MB and 12% over 4MB. That's enormous for a single
mobile page, given that 1.49MB takes seven seconds to load using a fast
3G connection.7 One image in particular caught our attention: It weighed a
whopping 16MB.
But despite the bad news, there's plenty of low-hanging fruit. Simply
compressing images and text can be a game changer—30% of pages
could save more than 250KB that way. Our analysis shows that the
automotive, technology, and business and industrial market sectors have
the most room for improvement.
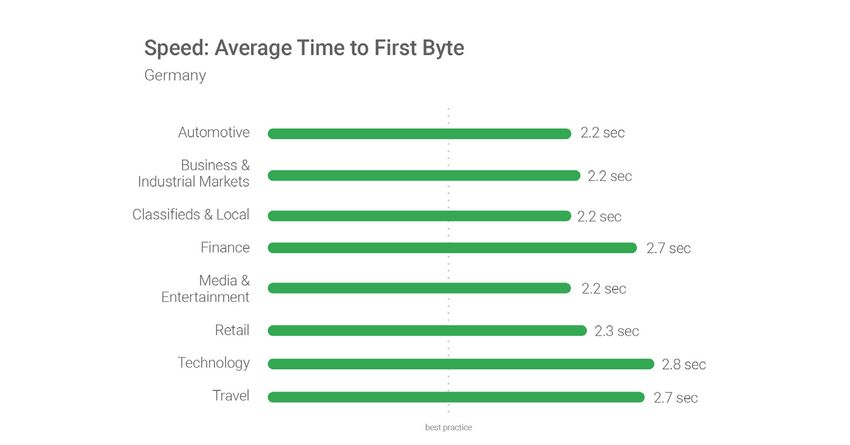
When it comes to mobile pages, speed and size matter. Marketers must
keep consumers engaged on mobile and focus on building mobile-
first experiences. You can see how your current site scores on mobile
thinkwithgoogle.com 3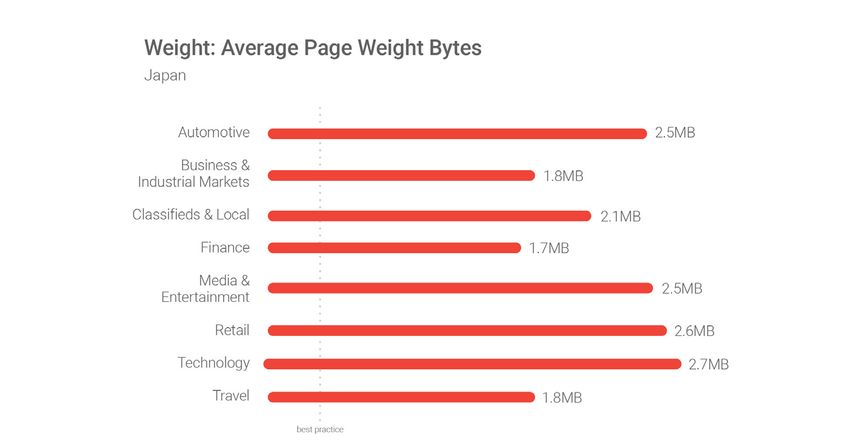
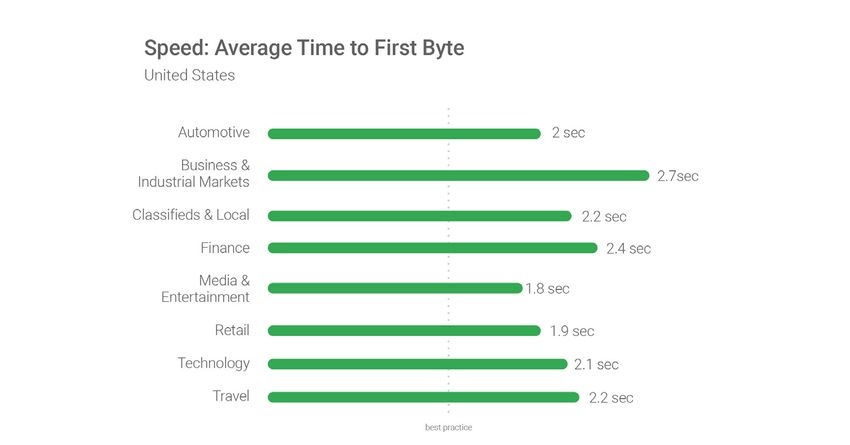
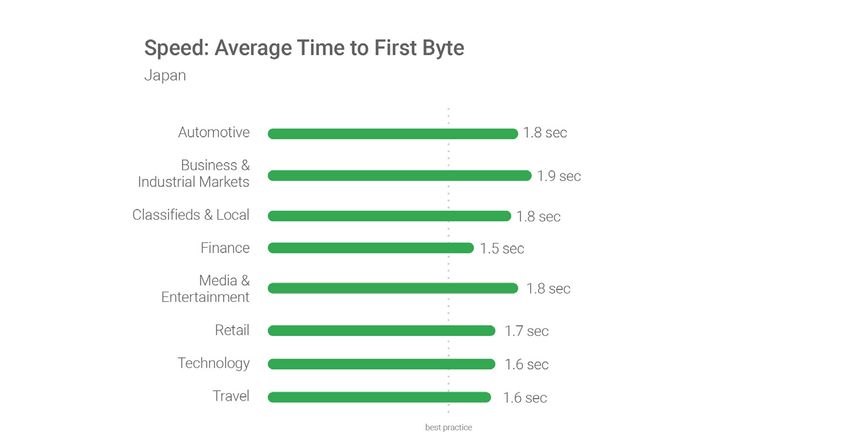
friendliness and mobile page speed at Test My Site. Then, check out the
charts below for a global perspective across industry sectors, including
guidelines for speed, web page size, and the number of content pieces per
page.

                                                                  thinkwithgoogle.com   4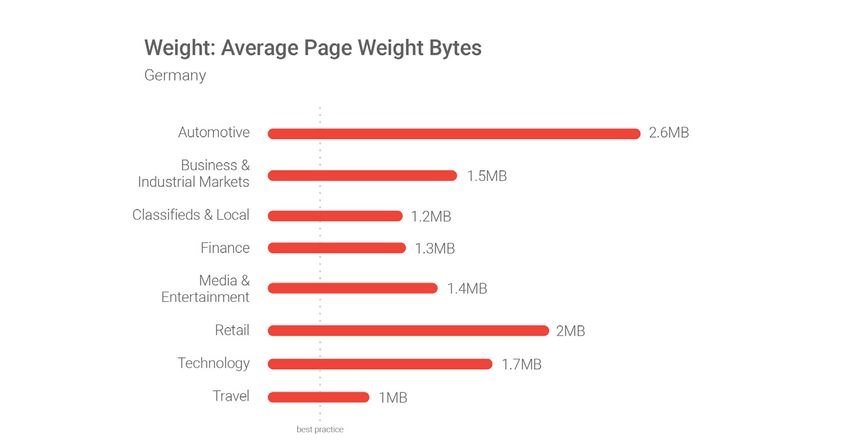
thinkwithgoogle.com 5
thinkwithgoogle.com 6
thinkwithgoogle.com 7
thinkwithgoogle.com 8
thinkwithgoogle.com 9
thinkwithgoogle.com 10
Sources
1G
  oogle Research, Webpagetest.org, Global, sample of more than 900,000 mWeb sites across
 Fortune 1000 and Small Medium Businesses. Testing was performed using Chrome and
 emulating a Nexus 5 device on a globally representative 3G connection. 1.6Mbps download
 speed, 300ms Round-Trip Time (RTT). Tested on EC2 on m3.medium instances, similar in
 performance to high-end smartphones, Jan. 2017.

2G
  oogle Data, Global, n=3,700 aggregated, anonymized Google Analytics data from a sample
 of mWeb sites opted into sharing benchmark data, Mar. 2016.

3G
  oogle Analytics data, U.S., Q1 2016.

4 Google Data, aggregated, anonymized data from Google Analytics for U.S. retailers, Apr. 2016.

5G
  oogle Research, Webpagetest.org, Global, sample of more than 900,000 mWeb sites across
 Fortune 1000 and Small Medium Businesses. Testing was performed using Chrome and
 emulating a Nexus 5 device on a globally representative 3G connection. 1.6Mbps download
 speed, 300ms Round-Trip Time (RTT). Tested on EC2 on m3.medium instances, similar in
 performance to high-end smartphones, Jan. 2017.3 Google Analytics data, U.S., Q1 2016.

6G
  oogle/SOASTA Research, 2017.

7D
  oubleClick by Google, "The Need for Speed: How Latency Impacts Publisher Revenue," Sept.
 2016.

                                                                                    thinkwithgoogle.com   11
You can also read