Transportation Barriers to Health Care Access - Identifying High Risk Areas Roy Grant, MA
←
→
Page content transcription
If your browser does not render page correctly, please read the page content below
Transportation
    Barriers to
Health Care Access
Identifying High Risk Areas

             Roy Grant, MA
        Grifin Goldsmith, MPH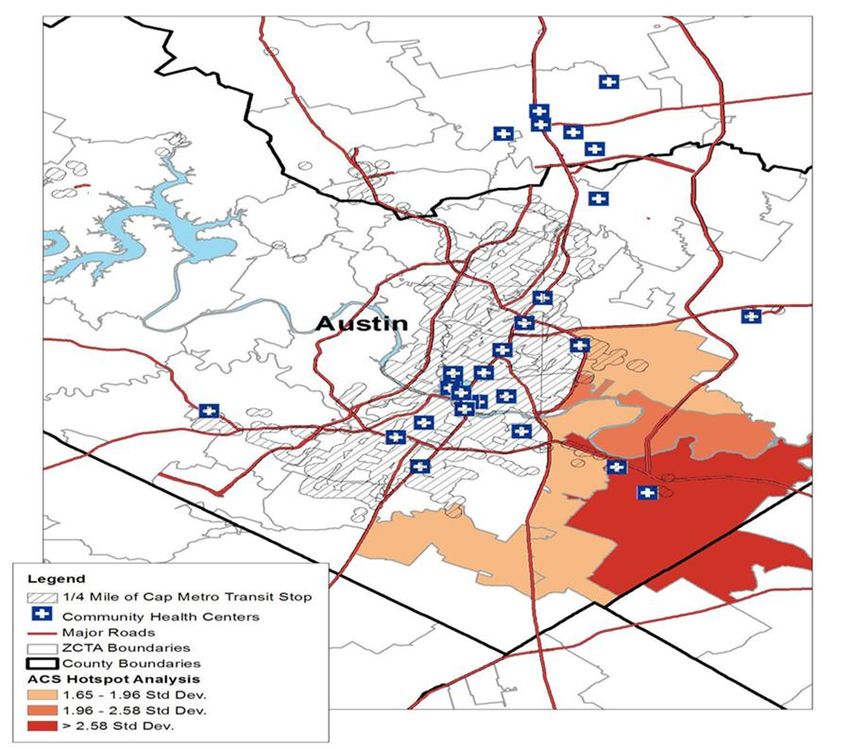
THE SCOPE OF THE PROBLEM
Many studies cite lack of transportation as a barrier
to health care access
Most were studies of adults with chronic conditions (diabetes,
kidney disease, congestive heart failure, etc.)
Children’s Health Fund conducted national and
regional research with professional survey partners
to fill this gap
Zogby International, 2000
Marist College for Public Opinion, 2006
Delta State University Delta Rural Poll, 2011
Focus was on pediatric primary care access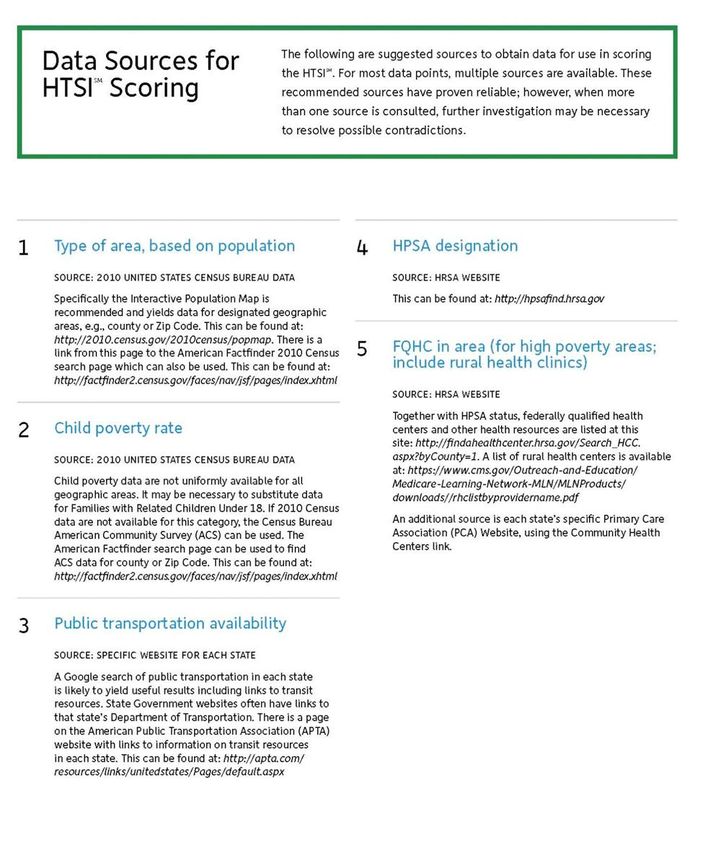
NATIONAL DATA:
USUAL SOURCE OF PEDIATRIC CARE
10% of parents reported dif ficulty finding a usual source of
pediatric care
30% for residents of rural areas and small towns
35% had to travel > 10 miles to usual source of pediatric care
Mean distance was highest in rural areas, 15 miles
53% lacked public transportation to get from home to the
child’s usual source of care
16% in rural areas and small towns identified a hospital
emergency department (ED) as usual source of care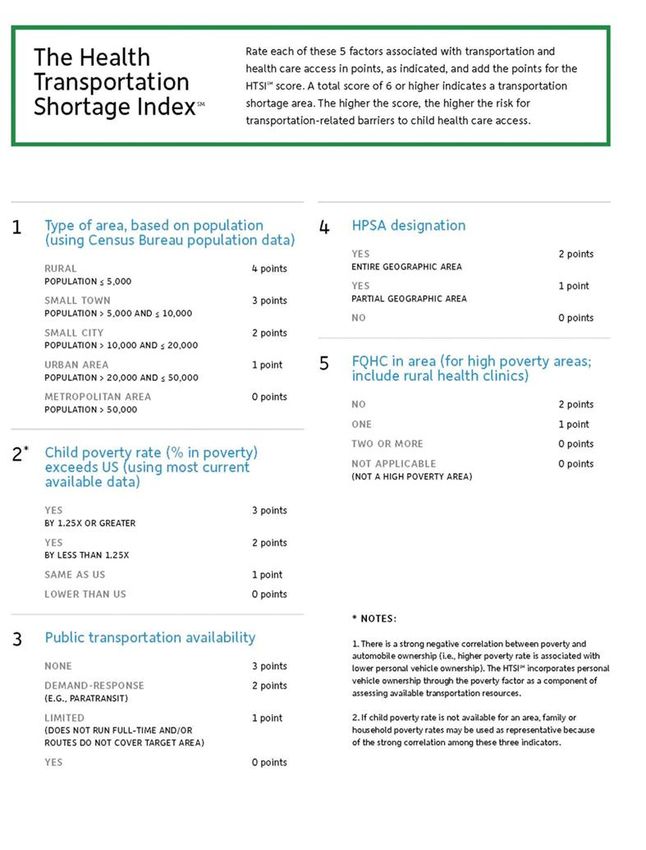
TRANSPORTATION & HEALTH CARE ACCESS Nationally 4% of children missed at least 1 health care appointment in the preceding 12 months because transportation was not available 9% for children in low-income households 31% later sought emergency care for the same condition associated with the missed health care appointment This translates to ~3 million children missing at least 1 appointment/year because of transit limitations Associated with ~900,000 potentially preventable ED visits/year
AVAILABILIT Y OF TRANSPORTATION
RESOURCES IN THE U.S.
39% did not have public transportation
available in their community
11% did not own a working vehicle
Public transportation availability varied
significantly by type of area of residence
Automobile ownership did not vary
significantly by type of area of residence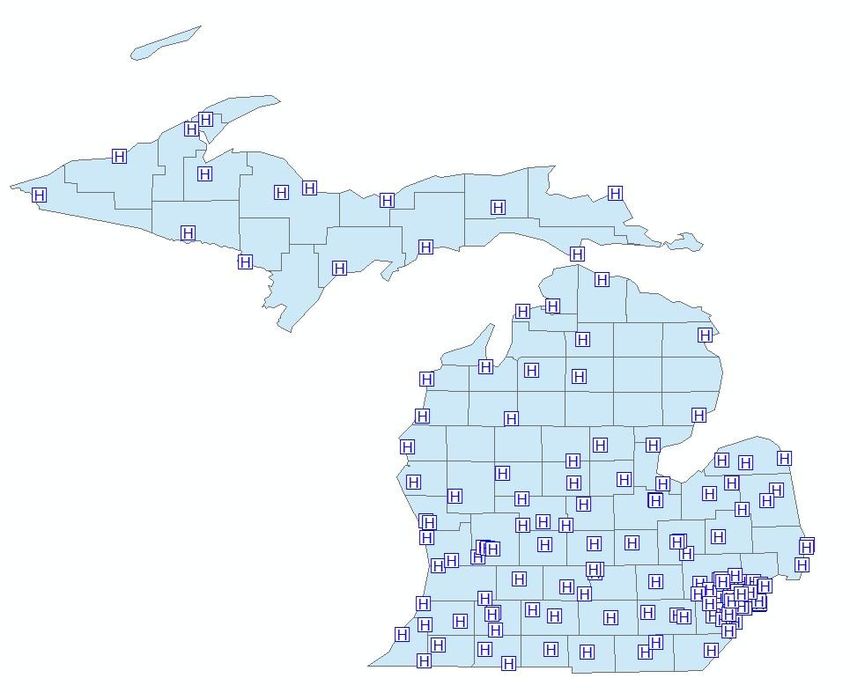
TRANSPORTATION AVAILABILIT Y BY AREA
          OF RESIDENCE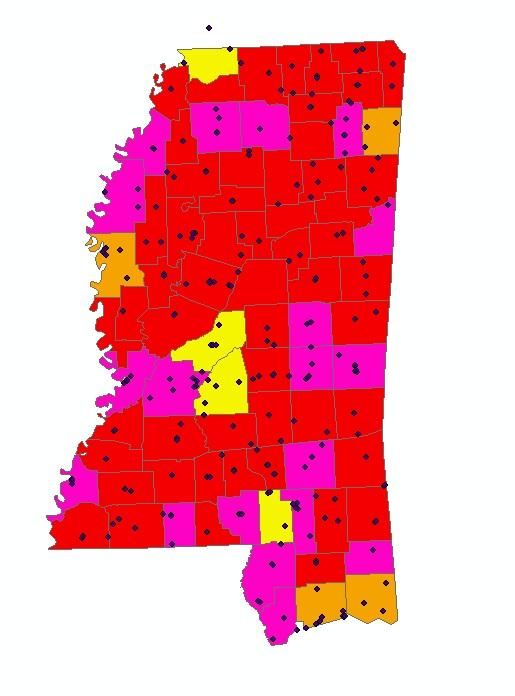
FACTORS ASSOCIATED W/TRANSIT ACCESS BARRIERS & NO USUAL SOURCE OF CARE Low income No automobile ownership Limited or no public transit in community Rural area of residence Health professional shortages Longest distances to health care sites
BASED ON THESE FACTORS CHF DEVELOPED A NEW PLANNING TOOL The Health Transportation Shortage Index (HTSI) was designed to objectively score factors associated with transportation barriers to health care access Each item is scored using data from online sources Item scores are summed for a composite HTSI sco re The HTSI was validated and a cut-score was determined through geomapping with Census Bureau demographic data and hospital discharge data for ambulatory care sensitive condition-related ED use Metro Austin (Travis County ) & Houston (Harris County) Texas
APPLYING THE HTSI:
MICHIGAN AND MISSISSIPPI
Health Transpor tation Shor tage Index factors:
Type of area…………………………………………………………..0 to 4 points
Child poverty rate………………………………………………….0 to 3 points
Public transportation availability………………………….0 to 3 points
HPSA designation………………………………………………….0 to 2 points
FQHC in area………………………………………………………….0 to 2 points
14 points
Michigan Mississippi
Population* 9,876,187 2,978,512
Counties 83 82
HTSI Range 1 – 13 1 – 13
HTSI Mean 5.988 8.037
HTSI Median 6.000 8.000
HTSI Mode 8.000 8.000
*As of July 2011; Census BureauNEXT STEP: GEOMAPPING POPULATION
AND HEALTH CARE RESOURCES
Mapping done with ArcGIS software to analyze geospatial
access
Census Bureau population data mapped by census block
Health clinic & hospital addresses mapped by longitude &
latitude
Population-weighted centroid better captured distance for
health care access compared to geographic centroid
Straight line (Euclidian) distance was calculated from
population-weighted centroid to nearest health center and
nearest hospital in the same or contiguous county
Travel distances may be greater than straight -line distancesCALCULATING THE CENTER Geographic Centroid Population-Weighted Center
GEOGRAPHIC VS. POP-WEIGHTED
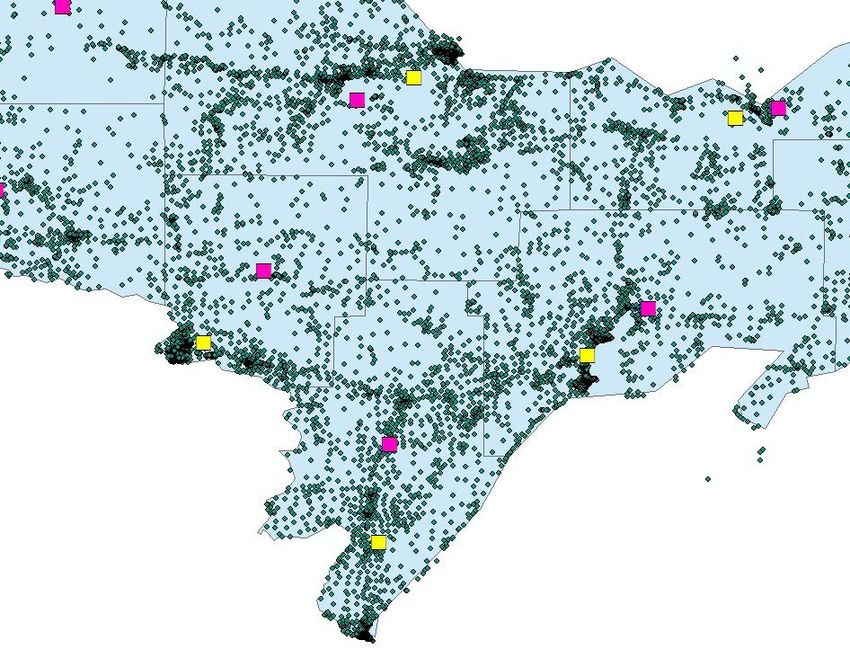
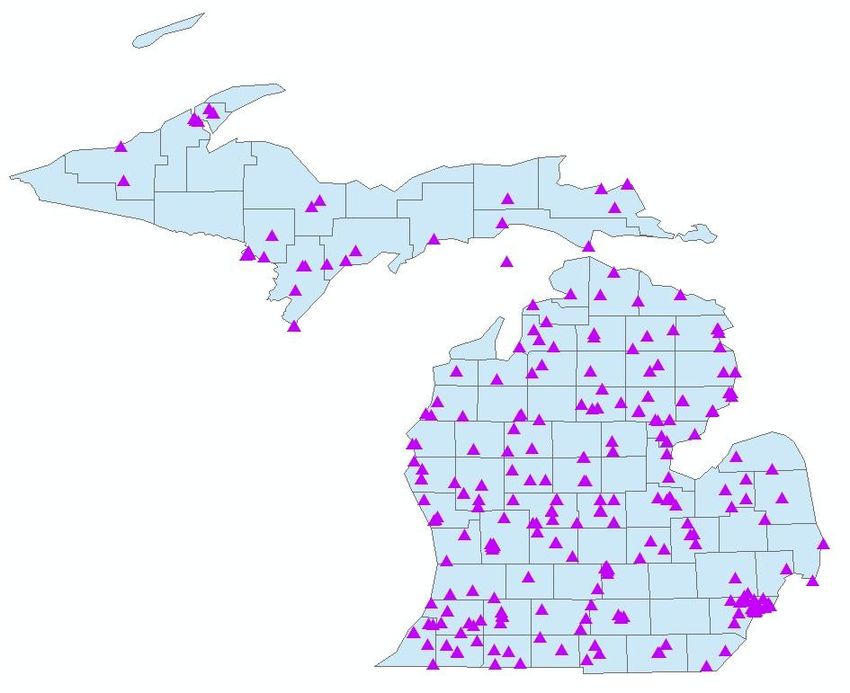
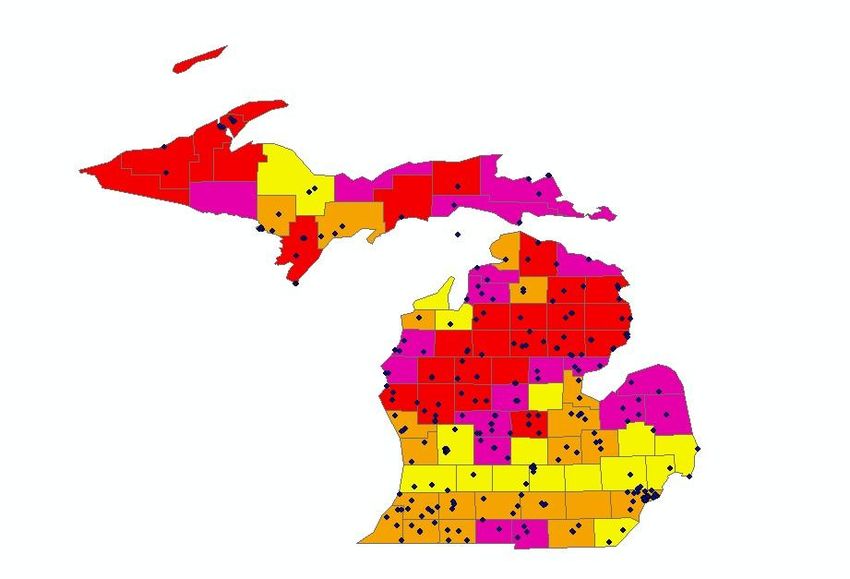
Geographic Pop-WeightedMI & MS COUNT Y HTSI SCORES
( DOT S I N DI CATE H E A LT H C E N TE RS)
HTSI:
1 to 3
4 to 5
6 to 7
8+WHAT’S UP WITH THE YELLOW?
67,077 People
Most populous in upper peninsula
Home to Northern Michigan University
(9000 students)
Median income = $35,548
DetroitWHAT’S UP WITH THE YELLOW?
Part of Memphis metro area
Highest median income in MS
$66,377
Clarksdale
Part of Jackson metro area
Median income $46,970
Median income
$44,946
Median income
$37,628
Gulf CoastHEALTH CENTERS (MICHIGAN)
HOSPITALS (MICHIGAN)
CALCULATING DISTANCE
MEAN DISTANCE BY POP-WEIGHTED &
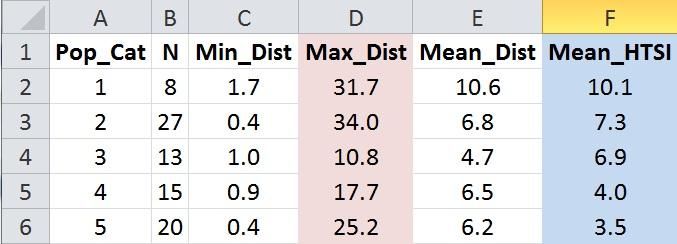
GEOGRAPHIC CENTROIDSDISTANCE TO HEALTH CENTER
STRATIFIED BY POP CATEGORY (MI)URBAN-RURAL DICHOTOMOUS VARIABLE
(MICHIGAN)
A categorical urban-rural variable was created by combining
coded county population categories
Revealed significant urban -rural dif ference in risk for
transportation as an access barrier
Categories 1 – 3 (rural to small city)……..….RURAL (pop 50,000)
MEAN HTSI SCORE FOR URBAN-RURAL POPULATIONSAPPLICATION: HEALTH CARE ACCESS
IN MISSISSIPPI
A HTSI score of 8=highest risk of access barriers
In MS, 67% of counties scored in this high -risk range
100% of these counties had limited public transpor tation
No public transit: 17%; Limited public transit: 83%
Mean child pover ty rate in these counties was 31 .8%
In 75% of these high -risk counties major population centers were
within 5 miles of a health center
In the other 25% distances ranged from 6 to 14 miles
Transpor t ser vices within a relatively narrow radius from health
centers can meet most needs
Outlying areas were up to 35 miles from a health center and require
further transportation planningQUESTIONS?
Thanks!You can also read