NWS Wilmington, Ohio June 2018 Regional Climate Summary Regional Climate Summary
←
→
Page content transcription
If your browser does not render page correctly, please read the page content below
NWS Wilmington, Ohio
June 2018
Regional Climate Summary
Regional Climate Summary
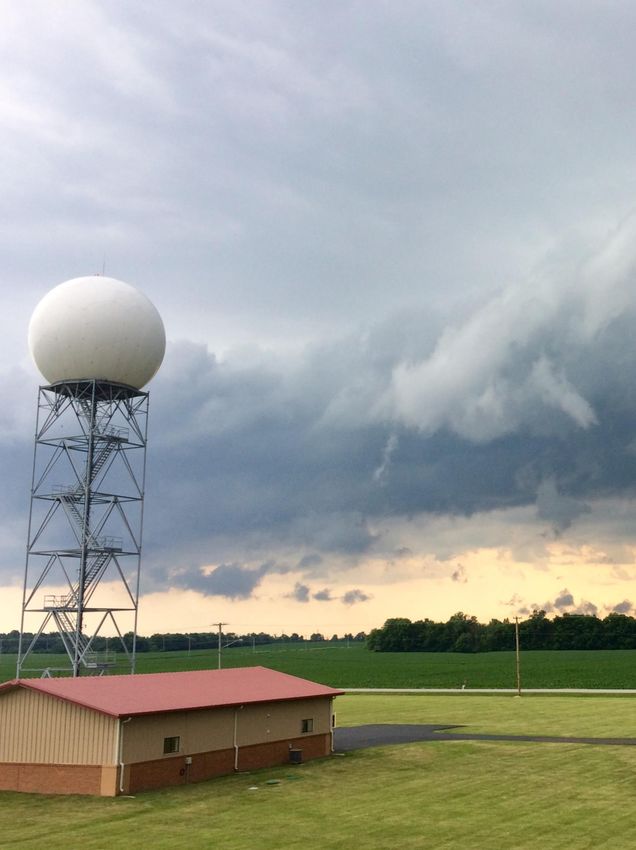
Although the weather pattern in April of 2018 was reminiscent of
winter while May’s acted more like summer, the overall pattern in
June was very much what might be expected in a typical June-time
period in the Ohio Valley. Bouts of heat and humidity led to
numerous days with isolated and scattered thunderstorms. This
activity, by its nature, was very hit-or-miss, yielding a typical
uneven rainfall footprint even over small spatial areas.
1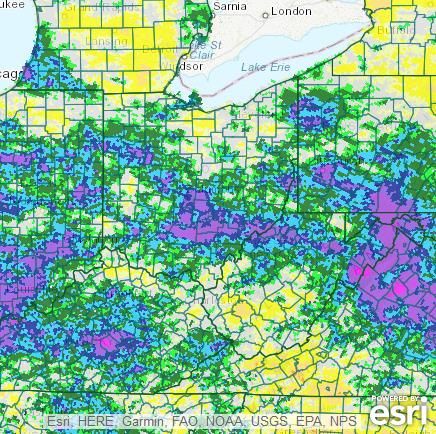
Temperatures
            The month of June 2018 started off just where May left off – with
seasonable warmth and humidity. With highs in the 70s and 80s and lows
generally in the 60s, the first week or so of the month was largely devoid of any
substantial temperature discrepancies from normal values. However, the
pattern did yield slightly warmer temperatures during the second week of the
month before an extended stretch of heat evolved toward the middle of the
month.
            By mid-June, expansive heat began to build into the region, yielding
5-7 consecutive days with highs in the 90s and lows in the upper 60s and lower
70s. The temperature at Cincinnati hit at least 90°F on 6 consecutive days,
making it the longest such occurrence in June at the site since June of 2005.
Meanwhile, a slightly wetter pattern further north inhibited 90-degree warmth
somewhat for Columbus. Although, a record high minimum of 74°F was set on
the 19th at John Glenn, breaking the old daily record of 72°F for the site which
was set in 1919.
            A somewhat cooler, although still seasonable, pattern evolved from
approximately the solstice for the next week before heat returned for the final
several days of the month. Temperatures reached into the 90s leading into the
month of July.
            Overall, the temperatures in the month were slightly above normal.

                                                   Departure From Maximum         Minimum
             Avg Temp   Avg High    Avg Low Temp
   Site                                               Normal      Temperature    Temperature
                (°F)    Temp (°F)        (°F)
                                                        (°F)         (°F)           (°F)

Cincinnati                                                        94˚F (06/17,
              75.1˚F     85.1˚F        65.1˚F         + 3.0˚F                    52°F (06/05)
  (CVG)                                                             06/18)
Columbus
              73.9˚F     83.0˚F        64.8˚F          +2.4˚F     93˚F (06/18)   50°F (06/06)
  (CMH)
 Dayton                                                           92˚F (06/18,
              73.3˚F     82.5˚F        64.2˚F         + 2.7˚F                    52°F (06/06)
   (DAY)                                                            06/30)

                                           2                                           2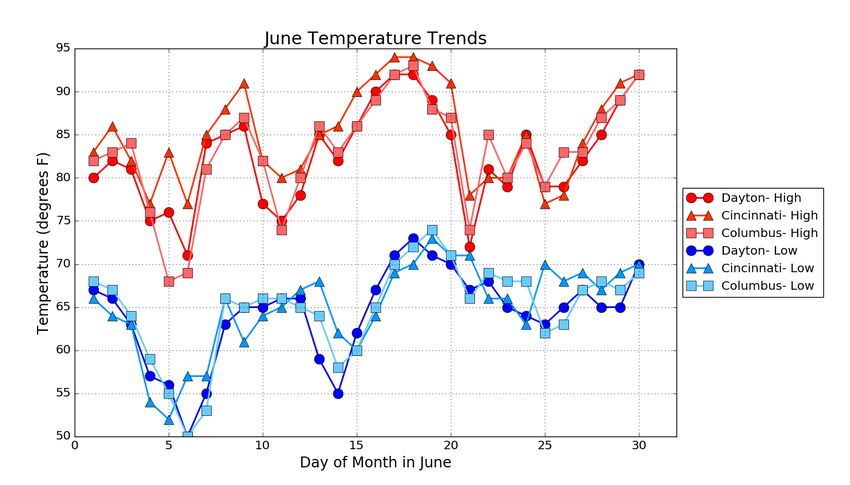
Temperatures (Continued)

     Temp Graph / Graphic #1

     Temp Graph / Graphic #2

               3               3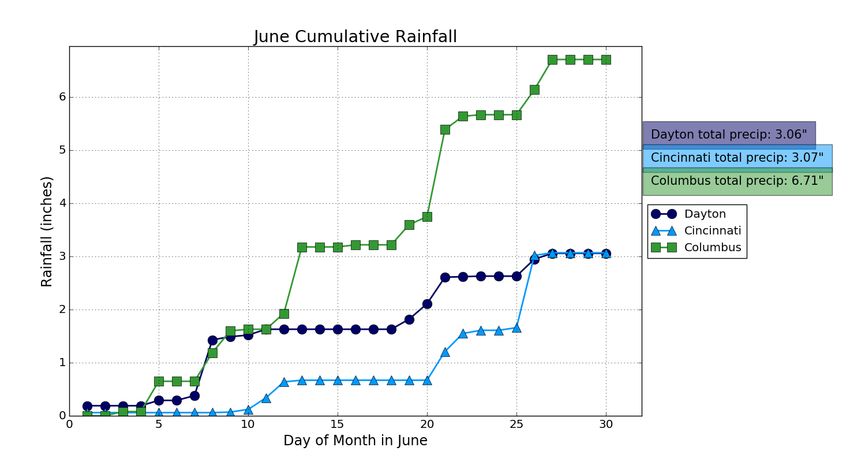
Precipitation
             As is typical in the month of June in the Ohio Valley, numerous
showers and thunderstorms yielded a very uneven rainfall footprint in the
immediate local area. There was more than one occasion where thunderstorms
yielded very heavy rainfall which led to flooding while nearby locations remained
nearly or completely dry. This being said, the first week or so of the month
featured more dry days than wet days before a somewhat wetter pattern evolved
for the remainder of the month.
             The most widespread rain event of the month occurred on the 21st as
a shield of showers with embedded thunderstorms overspread the local area
throughout the day, yielding at least ½” of rain for most of the area, with many
locations receiving an inch or more of rainfall. Significant flash flooding resulted
in eastern portions of the local area as 2-4” of rain fell throughout the day.
             Another fairly widespread soaking rain occurred on the 26th as
multiple large clusters of thunderstorms progressed west to east through the
local area during the late morning and afternoon hours. The convective nature of
the leading edge led to high rainfall rates while the trailing stratiform area
provided additional soaking rain. Again, most of the area received at least ½” of
rain, with some locations receiving 1-2.”
             The month ended on a bit of a drier note as expansive upper level
ridging suppressed thunderstorm development during the final several days of
the month. However, with 6.71” of total precipitation during the month, it was
tied for the 11th-wettest June on record at Columbus.

                        Total      Departure     Max Daily        Total
                                                                           Max Daily Snowfall
       Site         Precipitation From Normal   Precipitation   Snowfall
                                                                               (in./date)
                        (in.)         (in.)      (in./date)       (in.)

 Cincinnati (CVG)      3.07”        -0.96”      1.36” 06/26        --      --        N/A

 Columbus (CMH)        6.71”        + 2.70”     1.64” 06/21        --      --        N/A

  Dayton (DAY)         3.06”        - 1.11”     1.05” 06/08        --      --        N/A

                                              4                                            4
Precipitation (Continued)

      June Precipitation
    Departure From Normal

               5            5
July Outlook
The latest outlook from the Climate Prediction Center (CPC) indicates very high
probabilities for above normal temperatures in the region in July. However, the signal
for either above normal or below normal precipitation is not as clear or definitive.
Normal Normal
Normal Normal
Site Normal Avg Site Precipitation Snowfall
High (°F) Low (°F)
Temp (°F) (in.) (in.)
Cincinnati Cincinnati
75.9°F 85.6°F 66.1°F 3.67” --
(CVG) (CVG)
Columbus Columbus
75.2°F 84.9°F 65.5°F 4.79” --
(CMH) (CMH)
Dayton Dayton
74.1°F 83.8°F 64.5°F 4.11” --
(DAY) (DAY)
Upcoming Temperature Outlook Upcoming Precipitation Outlook
6 6Summer/Early Fall Outlook
The latest outlooks from the Climate Prediction Center (CPC) continue
to suggest favorable probabilities for above normal temperatures in
the July through September time period across much of the country,
including here in the Ohio Valley. The signal for precipitation trends,
however, remains a bit more muted than for temperatures. Data
would suggest that the eastern Ohio Valley eastward through the
southern Appalachians have slightly more favorable probabilities for
above normal precipitation than would the central or western Ohio
Valley. Nevertheless, there will undoubtedly be periods that are wetter
than others in the next 3 months and current data suggests that, as an
average, precipitation may end up being close to normal.
Three-Month (JAS) Temp. Outlook Three-Month (JAS) Precip. Outlook
7 7Severe Weather
In a typical warm and humid airmass that often settles into the
region, the month of June featured a handful of days with
afternoon and evening thunderstorms in the local area. Some
of these storms did produce instances of damaging wind and
flooding/flash flooding. Two of the most widespread instances
of strong to severe storms occurred on the 9th and again a
week later on the 16th. More detailed event summaries
(including submitted storm reports) are available by clicking on
the links above.
Plots of Local Storm Reports From 06/09. Plots of Local Storm Reports From 06/16.
8 8You can also read