Eosinophil-mediated lung inflammation associated with elevated natural killer T cell response in COVID-19 patients
←
→
Page content transcription
If your browser does not render page correctly, please read the page content below
ORIGINAL ARTICLE

2021 Sep 27. [Epub ahead of print]
https://doi.org/10.3904/kjim.2021.093

Eosinophil-mediated lung inflammation associated
with elevated natural killer T cell response in
COVID-19 patients
Dong-Min Kim1,*, Jun-Won Seo1,*, Yuri Kim2, Uni Park2, Na-Young Ha2, Hyoree Park2, Na Ra Yun1, Da Young Kim1,
Sung Ho Yoon1, Yong Sub Na1, Do Sik Moon1, Sung-Chul Lim3, Choon-Mee Kim4, Yeon-Sook Kim5, and
Nam-Hyuk Cho2

                                                      Background/Aims: Coronavirus disease 2019 (COVID-19) is associated with acute respi-
1
 Department of Internal Medicine,
Chosun University College of
Medicine, Gwangju; 2Department                        ratory syndrome. The mechanisms underlying the different degrees of pneumonia sever-
of Microbiology and Immunology,                       ity in patients with COVID-19 remain elusive. This study provides evidence that COVID-19
Seoul National University College                     is associated with eosinophil-mediated inflammation.
of Medicine, Seoul; Departments
of 3Pathology and 4Premedical                         Methods: We performed a retrospective case series of three patients with laboratory
Science, Chosun University College of                 and radiologically confirmed COVID-19 pneumonia admitted to Chosun University Hos-
Medicine, Gwangju; 5Department of
                                                      pital. Demographic and clinical data on inflammatory cell lung infiltration and cytokine
Internal Medicine, Chungnam National
University College of Medicine,                       levels in patients with COVID-19 were collected.
Daejeon, Korea                                        Results: Cytological analysis of sputum, tracheal aspirates, and bronchoalveolar lavage
                                                      fluid (BALF) samples from all three patients revealed massive infiltration of polymorpho-
Received : February 16, 2021                          nuclear cells (PMNs), such as eosinophils and neutrophils. All sputum and BALF specimens
Revised : July 7, 2021                                contained high levels of eosinophil cationic proteins. The infiltration of PMNs into the
Accepted : July 16, 2021
                                                      lungs, together with elevated levels of natural killer T (NKT) cells in BALF and peripheral
Correspondence to                                     blood samples from patients with severe pneumonia in the acute phase was confirmed
Nam-Hyuk Cho, Ph.D.                                   by flow cytometry.
Department of Microbiology
                                                      Conclusions: These results suggest that the lungs of COVID-19 patients can exhibit eo-
and Immunology, Seoul National
University College of Medicine,                       sinophil-mediated inflammation, together with an elevated NKT cell response, which is
103 Daehak-ro, Jongno-gu, Seoul                       associated with COVID-19 pneumonia.
03080, Korea
Tel: +82-2-740-8392
Fax: +82-2-743-0881                                   Keywords: COVID-19; SARS-CoV-2; Eosinophil; Natural killer T-cells; Bronchoalveolar
E-mail: chonh@snu.ac.kr                               lavage
https://orcid.org/0000-0003-3673-
6397

*These authors contributed equally
to this work.

INTRODUCTION                                                                                        (COVID-19), was identified as severe acute respiratory syn-
                                                                                                    drome coronavirus-2 (SARS-CoV-2) [2]. Today, approximate-
In December 2019, a novel coronavirus was identified as                                             ly 80% of confirmed COVID-19 cases are asymptomatic or
the cause of pneumonia in a cluster of cases in Wuhan, Chi-                                         lead to mild symptoms in infected individuals. However, in
na [1]. This virus, which causes coronavirus disease 2019                                           the remaining 20% of cases severe pneumonia often devel-

Copyright © 2021 The Korean Association of Internal Medicine                                                                                                        pISSN 1226-3303
This is an Open Access article distributed under the terms of the Creative Commons Attribution Non-Commercial License (http://creativecommons.org/licenses/by-      eISSN 2005-6648
nc/4.0/) which permits unrestricted noncommercial use, distribution, and reproduction in any medium, provided the original work is properly cited.
                                                                                                                                                                 http://www.kjim.org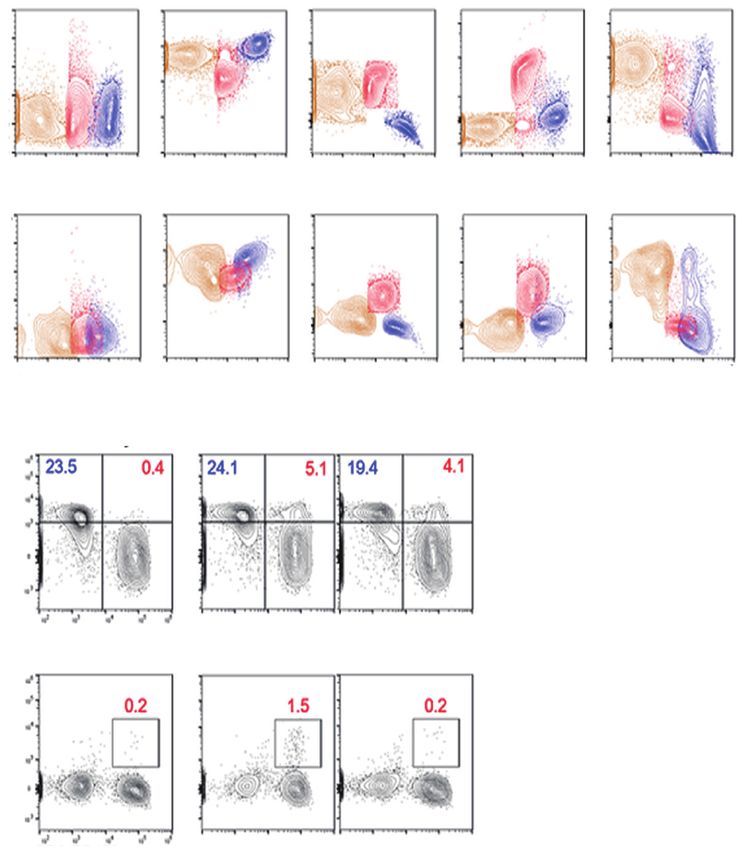
The Korean Journal of Internal Medicine. 2021 Sep 27. [Epub ahead of print]
oped, with patients requiring supplemental oxygen therapy
(20–1,280
> 40,000
aspirates
Sputum,
Eosinophil cationic
tracheal
COVID-19, coronavirus disease 2019; 25-(OH), 25-hydroxy; IgE, immunoglobulin E; BALF, bronchoalveolar lavage fluid; HTN, hypertension; DM, diabetes mellitus; PTB, pulmonary
ng/mL)
1,475
protein, ng/mL
[3,4]. The mechanisms underlying the different degrees of
637
pneumonia severity observed in patients with COVID-19 re-
main elusive.
(1–3 ng/
To characterize the cause of pneumonia in patients with
BALF
9.86
mL)
170
NA
COVID-19, we analyzed the immunological features of re-
spiratory and blood specimens collected from three patients
tracheal aspirates,
with confirmed infection by SARS-CoV-2 but varying de-
Macrophages: 3
Macrophages: 5
Macrophages: 3
Lymphocytes: 5
Lymphocytes: 5
Sputum,
Eosinophil: 90
Eosinophil: 90
Eosinophil: 97
grees of clinical symptoms: one patient with mild symptoms
%
without pneumonia and two patients with severe pneumo-
Cytological findings
nia. We analyzed plasma, leukocytes in blood, bronchoal-
veolar lavage fluids (BALFs), sputa, and tracheal aspirates to
Parasite antibody, Toxocara canis IgG/Taenia solium IgG/Clonorchis sinensis IgG/Paragonimus westermani IgG/Spirometra mansoni IgG.
Eosinophil or neutro-
Eosinophil or neutro-
characterize the immunological responses to viral infection.
Macrophages: 35
Macrophages: 45
Lymphocytes: 20
Lymphocytes: 20
We propose the possibility of one of several immune mech-
BALF, %
anisms of COVID-19 by reporting eosinophil-mediated lung
inflammation associated with elevated natural killer T (NKT)
phil: 45
phil: 35
cell response in patients with COVID-19.
NA Hydroxychloroquine
Methylprednisolone
Methylprednisolone
METHODS
Lopinavir-ritonavir
Lopinavir-ritonavir
Treatment
Ethnical statement
The present study was approved by the Institutional Re-
view Boards of Chosun University Hospital (IRB no.: 2020-
monia
Pneu-
02-011) and Seoul National University Hospital (IRB no.:
Table 1. Baseline characteristics of three patients with COVID-19 in this study
Severe
Severe
No
C-1509-103-705). This study was conducted with informed
consent from the patients or their legal guardians.
Smoking
Ex-smoker
(30 years
Patient characteristics
ago)
No
General information on the clinical courses and baseline No
characteristics of the three patients included in this study
tuberculosis; GBS, Guillain Barre syndrome; NA, not available.
(< 87 IU/
Total IgE
are summarized in Table 1 and Fig. 1A. A 79-year-old man
mL)
36.8
99.8
(P1) developed fever and headache after contact with his
daughter, who had confirmed COVID-19. A reverse tran-
antibodya
Negative
Negative
Parasite
scriptase-polymerase chain reaction (RT-PCR) test for SARS-
CoV-2 genes was performed on the first day after symptom
onset, which confirmed that P1 was COVID-19 positive.
Vitamin D
(30–100
25-(OH)
On day 5 after symptom onset, P1 was admitted to a local
ng/mL)
8.4
10
hospital and was administered lopinavir/ritonavir. On day 9,
the patient developed acute respiratory distress syndrome
(ARDS); consequently, mechanical ventilation was initiated.
Underly-
disease
Old PTB
ing
On day 12, bronchoscopy with BAL was performed. Corti-
HTN
HTN
GBS
DM
DM
P3 36/M No
costeroids were administered on day 17 based on the BALF
results. A follow-up chest X-ray was performed on day 2
Age/
P1 79/M
Sex
P2 79/F
after corticosteroid administration (Fig. 1B), which showed
significant improvement in pneumonic infiltration and a
ID
a
2 www.kjim.org https://doi.org/10.3904/kjim.2021.093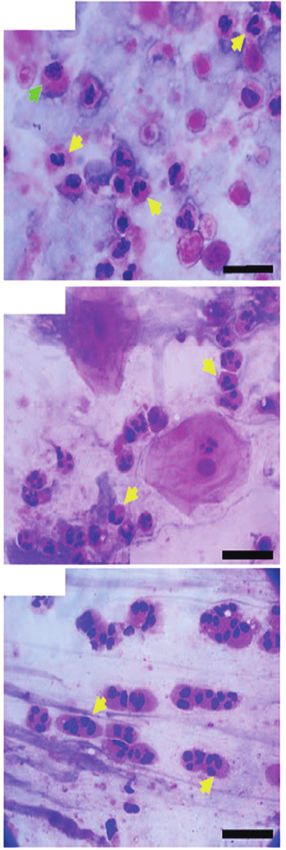
Kim DM, et al. Eosinophil-mediated inflammation in COVID-19
Days after symptom onset
0 5 10 15 20 25 30
P1
(79/M)
P2
(79/F)
P3
(36/M)
A Symptom onset Pneumonia observed Bronchoscopy Tracheostomy
Mechanical ventilation Anti-viral therapy Steroid therapy
P1: D12
P1
P2 P2: D2
P3
P3: D3
25
P1
20
Radiographic score
P2
15
P3
10
5
0
B 0 5 10 15 20 25
C
Days after symptom onset
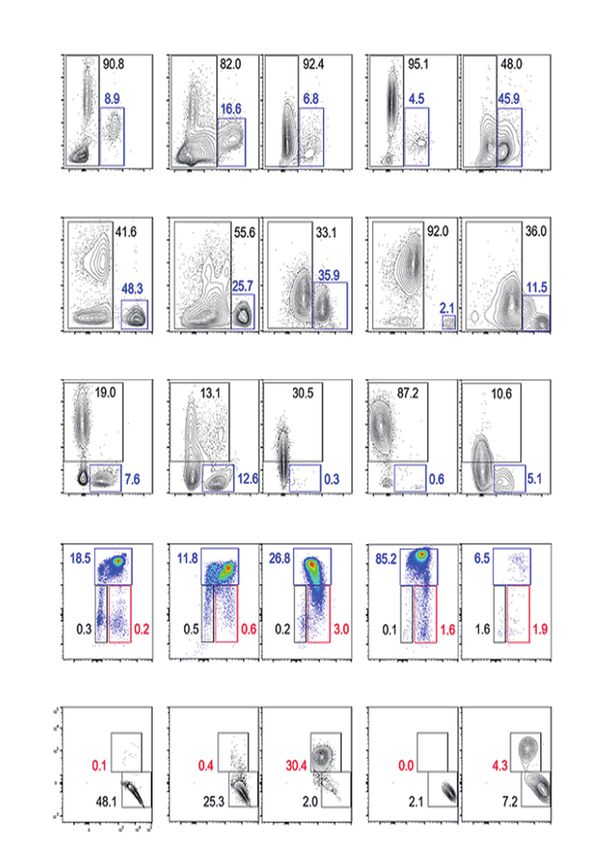
Figure 1. Clinical courses of three coronavirus disease 2019 (COVID-19) patients enrolled in the present study. (A) Schematic diagram
of the clinical course of the patients and the administered treatments. (B) Representative chest images (upper images) and radiographic
scores (lower graph) of patients with COVID-19. Images were acquired on the indicated days after symptom onset. Brown arrowheads
indicate the commencement of steroid therapy. (C) Representative images of the cytological analysis of bronchoalveolar lavage fluid (P1,
upper) and sputum (P2, middle; P3, lower) specimens by H&E staining. Images were acquired on the indicated days after symptom onset.
Arrows indicate polymorphonuclear cells (yellow) and macrophages (green). Scale bar: 20 µm.
https://doi.org/10.3904/kjim.2021.093 www.kjim.org 3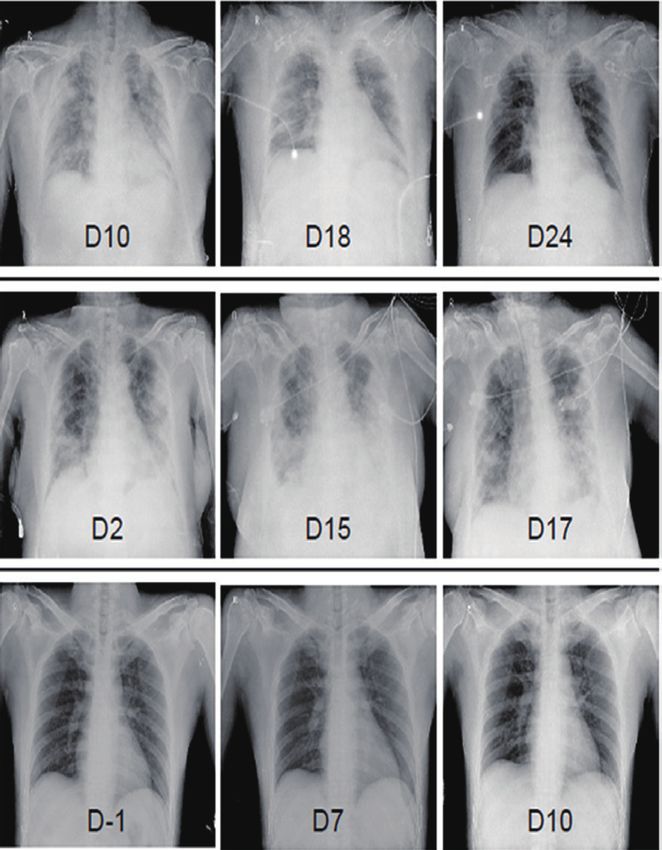
The Korean Journal of Internal Medicine. 2021 Sep 27. [Epub ahead of print]

decrease in O2 demand (fraction of inspired oxygen [FiO2],           cells that had infiltrated the infected lungs. The cytological
from 0.8 to 0.4. A 79-year-old woman (P2) was confirmed              analyses of BALF and sputum were performed using hema-
to be COVID-19 positive and asymptomatic. Two days lat-              toxylin and eosin (H&E) staining, which showed that poly-
er, the patient developed dyspnea with gradual aggrava-              morphonuclear cells (PMNs), especially eosinophils or neu-
tion and showed an increase in O2 demand. She had fever              trophils, were the major inflammatory cells, along with a
(38.3°C) and showed pneumonic infiltration in both lung              few macrophages and lymphocytes (Table 1 and Fig. 1C).
fields (Fig. 1B). Mechanical ventilation was initiated at an O2      BALF analysis of the two patients that developed severe
saturation of 85% due to persistent hypoxemia despite the            pneumonia (P1 and P2) showed that lymphocytes account-
application of high-flow nasal cannula therapy. Lopinavir/           ed for 20% and PMNs accounted for more than 35% of
ritonavir was administered from the first day of symptom             the inflammatory cells. Eosinophils accounted for more than
onset, but there was no change in the severity of pneumo-            25% of the PMNs. Eosinophils constituted less than 1% of
nia. Therefore, bronchoscopy with bronchoalveolar lavage             BALF obtained from healthy individuals. Acute eosinophilic
was performed on day 13. On day 14, corticosteroids were             pneumonia is diagnosed when eosinophils constitute more
administered based on BALF results. Follow-up chest radiog-          than 25% of the BAL differential count in the absence of
raphy was performed on day 16 (Fig. 1B), which indicated             other causes of BALF eosinophilia, such as asthma or atopic
signs of pneumonia resolution. Although a sharp increase in          disease, and drugs [6]. Our study revealed that COVID-19
blood sugar levels was observed following steroid adminis-           could cause eosinophil-mediated inflammation in the lungs,
tration, the O2 demand decreased (FiO2 from 0.7 to 0.4). A           similar to acute eosinophilic pneumonia.
36-year-old man (P3) with no underlying disease conditions              Cytological analysis of sputum and tracheal aspirates
and symptoms visited the COVID-19 screening clinic because           collected from the three patients revealed that more than
he had returned from a COVID-19 endemic country. RT-PCR              90% of the cells were eosinophils (Table 1 and Fig. 1C).
analysis confirmed that the patient was COVID-19 positive.           Notably, a sputum sample was collected from P3 (who did
At the time of hospitalization, pneumonia was not detected           not develop pneumonia) on day 3, after symptom onset,
on chest radiography (Fig. 1B) or high-resolution computed           also showed high levels of eosinophils. Additionally, a spu-
tomography. The patient complained of a sore throat the              tum sample obtained from P2, who rapidly developed se-
day after admission and developed a fever (approximately             vere pneumonia on day 2, also contained a large number of
38°C). Hydroxychloroquine treatment was initiated on day 4           PMNs (Table 1 and Fig. 1C). Therefore, infiltration of PMNs
when P3 developed a productive cough with fever.                     into infected lungs might be rapid and universal in patients
   Chest radiographic scores were calculated using X-rays.           with COVID-19, regardless of the severity of pneumonia.
The scores were calculated by dividing each lung into the               Based on the cytological analysis, we suspected that
upper, middle, and lower zones. Each zone was assigned a             among the other PMNs, eosinophils infiltrated the lungs.
score from 0 to 4 points based on the degree of infiltration.        Therefore, we measured the levels of eosinophil cationic
The scores for the six zones were then tallied, yielding a total     proteins (ECPs) in the respiratory specimens. The sputum
score ranging from 0 to 24 [5]. All remaining experimental           and BALF specimens from the three patients contained high
methods are listed in the Supplementary methods.                     levels of ECP (Table 1), which indicated the infiltration of
                                                                     eosinophils into the inflamed lungs during the acute phase
                                                                     of COVID-19. To further characterize the PMNs infiltrating
RESULTS                                                              the pneumonic lungs, BALF was collected from P1 on day
                                                                     12 (acute phase) and 19 days (convalescent phase) after
The clinical courses and baseline characteristics of the three       symptom onset and subjected to cytometric analysis. Pe-
patients are summarized in Table 1 and Fig. 1A. P1 and P2            ripheral blood collected from P2 on day 12 (acute phase)
had severe pneumonia and required mechanical ventilation             and P1 on day 19 (convalescent phase) after symptom on-
(Fig. 1B). P3 had only mild symptoms, without pneumonia.             set were simultaneously used for flow cytometric analysis
None of the three patients had a history of eosinophilia due         of leukocytes. We identified the relative proportions and
to conditions, such as asthma, or allergy.                           kinetic changes in CD14+ monocytes/macrophages, CD3+ T
   Initially, we analyzed BALFs and sputa to identify immune         cells, CD20+ B cells, and side scatter (SSC)high/CD24+ PMNs,

4       www.kjim.org                                                                            https://doi.org/10.3904/kjim.2021.093
Kim DM, et al. Eosinophil-mediated inflammation in COVID-19
including neutrophils and eosinophils, in the blood leuko- creased during the acute phase and increased during the
cytes and BALF (Supplementary Fig. 1). The BALF from P2 convalescent phase. Although very few B cells were de-
showed a marked decrease in the number of CD45+ leuko- tected in the BALF during the acute phase, their numbers
cytes during the convalescent phase (~2.5 × 10³/mL) of the increased in the convalescent phase. Interestingly, most T
disease, compared to that in the acute phase (~1.3 × 10⁵/ cells in the acute phase BALFs showed intermediate levels of
mL). Similar to the cytological analysis of BALF, the relative surface CD3 molecules compared to those of blood T cells,
proportion of PMNs in the CD45+ leukocyte populations (af- indicating the presence of other types of CD3+ lymphocytes.
ter excluding macrophages, T cells, and B cells) increased in We assessed the surface expression of other cellular mark-
the acute phase (30.5%) and decreased to 10.6% in the ers, such as CD24, CD16, and human leukocyte antigen DM
convalescent phase. Although the PMNs in BALF collected (HLA-DM), and found that the majority of the CD3+ T cells
during the acute phase were primarily composed of CD16+/ in the acute phase of BALF were CD16+/CD24+/HLA-DM-
CD24+ neutrophils (26.8% in CD45+ leukocytes), approxi- cells, suggesting a predominantly NKT cell population (the
mately 10% (3.0% in CD45+ leukocytes) of the PMNs were last row of Supplementary Figs. 1 and 2A) [7,8]. An increase
likely to be CD24+ eosinophils with reduced expression of in the number of NKT cells expressing both CD3 and CD56
CD16 on the surface (Supplementary Fig. 1) [6]. Monocytes in the patient’s blood during the acute phase was further
in the peripheral blood increased during the acute phase confirmed by flow cytometric analysis (Fig. 2A, 2B, and Sup-
but decreased during the convalescent phase. However, plementary Fig. 2B) of peripheral blood mononuclear cells
of the total leukocytes in the BALF, monocyte counts de- (PBMCs). The relative levels of CD3+/CD56+ NKT cells were
8 NKT 2.0 iNKT 10 a a 3
% In lymphocytes
% In lymphocytes
% In lymphocytes
% In lymphocytes
6 1.5 8 a a
2
4 1.0 6
2 0.5 4
1
0 0 2
0 0
0 5 10 15 20 0 5 10 15 20
H A C H A C
A Days after symptom onset Days after symptom onset B NKT iNKT
15 15 15 15 P1
IgG1 IgG3 IgA IgE
Log2(anti-N Ab titer)
Log2(anti-N Ab titer)
Log2(anti-N Ab titer)
Log2(anti-N Ab titer)
P2
10 10 10 10 P3
5 5 5 5
0 0 0 0
10 20 30 40 50 10 20 30 40 50 10 20 30 40 50 10 20 30 40 50
C Days after symptom onset Days after symptom onset Days after symptom onset Days after symptom onset
Figure 2. Kinetic changes in natural killer T (NKT) cell frequencies in peripheral lymphocytes and severe acute respiratory syndrome coro-
navirus-2 (SARS-CoV-2) N-specific antibodies in the plasma from patients with coronavirus disease 2019 (COVID-19). (A) Kinetic changes
in the relative frequencies of CD3+/CD56 - NKT and CD3+/CD1d-tetramer+ invariant NKT (iNKT) cells among the lymphocytes from the
indicated patients. The relative frequencies of each immune cell type from three healthy volunteers were used as controls (open circles).
(B) The relative frequencies of CD3+/CD56+NKT and CD3+/CD1d-tetramer+ iNKT cells among the lymphocytes from the indicated patients
were rearranged based on the collection periods; i.e., acute phase (A) and convalescent phase (C), and compared using one-way analysis
of variance (ANOVA) followed by Newman-Keuls t test. The relative frequencies of each immune cell type from three healthy volunteers
were considered as controls (H, open circles). Black bars indicate the mean value, and p values were obtained using ANOVA followed by
Newman-Keuls t test. (C) Kinetic changes in specific antibodies against the viral N protein are presented. The specific isotypes of the an-
tigen-specific antibodies have been indicated. Ig, immunoglobulin. ap < 0.01.
https://doi.org/10.3904/kjim.2021.093 www.kjim.org 5
The Korean Journal of Internal Medicine. 2021 Sep 27. [Epub ahead of print]

6.4-and 2.5 times higher in the patients’ blood lymphocytes          neutrophils with very few lymphocytes and macrophages.
during the acute phase (5.8% ± 1.3%, mean ± standard de-             Although these studies did not investigate the role of eosin-
viation) than in healthy controls (0.9% ± 0.8%) and patients         ophils, our current data indicate the potential involvement
in the convalescent phase (2.3% ± 1.3%), respectively. Ad-           of eosinophil-mediated inflammation in COVID-19 patients.
ditionally, the CD3+/CD1d-tetramer+ NKT (invariant NKT                  Eosinophils are known to play a role in the immune re-
[iNKT]) [9] cells at acute phase (1.3 ± 0.4) were significantly      sponse against various viral infections. Fraenkel et al. [13]
elevated by 4.3 and 1.6 times compared to those of healthy           reported that the common cold, caused by rhinovirus, is as-
controls (0.3 ± 0.1) and convalescent phase (0.8 ± 0.1), re-         sociated with eosinophilic infiltration of the bronchial muco-
spectively (Fig. 2A, 2B, and Supplementary Fig. 2B). Howev-          sa. Harrison et al. [14] also showed that respiratory syncytial
er, the levels of CD3-/CD56+ NK cells in the peripheral blood        virus (RSV) infection induced ECP production in the lower
changed depending on the individual cases (Supplementary             airway and suggested that eosinophil degranulation plays a
Fig. 2B and 2C). Quantitative changes in the NKT cell popu-          role in the pathogenesis of respiratory infection by RSV. In
lation were consistently observed in the three patients, sug-        other words, given the various roles that eosinophils play in
gesting that upregulation of the NKT cell population might           host immune responses, it may be suggested that viral infec-
be a common phenotype initiated upon SARS-CoV-2 infec-               tions cause an increase in eosinophil counts at the site of in-
tion regardless of disease severity. Furthermore, compared           fection. Jeon et al. [15] reported a case of acute eosinophilic
to the other lymphocytes, the relative frequency of NKT cells        pneumonia associated with influenza A (H1N1) infection in
among lymphocytes decreased during the convalescent                  2009. Subsequently, LeMessurier et al. [16] showed that
phase, which suggests that the kinetic changes in NKT cells          eosinophils contribute to antiviral host defense mechanisms
might be correlated with disease progression.                        against respiratory infections caused by the 2009 influenza
                                                                     A (H1N1) infection.
                                                                        Cavalli et al. [17] showed that the relative proportions of
DISCUSSION                                                           infiltrating immune cells, such as NKT cells and eosinophils,
                                                                     in the lungs of COVID‑ 19 patients. These findings are con-
Significant elevation and infiltration of NKT cells and PMNs,        sistent with the results of our study. Their study showed that
including neutrophils and eosinophils, into the lungs of pa-         there was a moderate and insignificant increase in NKT cells
tients with COVID-19 during the acute phase of infection             in the lungs of COVID-19 patients. In addition, eosinophils
indicated that these innate immune cells might be the initial        also showed a non-significant increase [17]. However, the
mediators of pulmonary inflammation. This type of immuno-            role of NKT cells in early eosinophilic infiltration has been
pathological response appears to commonly occur primarily            previously reported in a mouse model of allergic asthma and
in patients with symptomatic COVID-19 regardless of dis-             neonatal RSV infection [18,19]. Moreover, CD3+CD16/56+
ease severity, as a similar degree of eosinophilic infiltration      NKT cell levels were positively correlated positively with the
was observed in P3, who did not have pneumonia. Several              percentage of eosinophils in BALF specimens from patients
studies have recently been published on the composition              with eosinophilic pneumonia [20]. Although the association
of inflammatory cells in the BALF of individuals with severe         between elevated NKT cells and the pathogenesis of eosin-
COVID-19. Dentone et al. [10] reported that neutrophils              ophil-mediated inflammation is poorly understood, it may
and macrophages were the major cell types in the BALF of             depend on the underlying airway epithelial injury caused
patients with severe COVID-19, whereas lymphocytes were              by SARS-CoV-2 infection [21]. Subsequently, eosinophilic
a minority. Furthermore, they identified a correlation be-           infiltration and degranulation appear to mediate lung in-
tween the percentage of macrophages in the BALF and pa-              flammation and are associated with clinical manifestations
tient mortality [10]. Liao et al. [11] reported that the BALF of     [22]. Peripheral blood eosinophilia may initially present as
patients with severe COVID-19 had higher levels of macro-            eosinophil-mediated inflammation; however, it may also be
phages and neutrophils and lower proportions of T and NK             absent or delayed [22], as consistently observed in patients
lymphocytes than those of patients with moderate disease             diagnosed with COVID-19 (see complete blood count [CBC]
severity. Pandolfi et al. [12] performed a BALF analysis of          results in Supplementary Fig. 3) [23].
patients with severe COVID-19 and observed high levels of               As eosinophil-mediated inflammation in the lungs is asso-

6       www.kjim.org                                                                             https://doi.org/10.3904/kjim.2021.093
Kim DM, et al. Eosinophil-mediated inflammation in COVID-19

ciated with T-helper type 2 (Th2)-polarized immune respons-       patients need to be conducted, targeting eosinophilia and
es [22], we next assessed viral antigen-specific antibody re-     NKT cell response in the pulmonary tract [28-30]. Addition-
sponses and focused on specific isotypes. We speculated           ally, rapid and strong elevation of anti-viral antibodies, such
that specific immune responses against the SARS-CoV-2             as IgE, as we observed in a patient with severe COVID-19,
antigen are orchestrated by a Th2-biased immune environ-          must be taken into consideration for plasma therapy (i.e.,
ment, which can drive the preferential isotype switching of       potential risk of type I hypersensitivity) [31].
specific antibodies in B cells toward specific subclasses, such      This study had several limitations. As the study data con-
as immunoglobulin A (IgA) and IgE [24]. There was an in-          sisted of a case series of only three patients and the data
crease in the levels of anti-N protein antibodies, including      was collected retrospectively, other important clinical vari-
IgG1, IgG3, IgA, and IgE isotypes (IgG2 and IgG4 were not         ables that contribute to the differential diagnosis of other
detected) in the plasma from P1 and P2, who had severe            obvious causes of eosinophilia, such as thyroid disease, par-
pneumonia, whereas only moderate levels of IgG1 and IgG3          asite infection, malignancy, and allergic disease, may have
antibodies were observed in P3 with mild symptoms (Fig.           been missed.
2C). Moreover, IgA and IgE antibodies were not detected              Notwithstanding these limitations, the results of our study
at P3.                                                            showed that COVID-19 can lead to eosinophil-mediated in-
   The administration of steroids in patients infected with       flammation via systemic elevation of NKT cells. The infiltra-
other coronaviruses, such as Middle East respiratory syn-         tion of NKT cells into infected lungs may be associated with
drome (MERS) or SARS-CoV-1, resulted in delayed viral             COVID-19 pneumonic inflammation.
clearance with other short- and long-term side effects [25].
The World Health Organization (WHO), Centers for Dis-
ease Control and Prevention (CDC), and Infectious Disease          KEY MESSAGE
Society of America (IDSA) guidelines do not recommend
the treatment of COVID-19 patients with glucocorticoids,              1. We report an association between eosinophilic
                                                                         pulmonary inflammation and elevated natural killer
unless indicated otherwise, such as that during COPD ex-
                                                                         T (NKT) cell responses in three patients with coro-
acerbation, until the Randomised Evaluation of COVID-19
                                                                         navirus disease 2019 (COVID-19). Systemic increase
Therapy trial (RECOVERY) trial was published [26]. However,
                                                                         in NKT cells and their infiltration into infected lungs
systemic glucocorticoid therapy is generally considered the
                                                                         may be associated with eosinophilic lung inflam-
main treatment for acute eosinophilic pneumonia [22]. Con-
                                                                         mation in patients with COVID-19.
sequently, we assumed that in patients with COVID-19, the
                                                                      2. The pathogenesis of severe COVID-19 pneumonia
systemic steroid (dexamethasone) that was used in the RE-
                                                                         remains unknown. We describe the role of NKT
COVERY trial might have had a therapeutic effect on eosin-
                                                                         cells and eosinophils in the pathogenesis of severe
ophil-mediated lung inflammation via the above-mentioned
                                                                         COVID-19 pneumonia. Our study results provide
mechanism. In our study, methylprednisolone was admin-
                                                                         preliminary evidence in support of steroid adminis-
istered to patients with rapid and progressive pneumonia
                                                                         tration in patients with severe COVID-19 pneumo-
(P1 and P2); their oxygen demand decreased substantially
                                                                         nia, although further follow-up studies are needed.
and there was an improvement in their X-ray findings, al-
though the blood glucose levels rose to 400 to 500 mg/dL.
This improvement was suspected to be the result of the ste-       Conflict of interest
roid administration. Moreover, an analysis of 201 COVID-19        No potential conflict of interest relevant to this article was
patients from Wuhan indicated a reduction in the mortality        reported.
risk for patients with ARDS treated with methylprednisolone
[27]. The ability of steroid treatment to decrease the mortal-    Acknowledgments
ity risk in patients with COVID-19 suggests that COVID-19         This study was supported by a research fund from the
associated pneumonia is, in fact, an eosinophilic pulmonary       Chosun University Hospital, 2020. Yuri Kim, Uni Park, Na-
inflammation. Therefore, future studies on possible thera-        Young Ha, and Hyoree Park received scholarships from the
pies for eosinophilic pulmonary inflammation in COVID-19          BK21-plus education program funded by the National Re-

https://doi.org/10.3904/kjim.2021.093                                                                 www.kjim.org             7
The Korean Journal of Internal Medicine. 2021 Sep 27. [Epub ahead of print]

search Foundation of Korea.                                                  Van Kaer L. NKT cells: what’s in a name? Nat Rev Immunol
  We are grateful to all nurses (Myung Sook Kim, Jin Yeong                   2004;4:231-237.
Park, A Ra Kim, Hye Yeon Lee, Hye Mi Park, and So Sun                    10. Dentone C, Vena A, Loconte M, et al. Bronchoalveolar lavage
Jeon from the Department of Infection Control; and Sun                       fluid characteristics and outcomes of invasively mechanically
Ok Joo, Seong Hee Kang, Hye Jin Kim, Yun Hee Choi, Ji Hye                    ventilated patients with COVID-19 pneumonia in Genoa, Italy.
son, Jeong A Hwang, Sun a Jeong, Da Jeong Mun, Seung                         BMC Infect Dis 2021;21:353.
Hyun Lee, Seo Hee Seo, Yeong Ji Lim, Geum Bit Hwang, Eun                 11. Liao M, Liu Y, Yuan J, et al. Single-cell landscape of broncho-
Jeong Gong, Han Sol Hong, Ji Seon Jeong, Su Yeon Go, Na                      alveolar immune cells in patients with COVID-19. Nat Med
Ri Lee, Ja In Moon, Min Seo Kim, Hyun Young Lee, Sang                        2020;26:842-844.
Young Kim, Bo Ra Lim, Song Won Lee, Ju Jin Kim, Ha Neul                  12. Pandolfi L, Fossali T, Frangipane V, et al. Broncho-alveolar in-
Seon, Yea Ji Moon, Jin Young Jo, and Da Min Park from a                      flammation in COVID-19 patients: a correlation with clinical
nationally designated quarantine ward at Chosun University                   outcome. BMC Pulm Med 2020;20:301.
Hospital) and patients involved in the study.                            13. Fraenkel DJ, Bardin PG, Sanderson G, Lampe F, Johnston SL,
                                                                             Holgate ST. Lower airways inflammation during rhinovirus
                                                                             colds in normal and in asthmatic subjects. Am J Respir Crit
REFERENCES                                                                   Care Med 1995;151(3 Pt 1):879-886.
                                                                         14. Harrison AM, Bonville CA, Rosenberg HF, Domachowske JB.
 1. Zhu N, Zhang D, Wang W, et al. A novel coronavirus from                  Respiratory syncytical virus-induced chemokine expression in
    patients with pneumonia in China, 2019. N Engl J Med                     the lower airways: eosinophil recruitment and degranulation.
    2020;382:727-733.                                                        Am J Respir Crit Care Med 1999;159:1918-1924.
 2. Coronaviridae Study Group of the International Committee             15. Jeon EJ, Kim KH, Min KH. Acute eosinophilic pneumonia as-
    on Taxonomy of Viruses. The species severe acute respiratory             sociated with 2009 influenza A (H1N1). Thorax 2010;65:268-
    syndrome-related coronavirus: classifying 2019-nCoV and                  270.
    naming it SARS-CoV-2. Nat Microbiol 2020;5:536-544.                  16. LeMessurier KS, Rooney R, Ghoneim HE, et al. Influenza A
 3. Kim ES, Chin BS, Kang CK, et al. Clinical course and outcomes            virus directly modulates mouse eosinophil responses. J Leukoc
    of patients with severe acute respiratory syndrome corona-               Biol 2020;108:151-168.
    virus 2 infection: a preliminary report of the first 28 patients     17. Cavalli E, Petralia MC, Basile MS, et al. Transcriptomic analysis
    from the Korean cohort study on COVID-19. J Korean Med                   of COVID‑19 lungs and bronchoalveolar lavage fluid samples
    Sci 2020;35:e142.                                                        reveals predominant B cell activation responses to infection.
 4. Zhou F, Yu T, Du R, et al. Clinical course and risk factors for          Int J Mol Med 2020;46:1266-1273.
    mortality of adult inpatients with COVID-19 in Wuhan, China:         18. Bilenki L, Yang J, Fan Y, Wang S, Yang X. Natural killer T cells
    a retrospective cohort study. Lancet 2020;395:1054-1062.                 contribute to airway eosinophilic inflammation induced by
 5. Conway SP, Pond MN, Bowler I, et al. The chest radiograph                ragweed through enhanced IL-4 and eotaxin production. Eur
    in cystic fibrosis: a new scoring system compared with the               J Immunol 2004;34:345-354.
    Chrispin-Norman and Brasfield scores. Thorax 1994;49:860-            19. Lee SY, Noh Y, Goo JH, et al. Natural killer T cell sensitization
    862.                                                                     during neonatal respiratory syncytial virus infection induces
 6. Barnig C, Alsaleh G, Jung N, et al. Circulating human eosino-            eosinophilic lung disease in re-infected adult mice. PLoS One
    phils share a similar transcriptional profile in asthma and other        2017;12:e0176940.
    hypereosinophilic disorders. PLoS One 2015;10:e0141740.              20. Papakosta D, Manika K, Kyriazis G, et al. Bronchoalveolar
 7. Das R, Sant’Angelo DB, Nichols KE. Transcriptional control of            lavage fluid eosinophils are correlated to natural killer cells in
    invariant NKT cell development. Immunol Rev 2010;238:195-                eosinophilic pneumonias. Respiration 2009;78:177-184.
    215.                                                                 21. Kimura H, Francisco D, Conway M, et al. Type 2 inflammation
 8. Yu YR, Hotten DF, Malakhau Y, et al. Flow cytometric analysis            modulates ACE2 and TMPRSS2 in airway epithelial cells. J Al-
    of myeloid cells in human blood, bronchoalveolar lavage, and             lergy Clin Immunol 2020;146:80-88.
    lung tissues. Am J Respir Cell Mol Biol 2016;54:13-24.               22. De Giacomi F, Vassallo R, Yi ES, Ryu JH. Acute eosinophilic
 9. Godfrey DI, MacDonald HR, Kronenberg M, Smyth MJ,                        pneumonia: causes, diagnosis, and management. Am J Respir

8       www.kjim.org                                                                                   https://doi.org/10.3904/kjim.2021.093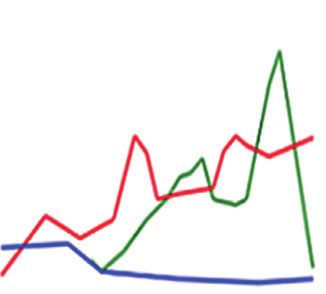
Kim DM, et al. Eosinophil-mediated inflammation in COVID-19

    Crit Care Med 2018;197:728-736.                                       respiratory distress syndrome and death in patients with coro-
23. Qin C, Zhou L, Hu Z, et al. Dysregulation of immune response          navirus disease 2019 pneumonia in Wuhan, China. JAMA
    in patients with coronavirus 2019 (COVID-19) in Wuhan, Chi-           Intern Med 2020;180:934-943.
    na. Clin Infect Dis 2020;71:762-768.                              28. Jacobson KA, Tosh DK, Jain S, Gao ZG. Historical and current
24. Scott-Taylor TH, Axinia SC, Amin S, Pettengell R. Immuno-             adenosine receptor agonists in preclinical and clinical develop-
    globulin G; structure and functional implications of different        ment. Front Cell Neurosci 2019;13:124.
    subclass modifications in initiation and resolution of allergy.   29. Heulens N, Korf H, Janssens W. Innate immune modulation in
    Immun Inflamm Dis 2018;6:13-33.                                       chronic obstructive pulmonary disease: moving closer toward
25. Russell CD, Millar JE, Baillie JK. Clinical evidence does not         vitamin D therapy. J Pharmacol Exp Ther 2015;353:360-368.
    support corticosteroid treatment for 2019-nCoV lung injury.       30. Panarese A, Shahini E. Letter: COVID-19, and vitamin D. Ali-
    Lancet 2020;395:473-475.                                              ment Pharmacol Ther 2020;51:993-995.
26. RECOVERY Collaborative Group, Horby P, Lim WS, et al. Dexa-       31. Chen L, Xiong J, Bao L, Shi Y. Convalescent plasma as a po-
    methasone in hospitalized patients with COVID-19. N Engl J            tential therapy for COVID-19. Lancet Infect Dis 2020;20:398-
    Med 2021;384:693-704.                                                 400.
27. Wu C, Chen X, Cai Y, et al. Risk factors associated with acute

https://doi.org/10.3904/kjim.2021.093                                                                       www.kjim.org                9
The Korean Journal of Internal Medicine. 2021 Sep 27. [Epub ahead of print]

SUPPLEMENTARY METHODS                                               Lakes, NJ, USA). PE-conjugated CD1d/PBS57 tetramers
                                                                    obtained from the National Institute of Health Tetramer
Cytological analysis                                                Core Facility (Bethesda, MD, USA) were kindly supplied
In P1 and P2, bronchoscopy was performed under conscious            by Dr. Doo Hyun Cheong at Seoul National University
sedation using intravenous midazolam. Heart rate, respira-          College of Medicine. Cell were then fixed with a fixation
tory rate, blood pressure, and oxygen saturation were mon-          buffer (BD Bioscience) and analyzed using a FACS Fortes-
itored before, during, and after the procedure. Bronchoal-          sa II flow cytometer (BD Biosciences). Data were analyzed
veolar lavage fluid (BALF) was performed with a single-use          using Flowjo software (Tree Star, Ashland, OR, USA).
disposable bronchoscope (Ambu® aScope™ 4, Ambu A/S,
Ballerup, Denmark) in a wedged position within a subseg-            Enzyme-linked immunosorbent assay
mental bronchus by a pulmonologist. Sterile 0.9% NaCl               To assess SARS-CoV N protein-specific antibody responses,
saline was instilled in the selected subsegmental bronchus          96-well immunoassay plates (Nunc, Waltham, MA, USA)
in sequential aliquots (30, 30, and 40 mL). After saline in-        were coated with 100 μL of purified antigen at a concen-
stillation, the fluid was immediately recovered into the same       tration of 1 μg/mL at 4°C for overnight. The plates were
syringe by gentle and continuous manual aspiration. BAL             then blocked for 2 hours at room temperature (RT) with
and sputum cytology samples were obtained and smeared               PBS containing 5% skim milk. One hundred microliters of
onto glass slides immediately after collection. The slides          serially diluted plasma samples were incubated for 2 hours
were then immediately fixed with 95% ethanol in a Coplin            at RT. After washing with PBS containing 0.05% Tween20
jar. After fixing, hematoxylin and eosin (H&E) staining was         (0.05% PBST), horseradish peroxidase-conjugated mouse
performed. Concentration of eosinophil cationic protein in          anti-human immunoglobulin G1 (IgG1), IgG2, IgG3, IgG4,
respiratory specimens was measured using clinical diagno-           IgA, or IgE antibody (Southern Biotech, Birmingham, AL,
sis service from Seoul clinical laboratory (Seoul, Korea) after     USA) was added and incubated for 1 hour at RT. Wells
gamma-irradiation (30 kGy, Soyagreentech, Seoul, Korea).            were then washed with 0.05% PBST and incubated with
                                                                    a 3,3ʹ,5,5′-tetramethylbenzidine peroxidase substrate solu-
Flow cytometry                                                      tion (KPL, Gaithersburg, MD, USA) for 10 minutes. The reac-
Peripheral blood mononuclear cells (PBMCs) were prepared            tions were stopped by adding 1 M phosphoric acid solution.
by standard density gradient centrifugation using Histo-            Absorbance was measured at 450 nm using a microplate
paque-1077 and 1119 (Sigma-Aldrich, St. Louis, MO, USA)             reader (Beckman Coulter, Brea, CA, USA). The cut-off titer
in a Biosafety Level 3 laboratory at Seoul National Univer-         for the enzyme-linked immunosorbent assay (ELISA) was de-
sity. Blood leukocytes and PBMCs were cryopreserved in              termined as the lowest titer showing an optical density (OD)
liquid nitrogen or directly stained with antibodies listed          over the mean OD plus 3× standard deviation from three
below for flow cytometry in the same laboratory. Dead               control plasma samples (diluted 1:10).
cells were stained with Zombie Aqua Fixable Viability Dye
(BioLegend, San Diego, CA, USA). Cells were stained                 Statistical analysis
with the following sets of antibodies differentially la-            Data was analyzed using the Graph Pad Prism 5.01 software
beled with indicated fluorochrome; anti-CD4-Alexa488,               (GraphPad Software, La Jolla, CA, USA). Statistical analysis
anti-CD8-PerCP or APC, anti-CD14-BV605, anti-CD16-Al-               was performed using one-way analysis of variance (ANOVA)
exa700, anti-CD24-BV421, anti-CD45-PerCP-Cy5.5, an-                 followed by Newman-Keuls t test for comparisons of values
ti-CD206-Alexa488, anti-HLA-DR-BV711 (from BioLeg-                  among different groups. A p < 0.05 was considered statis-
end), anti-CD3-PE-CF594 or Pacific blue, anti-CD20-APC/             tically significant.
H7, and anti-CD56-APC (from BD Bioscience, Franklin

www.kjim.org                                                                                   https://doi.org/10.3904/kjim.2021.093
Kim DM, et al. Eosinophil-mediated inflammation in COVID-19
Acute Convalescent
Blood (Healthy) Blood (P2, D12) BALF (P1, D12) Blood (P1, D19) BALF (P1, D19)
Monocytes & macrophages
SSC
CD14-
CD14-BV605
T cells
CD3+
SSC
CD3-PE-Texas Red
CD3-
B cells
SSC
CD20-APC-Cy7
SSCHIGH
CD16-Alexa700
PMNs
CD24-BV421
NKT-like
CD24-BV421
CD3-PE-Texas Red
Supplementary Figure 1. Relative frequencies of leukocyte subtypes in blood and bronchoalveolar lavage fluid (BALF) specimens from
patients with severe coronavirus disease 2019 (COVID-19). Flow cytometric analyses of leukocytes in blood and BALF specimens collected
from two patients with severe COVID-19 (P1 and P2) during acute and convalescent phases were performed after staining with indicated
antibodies. The patients’ ID and sample collection day (days after symptom onset) are indicated at the top. Blood leukocytes collected
from a healthy volunteer were used as a control for flow cytometry (left panels). The relative frequencies of specific leukocytes subtype
population are indicated in each window. In polymorphonuclear (PMN) population, the relative frequencies of neutrophils (blue), eosin-
ophils (red), and mast cells (black) are color-gated based on the expression levels of CD16 and CD24. All frequencies are relative levels of
CD45+ leukocytes. SSC, side scatter; PE, phycoerythrin; APC, allophycocyanin; NKT, natural killer T.
https://doi.org/10.3904/kjim.2021.093 www.kjim.orgThe Korean Journal of Internal Medicine. 2021 Sep 27. [Epub ahead of print]
Blood (P2)
HLA-DM
FSC-A
CD45
CD24
CD16
CD3
BALF (P1)
HLA-DM
FSC-A
CD45
CD24
CD16
A CD3
Healthy Acute Convalescent
NK & NKT
CD56-APC
CD3-PB450
CD1d-Tet+ NKT
CD1d-Tet-PE
B CD3-PB450
50 40
NK
40
% In lymphocytes
% In lymphocytes
30
30
20 20
10
10
0
P1 0 P1
0 5 10 15 20 P2 P2
P3 H A C P3
Days after symptom onset
C NK
Supplementary Figure 2. Characterization of natural killer (NK) and natural killer T (NKT) cells in blood and bronchoalveolar lavage flu-
ids (BALFs) and peripheral blood mononuclear cells (PBMCs) from patients with coronavirus disease 2019 (COVID-19). (A) Relative levels
of leukocyte makers of B (brown), NKT-like (red), and T cells (blue) in blood and BALF specimens from patients with severe COVID-19.
These cell types are gated population from Supplementary Fig. 1. (B) Representative contour plots identifying NK, NKT, and CD1d-tetram-
er (Tet)-positive NKT (invariant NKT) cells using PBMCs from the patients with COVID-19. (C) Kinetic changes in the relative frequencies
of CD3-/CD56+ NK cells among lymphocytes from the indicated patients are presented (right panel). The relative frequencies of each
immune cell type from three healthy volunteers were included as controls (open circles). The relative frequencies of CD3-/CD56+ NK cells
among lymphocytes from the patients were rearranged based on the collection periods, i.e., acute phase (A) and convalescent phase (C).
The relative frequencies of NK cells from three healthy volunteers were included as controls (H, open circles). Black bars indicate mean val-
ues. FSC-A, forward scatter-A; HLA-DM, human leukocyte antigen DM; APC, allophycocyanin; PE, phycoerythrin.
www.kjim.org https://doi.org/10.3904/kjim.2021.093Kim DM, et al. Eosinophil-mediated inflammation in COVID-19
500 20,000
400
Platelets (× 103/µL)
15,000
WBC (/µL)
300
10,000 P1
200
P2
100 5,000
P3
0
0
5 10 15 20 25 30 5 10 15 20 25 30
Days after symptom onset Days after symptom onset
20,000 Lymphocytes (/µL) 3,000
Neutrophils (/µL)
15,000
2,000
10,000
1,000
5,000
0 0
5 10 15 20 25 30 5 10 15 20 25 30
Days after symptom onset Days after symptom onset
1500 500
Monocytes (µL)
400
Eosinophils (/µL)
1000
300
200
500
100
0 0
5 10 15 20 25 30 5 10 15 20 25 30
Days after symptom onset Days after symptom onset
100
80
Basophils (µL)
60
40
20
0
5 10 15 20 25 30
Days after symptom onset
Supplementary Figure 3. Kinetics of complete blood counts for the three patients with coronavi-
rus disease 2019 (COVID-19). WBC, white blood cell.
https://doi.org/10.3904/kjim.2021.093 www.kjim.orgYou can also read