Estimation of Antioxidant Phytochemicals in Four Different Varieties of Durian (Durio Zibethinus Murray) Fruit
←
→
Page content transcription
If your browser does not render page correctly, please read the page content below
2011 International Conference on Bioscience, Biochemistry and Bioinformatics
IPCBEE vol.5 (2011) © (2011) IACSIT Press, Singapore
Estimation of Antioxidant Phytochemicals in Four Different Varieties of Durian
(Durio Zibethinus Murray) Fruit
Muhammad Aqeel Ashraf1; Mohd. Jamil Maah1; Ismail Yusoff2
1
Department of chemistry, University of Malaya, 50603 Kuala Lumpur, Malaysia
2
Department of Geology, University of Malaya, 50603 Kuala Lumpur, Malaysia
chemaqeel@gmail.com
Abstract—This research work was carried out to quantify the
total phenolics, flavonoids and carotenoides, vitamin C
contents, reported as antioxidants, in the extracts of four
locally available varieties of durian. Fruit was extracted using
dichloromethane: pentane (1:1 v/v) and subjected to study the
various quality parameters. The total phenolic contents from
durian fruit extract, determined following the Folin-ciocalteu
assay were found in the range of 690.62–998.29 mg/L, showing
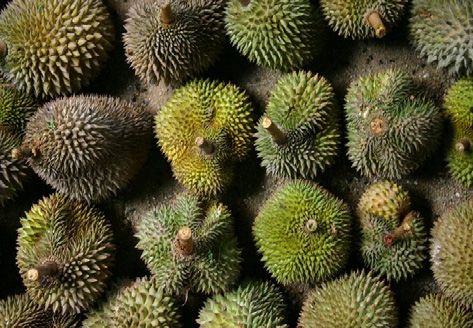
the significant inter-varietals variations. The total flavonoids The four studied varieties are;
and vitamin C contents from fruit extract were found in the 1- D11
range of 211.36–220.34 and 18.87–25.1 mg/L, respectively. 2-Chaer Phoy (Green Skin Durian)
Whereas, the total carotenoides contents of fruit extract were 3-Yah Kang (Centipede Durian)
found in a low concentrations i.e. 0.05–0.08 mg/L. The 4-Ang Jin (Red Yoke Durian)
statistical analysis showed significant (p < 0.05) variations in Most of the photochemicals are an integral part of the
the total phenolic, carotenoides and vitamin C contents while durian fruit and also being used in medicinal formulations. A
non-significant (p > 0.05) variation in total flavonoids contents number of health protective effects of phenolic compounds
among different varieties of durian. Caffeic acid and quercetin have been reported due to their antioxidant, antimutagenic,
were the dominant antioxidant substances found in durian. In anticarcinogenic, anti-inflammatory, antimicrobial, and other
conclusion, the bioactivity of ripe durian was high and the total biological possessions [3-5]. Currently durian fruit is popular
polyphenols were the main contributors to the overall in daily utilization because of their first-class flavor and
antioxidant capacity.
health-promoting compounds, such as flavonoids, phenolics
Keywords- Extract, Total phenolics, Flavonoids, Vitamin C,
and carotenoides conents [6-10]. Phenolic compounds
Carotenoides Ripe, Bioactive compounds; Antioxidant capacity constitute one of the most plentiful and extensively
and Phytochemicals distributed groups of substances in the plant kingdom and
foods and fruit juices may have a very complex phenolic
composition These are biogenetically arise secondary
I. INTRODUCTION metabolic products of plants and their activity is reported due
Durian (Durio zibethinus Murray) is a fruit unique to to the Polyphenols which demonstrate antibacterial, anti-
Southeast Asia. It belongs to the family Bombacaceae in the inflammatory and vasodilatory actions that might be
order Malvales ooriginating in the Malay Peninsula [1].This attributed to polyphenol compounds with antioxidant activity
is sort-of strange, as almost any fruit or vegetable with a [11]
somewhat appealing taste has long become a universally Dietetic carotenoid antioxidants from fruits and
cultivated crop. Durian grows well in humid conditions (75- vegetables have been reported to play a vital role in human
80% humidity) with a rain fall between 1,600 and 4,000 ml a health and particularly, their inference in cancer prevention
year, and average temperature between 24 and 30°c. Durian has grown a very immense interest in the antioxidant
prefers a loamy soil type with a pH between 5.0 and 6.5. It composition of fruits and vegetables. The carotenoides
requires a tropical climate and will not grow well in areas content of different fruit products like juices, provide a very
over 3000 feet altitude [2]. There are about 200 different useful clue about the quality of product [12-13].
varieties of durian in Malaysia, but only few varieties are Durian fruit contain a considerable amount of phenolics,
favored and grown commercially. flavonoids and carotenoids and their quantitative fingerprint
shows differences in the proportions because of various
locations of origins, agro-climatic conditions and dreadful
diversity in species. The importance of this fruit is mostly
connected with its composition and antioxidant properties
[14-16]. It has been reported that durian has additional
131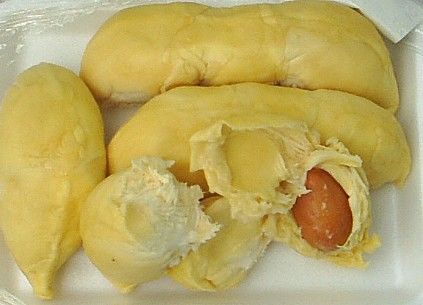
valuable health properties: polysaccharide gel, extracted               Tokyo, Japan). The fruit extract (1.7 ml/kg pulp) was sealed
from the fruit hulls, reacts on immune responses and is                 in a glass container and kept at −20 °C.
responsible for cholesterol reduction [17]. The glycaemic
                                                                        D. Evaluation of Extract Quality
index of durian was the lowest in comparison with papaya
and pineapple [18]. The heath properties of durian are based                The quality of extracted lequid of each variety was
not only on the antioxidant properties, but also on its fatty           assessed by studying the various quality parameters like pH,
acid composition. Cholesterol hypothesis implied that                   total dissolved solids, viscosity, density and acidity. For pH
reducing the intake of saturated fats and cholesterol while             determination, 10 g of extract of each sample, blended with
increasing that of polyunsaturated oils is effective in                 20 mL deionized water was heated to 100 oC and then cooled
lowering serum cholesterol, and thereby in reducing                     to 25 oC followed by the addition of 20 mL deionized water.
coronary heart disease. The protective activity is linked with          The pH was measured at 25 oC with a pH meter (Inolab pH
a high supply of n − 3 fatty acids coming from fish and                 720, wtw 82362, Weiheim, Germany) [23]. The acidity of
seafood, and high consumption of wholegrain products, as                samples was determined according to the method reported by
                                                                        Morneo [24]. Each sample was titrated with 0.1 M NaOH to
well as fruits and vegetables [19]. Durian is rich in n − 3
                                                                        pH 8.1 monitoring with an electrode pH meter (Inolab pH
fatty acids, compared to some other fruits [20].
                                                                        720, wtw 82362, Weiheim, Germany) at both 20 0C and 32
    Although literature is available with major focus on the            0
                                                                         C temperatures. Results were expressed as grams of citric
polyphenolic and carotenoid contents of durian fruit but such
                                                                        acid per liter of sample solution. Total solids were measured
type of investigations are lacking regarding the intervarietal
                                                                        following the official method of AOAC [23]. Briefly; after
variations of these phytochemicals in durian fruit extract
                                                                        heating 5 ml of sample juice in china dish in electric oven at
indigenous to Malaysia. The main objective of this work was
                                                                        105 oC to a constant weight. Results were expressed as
to determine the total phenolics, flavonoids and carotenoid
                                                                        grams of total solids per liter juice. Viscosity of each sample
contents and amount of vitamin C in various varieties of
                                                                        was measured by viscometer and results were expressed as
durian using spectrophotometric methods.
                                                                        centipoises (cP). density (g/cm3) of each sample was
                II.   MATERIAL AND METHODS                              measured by specific gravity bottle at 25 oC.
                                                                        E. Determination of Total Phenolic Contents
A. Collection of Samples
                                                                            Total phenolic contents (TPC) were determined by
   All durian samples were harvested in June, 2010, from                following the Folin-Ciocalteu method [25-27] with slight
south and southwest hilly regions of Penang Island,                     modifications. Briefly, 1 mL of citrus juice was extracted
from a 18 year old Bao Sheng Durian Farm at Titi                        with 9 mL of 80% methanol for 30 min at room temperature.
Kerawang, near Pantai Aceh in Penang. The maturity of the               After centrifugation 4000 rpm for 10 min, an aliquot (1 mL)
durian fruits was determined by combined techniques: day                of appropriately diluted 80% methanol extracts were added
count, character of fruit spines, tapping the fruit, colour and         to a 25 mL volumetric flask filled with 9 ml distilled water.
shape of the fruit [21]. Fresh ripened durian fruit samples (12         Folin–Ciocalteu phenol reagent (0.5 mL) was added to the
each) of four indigenous varieties of durian fruit (D11,                mixture and shaken vigorously. After 5 min, 5 ml of Na2CO3
Chaer Phoy, Yah Kang, Ang Jin) were procured from the                   solution was added with mixing. The solution was
Bao Sheng Durian Farm and transferred to research                       immediately diluted to 25 ml with distilled water and mixed
laboratory of Department of Chemistry, University of                    thoroughly and then allowed to stand for 60 min before
Malaya, Kuala Lumpur. Durian fruit samples were identified              measurement, and the absorbance was measured at 750 nm
and authenticated by the kind assistance of botanist from the           versus the prepared blank. Quantification was done on the
department. Fruits were cleaned and the edible parts were               basis of a standard curve with gallic acid. Results were
separated from seeds.                                                   expressed as gram of gallic acid equivalents (GAE) per 100 g
                                                                        dry weight [28-30] (Figure 1a).
B. Chemicals and Reagents
                                                                        F. Determination of Total Flavonoid Contents
    Folin-Ciocalteu’s phenol regent, 2, 2-Diphenyl-1-
picrylhydrazyl     (DPPH),    linoleic  acid,    butylated                  Total flavonoid contents (TFC) were determined by
hydroxytoluene (BHT), β-carotene and Tween 40 were                      following the method of sultana [31] with slight
obtained from Sigma Chemical Co. (St. Louis, MO, USA).                  modifications. In brief, 2.5 g of sample placed in a Soxlet
All the other chemicals/reagents and solvents used in this              extractor and refluxed with methanol for more then 2 h at 80
                                                                        o
study were purchased from Merck (Darmstadt, Germany),                    C. The extract was evaporated to dryness in a rotary vacuum
unless stated otherwise.                                                evaporated at less than 40 oC and dissolved with methanol.
                                                                        Exactly 0.3 ml of 5% NaNO2 was added to 1 ml of extract in
C. Extraction of Samples                                                a 10 mL volumetric flask and the mixture was kept for 10
    Fruit samples were mixed with dichloromethane: pentane              min at room temperature. Addition 0f 0.3 mL of 10% Al
(1:1 v/v) [22] in a 1:2 proportion (1 kg: 2 L solvent mix) for          (NO3)3 to the mixture and incubated for 10 min again
48 h at 4 °C. The clear liquid was decanted and the solvent             followed by the addition of 4 ml of 1 NaOH and of methanol
was evaporated under vacuum (27.5 ± 2.5 in Hg) at 50 °C                 up to volume. After incubating for 30 min at room
and 50 rpm in an RE52 Rotavaporator set-up (Yamamoto,                   temperature for colour development, absorbance at 500 nm

                                                                  132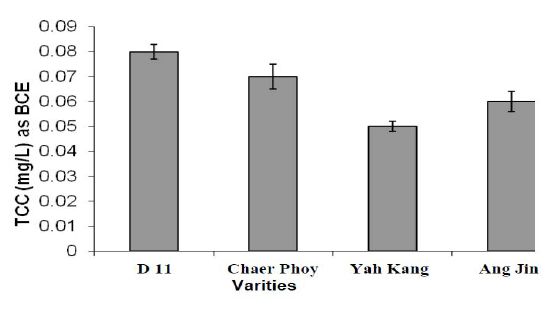
was measured. Total flavonoid was expressed as catichine               B. Antioxidant potentials
equivalents [28] (Figure 2a).
                                                                       C. Total phenolics contents (TPC)
G. Determination of Total Carotenoid Contents
                                                                           The amount of total phenolics contents found in the
    The method of Lee and Velioglu [13, 27] was used for               durian samples varied widely among varieties. The values of
total carotenoid quantitations. In brief, 5 g of each sample           TPC ranged from 690.62-998.29 mg/ L as GAE (Fig. 2). The
and 50 ml of n-hexane-acetone-ethanol (v/v; 2:1:1) were                maximum TPC was found from the Ang Jin variety while the
placed in a flask, extracted on a shaker at 200 rpm for 20 min         minimum from the Chaer Phoy variety. D11 and Yah Kang
at room temperature, centrifuged at 4000 rpm for 10 min at 4           varieties of durian showed 730.46 and 825.37 mg/L TPC as
0
 C, and the supernatants were collected and made up to 50              GAE, respectively. Statistical analysis showed the significant
mL with extraction solvent. Two layers were observed after             (p < 0.05) variation in the TPC with respect to durian
mixing the solvent, an organic (upper layer) and aqueous               varieties.
(lower layer). After carefully separating the layers, the
absorbance was measured at 450 nm. Total carotenoid was
expressed as β-carotene equivalents.
H. Determination of vitamin C Contents
    Procedures used to determine the vitamin C content were
as described by Wright and Kader [32] for the determination
of ascorbic acid by HPLC.
I.  Statistical Analysis                                                                Figure 1. Standard curve of Gallic acid
   All the experiments were conducted in three replicates
and data obtained was analyzed statistically by one way
ANOVA technique using Minitab Software.
              III.   RESULTS AND DISCUSSION

A. Physico-chemical analysis
    The physico-chemical parameters of the various varieties
of durian fruit are presented in Table 1. The pH values were
ranged from 4.50-5.86. The durian fruit from D11 variety                    Figure 2. Total phenolic contents in different varieties of durian
was found to be more acidic (pH 4.50) followed by Chaer
Phoy (pH 5.16), Yang Kang (pH 5.52) and Ang Jin (pH
5.86). Density and viscosity of all the fruit samples were in
the range of 1.026-1.029 g/cm3 and 1.044-1.127 cP,
respectively. Among all the durian varieties, Ang Jin variety
offered highest values of total soluble solid contents (112.38
g/L) while, Yah Kang contained the lowest (103.15 g/L).
Titrate-able acidity, measured at 25oC, of all the durian
samples was found to be analogous concentrations. Analysis                               Figure 3. Standard curve of Catechine
of variance (ANOVA) revealed non-significant (p > 0.05)
difference in the physico-chemical parameters of extract
from various varieties of durian.

 TABLE I.     PHYSIO-CHEMICAL QUALITY PARAMETERS OF EXTRACT
            FROM VARIOUS VARIETIES OF DURIAN FRUIT

                                                                       Figure 4. Total flavonoid contents in the different varieties of durian

                                                                 133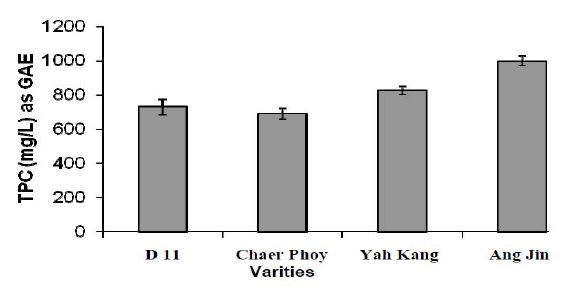
Figure 5. Total carotenoid contents in the different varieties of durian         groups on their ring structures [35]. There are few reports in
                                                                                   literature on the antioxidant potentials of fruits [36-38].
                                                                                        All the samples analyzed in the present study contained
                                                                                   considerable amount of total phenolics, total flavonoids as
                                                                                   well as good concentration of vitamin C. As reported earlier
                                                                                   vitamin C is the major antioxidant present in fruits. This is
                                                                                   expected as AA generally provides minor contribution to the
                                                                                   antioxidants in fruits [38-40]. The contents of antioxidant
                                                                                   phytochemicals varied among species, cultivars, varieties
                                                                                   and geographical origins [41].
                                                                                        Mature durian sample showed the highest
 Figure 6. Estimation of vitamin C contents in the different varieties of
                                durian                                             antiproliferative activity. This can be explained not only by
                                                                                   relatively high antioxidant activity, but by the amount of
                                                                                   flavonoids and other bioactive compounds. The results on
D. Total flavonoid contents (TFC)                                                  cell proliferation can be explained as a synergistic effect of
    The data regarding the TFC is presented in Fig. 4. it was                      flavonoids, flavanols and ascorbic acid in mature durian.42
observed that the amount of TFC found in the durian extract                        Our data correspond with that combinations of flavonoids,
samples varied widely among varieties. The overall TFC                             which are naturally present in whole fruits and vegetables,
found in samples of various varieties of durian were in the                        are more effective in cancer cell growth inhibition than the
range of 211.36-220.34 mg/ L as CE. The maximum TFC                                individual flavonoids. Durian can be used as a potential
was found from the Ang Jin variety while the minimum from                          source of high-value phytochemicals with nutraceutical and
the D11 variety. Chaer Phoy and Yah Kang varieties of                              functional food additive applications.
durian showed 219.27 and 216.61 mg/L TFC as CE,
respectively. Statistical analysis showed that variations in                                               IV.   CONCLUSION
TFC with respect to citrus varieties were non-significant (p >                         Malaysia has a great diversity of underutilized fruits that
0.05).                                                                             vary in appearance and organoleptic characteristics. There
E. Total Carotenoides Contents (TCC)                                               are great variations among different varieties of durian with
                                                                                   respect to the content of antioxidant phytochemicals and
    The carotenoides contents were found in extract samples                        quality attributes. Durian have high potential to be sources of
of various varieties of durian in very low concentration (Fig.                     antioxidants. The correlation results indicated that along
5). The overall range of carotenoides contents were 0.05-
0.08 mg/L measured as beta Carotene Equivalent although,                           with phenolic compounds, other antioxidant components
the statistical analysis showed the significant (p < 0.05)                         such as vitamins C and E and carotenoids could also
variation in TCC with respect to durian varieties.                                 contribute to the antioxidant capacity of underutilized fruits.
                                                                                   Bush variety contained significantly higher amounts of total
F. Vitamin C Contents                                                              phenolics and total flavonoids. While vitamin C contributed
    The amount of vitamin C found in the durian extract                            considerably to the Lisbon variety. It is thus recommended to
samples varied widely among varieties (Fig. 6). The                                consume durian fruit for uptake of antioxidant
concentration of vitamin C was found maximum in D11                                phytochemicals and vitamin C. Overall, findings of this
variety (25.13mg/L) and that of least in Ang Jin (18.87mg/L).                      study support the recommendation of many national dietary
Based on these findings, the order of vitamin C contents in                        guidelines which encourages eating a variety of fruits every
various varieties of durian was as follows; D11 > Chaer                            day, especially the durian. Efforts to promote their
Phoy > Yah Kang > Ang Jin. Statistical analysis showed the                         consumption should be continued for public health benefits.
significant (p < 0.05) variation in vitamin C with respect to                      This antioxidant data would be valuable for epidemiological
durian varieties.                                                                  research and providing support for dietary guidelines.
    In nature, there are a number of various types of
antioxidant compounds that play an important as radical                                                   ACKNOWLEDGMENT
scavengers, inhibit lipid peroxidation and other free radical-                        The work reported in this paper was carried out in
mediated processes and able to protect the human body as                           Analytical Laboratory, Department of Chemistry, University
well as processed foods from oxidative damage ascribed to                          of Malaya, Kuala Lumpur, Malaysia through UM Research
the reaction of free radicals. The uses of plant-based                             Grant vide no. PS355/2009C. Thanks also to the Ministry of
antioxidants like polyphenols, flavonoids, vitamin C are                           Higher Education Malaysia (MOHE) for financial support.
related to reduce the risk of incidence of coronary heart
diseases, neurological disorders, and certain type of cancers
[33-34]. The ability of fruit juices to exhibit antioxidant                                                   REFERENCES
potential was closely related to their total phenolic and total                    [1]   Voon, Y. Y. Hamid, N. S. A. Rusul, G. Osman, A. & Quek, S. Y.
flavonoids contents. This is because the phenolic compounds                              2007a. Food Chemistry,103:7–1227.
have the ability to donate hydrogen atoms from hydroxyl

                                                                             134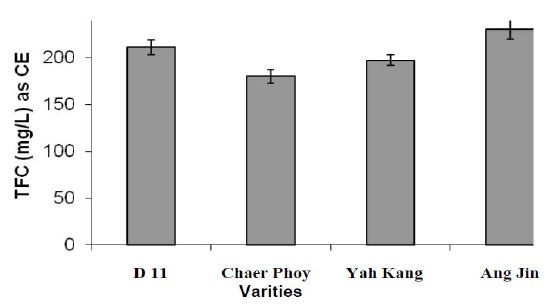
[2]    Voon, Y. Y. Hamid, N. S. A. G. Rusul, A. Osman and S.Y. Quek,                  [23] AOAC, Official Methods of Analysis. 15th Edn., Association of
       Postharvest                                                      Biol.              Official Analytical
          Technol., 46, 6–85 (2007b).                                                 [24] Chemists, 1990.Washington, DC., USA., pp. 200-210.
[3]    [3] R.J. Robbins, J. Agric. Food chem., 51, 2866-2887 (2003).                  [25] Moreno, C. S. Cano, M. P. de Ancos, B. Plaza, L. Olmedilla, B.
[4]    [4] R.J. Robbins, and S.R. Bean, J. Chromatography A., 1038, 97-                    Granado, F. & Martín, A. 2003. American Journal of Clinical
       105(2004).                                                                          Nutrition. 78 : 454-460.
[5]    [5] L.W. Morton, R.A.A. Caccetta, I.B. Puddey, and K.D.Croft, Clin.            [26] Liu, M. Li, X. Q. Weber, C. Lee, C. Y. Brown, J. & Liu, R. H. 2002.
       Exp. Pharmaco. Physi., 27, 152-159 (2000).                                          Journal of Agriculture Food Chemistry, 50 : 2926–2930.
[6]    [6] Y.C.Wang, Y.C. Chuang, and Y.H. ku, Taiwan. Food Chem., 102,               [27] Isabelle, M. Lee, B. L. Lim, M. T. Koh, W. P. Huang, D. & Ong, C.
       1163-1171 (2007).                                                                   N. 2010. Food Chemistry. 123,             77-84.
[7]    [7] E.Belajova, and M. Suhaj, Food Chem., 86, 339-343 (2003).                  [28] Velioglu, Y. S. Mazza, G. Gao, L. & Oomah, B. D. 2004. Journal of
[8]    [8] J. Vanamala, L. Reddivari, K.S. Yoo, L.M. Pike, and B.S.Patil, J.               Agricultural Food Chemistry, 46: 4113–4117.
       Food Comp. and Anal., 19, 157-166(2006).                                       [29] Singleton, V. L. Orthofer, R. & Lamuela-Raventos, R. M. 1999.
[9]    P. Dugo, M.L. Presti, M. Ohman, A. Fazio, G. Dugo, and                              Methods Enzymology. 299: 152–178.
       L.Mondello, J. Separ. Sci, 28, 1149-1156 (2005).                               [30] Heimler, D. Vignolini, P. Dini, M. G. Vincieri, F. F. & Romani, A.
[10]   Leuzzi, U. Caristi, C. Panzera, P. & Licandro, G. 2000. Journal of                  2006. Food Chemistry, 99:464–469.
       Agriculture anf Food Chemistry, 48: 5501- 5506.                                [31] Park, Y. S. Jung, S. T. Kang, S. G. Drzewiecki, J. Namiesnik, J. &
[11]   Bocco, A. Cuvelier, M. E. Richard, H. & Berset, C. 1998. Journal of                 Haruenkit, R. 2006. International Journal of Food Science and
       Agricuture and Food Chemistry, 46: 2123-2129.                                       Nutrition. 57: 107–122.
[12]   Gil-Izquierdo, A. Gil, M. I. & Ferreres, F. 2002. Journal of Agricture         [32] Sultana, B. Anwar, F. Asi, M. R. & Chatha, S. A. S. 2008. Grasas
       Food Chemistry, 50: 5107−5114.                                                      Aceites.59: 205-217.
[13]   Lee, H. S. & Castle, W. S. 2001. Journal of Agriculture Food                   [33] Wright, K. P. Kader, A. A. & Psatharu, A. 1997. Biological
       Chemistry. 49: 877−882.                                                             Technology. 10: 39-48.
[14]   Arancibia-Avila, P. Toledo, F. Park, Y. S. Jung, S. T. Kang, S. G. &           [34] Gardner, P. T. White, T. A. C. Mcphailand, D. B. & Duthie, G. G.
       Heo, B. G. 2008. Food Science and Technology, 41: 2118–2125.                        2000. Food Chemistry, 68: 471-474.
[15]   Leontowicz, H. Leontowicz, M. Haruenkit, R. Poovarodom, S.                     [35] Hussain, A. I. Anwar, F. Sheraziand, S. T. H. & Przybylski, R. 2008.
       Jastrzebski, Z. & Drzewiecki, J. 2008. Journal of Food and Chemical                 Food Chemistry. 108: 986-995.
       Toxicology, 486: 581–589.                                                      [36] Scott, G. 1977. Chichester, Albion Publishing, England.
[16]   Toledo, F. Arancibia-Avila, P. Park, Y. S. Jung, S. T. Kang, S. G. &           [37] Hainida, E. Ikram, K. Eng, K. H. Jalil, A. M. M. Ismail, M. Idris, S.
       Heo, B. G. 2008. International Journal of Food Science and Nutrition.               Azlan, A. Nazri, H. S. M. Diton, N. A. M. & Mokhtar, R. A. M. 2009.
       59: 415–427.                                                                        Journal of Food Components and Analysis. 22: 388-393.
[17]   Chansiripornchai, N. Chansiripornchai, P.           & Pongsamart, S.           [38] Cheng, G. W. & Breen, P. J. 1991. Journal of American Society of
       2008.Acta Horticulture, 786: 57–60.                                                 Horticulture Science.116 : 865–869.
[18]   Daniel, R. S. Aziz, I. Than, W. & Thomas, W. M. S. 2008. Asia                  [39] Vinson, J. A. Su, X. Zubic, L. & Bose, P. 2001. Journal of
       Pacific Journal of Clinical Nutrition. 17 : 35– 39.                                 Agriculture Food Chemistry. 49: 5315–5321.
[19]   Siondalski, P. & Lysiak-Szydlowska, W. 2007. Chemical and                      [40] Rice-Evanand, C. A. & Miller, N. 1996. Journal of Biochemical
       functional properties of food components , Boca Raton, FL: CRC                      Society Transactions. 24: 790-800.
       Press LLC, Vol.3, pp. 439–450.                                                 [41] Marin, F. R. Martinez, M. Uribesalgo, T. Castillo, S. & Frutos, M.
[20]   Phutdhawong, W. Kaewkong, S. & Buddhasukh, D. 2005. Malaysian                       2002. Food Chemistry. 78:319-324.
       Journal of Science. 32 :169–172.                                               [42] Chun, O. K. Kim, D. O. Smith, N. Schroeder, D. Hanand, J. T & Lee,
[21]   Yaacob, O. & Subhadrabandhu, S. 1995.The production of economic                     C. Y. 2005. Journal of Science Food Agriculture, 85:1715-1724.
       fruits in South-East Asia, Oxford University Press, Kuala Lumpur.              [43] Campbell, J. K. King, J. L. Harmston, M. Lila, M. A. & Erdman J. W.
[22]   Weenen, H. Koolhaas, W. E. & Apriyantono, A. 1996. Journal of                       2006.     Journal     of    Food     Science,     71:   S358–S363.
       Agricultural Food Chemistry, 44 : 3291-3293.

                                                                                135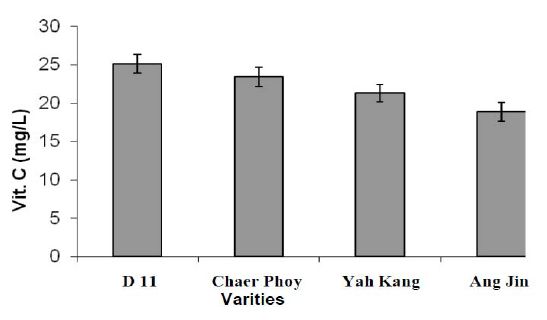
You can also read