Estimation of radiation dose from ingested tritium in humans by administration of deuterium labelled compounds and food
←
→
Page content transcription
If your browser does not render page correctly, please read the page content below
www.nature.com/scientificreports
OPEN Estimation of radiation
dose from ingested tritium
in humans by administration
of deuterium‑labelled compounds
and food
Tsuyoshi Masuda1* & Toshitada Yoshioka2
Radiation doses from organically bound tritium (OBT) in foods have been a major concern near
nuclear facilities. The current dose coefficient for OBT is calculated using a standard model from the
International Commission on Radiological Protection, in which some biokinetic values are not based
on human metabolic data. Here, the biokinetics of ingested OBT, and radiation doses from them,
were estimated by administering labelled compounds and foods to volunteers, using a deuterium (D)
tracer as a substitute for tritium. After the administration of D-labelled glucose, alanine, palmitic acid,
or soybean, the D/H ratios in urine were measured for up to 119 days, and the biokinetic parameter
values were determined for OBT metabolism. The slow degradation rates of OBT could not be
obtained, in many volunteers administered glucose and alanine. The estimated committed effective
dose for 1 Bq of tritium in palmitic acid varied from 3.2 × 10⁻¹¹ to 3.5 × 10⁻¹⁰ Sv Bq−1 among volunteers
and, for those administered soybean, it varied from 1.9 × 10⁻¹¹ to 1.8 × 10⁻¹⁰ Sv Bq−1. These results
suggest that OBT, present in some ingested ingredients, gives higher doses than the current dose
coefficient value of 4.2 × 10⁻¹¹ Sv Bq−1.
Tritium is released from facilities such as nuclear power plants, especially heavy water reactors and spent nuclear
fuel reprocessing plants, under normal operating conditions. In 2008, the average global annual release of tritium
from nuclear facilities, into atmosphere and water, was estimated to be 11.7 PBq and 16.0 PBq, respectively1.
In the future, a significant increase is anticipated in the release of tritium from nuclear fusion reactors, such as
the International Thermonuclear Experimental Reactor (ITER). Although most of the released tritium is inor-
ganic, in the form of tritiated water (HTO) and gaseous, tritiated hydrogen (HT), part of the released tritium is
incorporated into organic molecules in plants and animals, and then transferred to humans via food ingestion,
as organically bound tritium (OBT)2,3; OBT refers in this paper to carbon-bound tritium in organic molecules
formed in living systems by natural biological p rocesses4. Therefore, near such nuclear facilities, the dose from
ingested OBT is a public concern.
In order to estimate the potential effect of ingestion of OBT, the dose coefficient is used: the ratio of the 50-year
committed effective dose for 1 Bq of ingested OBT. The International Commission on Radiological Protection
(ICRP) has utilised a two-compartment metabolic model, shown in Fig. 1, to calculate the dose coefficient of OBT
for members of the p ublic5, although it has adopted a more complex model to calculate the value for w orkers4.
The ICRP OBT model consists of free water tritium (FWT) and OBT compartments, with residual half-lives
of 10 and 40 days, respectively. In this model, 50% of ingested OBT is distributed to the FWT compartment by
immediate metabolic degradation, while the rest of the ingested OBT is distributed to the OBT compartment5.
Studies that provide data supporting the choice of these values (10 days, 40 days, and 50%) are important from
the viewpoint of nuclear safety for members of the public. However, there has been a lack of metabolic data from
humans, as described below.
Many studies have examined the half-life of FWT in humans. Butler and Leroy reported values from 310 cases,
in 1965, ranging from 4 – 18 days, with a mean of 9.5 days6. Based on fewer cases, other studies have reported
mean half-lives of 7.5, 8.5, 9.5, 9.5, 10.5, and 11.3 days7–12. Hill and Johnson reviewed these data and reported a
1
Institute for Environmental Sciences, Aomori, Japan. 2Hirosaki Gakuin University, Aomori, Japan. *
email:
masuda@ies.or.jp
Scientific Reports | (2021) 11:2816 | https://doi.org/10.1038/s41598-021-82460-5 1
Vol.:(0123456789)
www.nature.com/scientificreports/
Figure 1. Structure of metabolic model of hydrogen isotopes. ICRP OBT is the model adopted by the
International Commission on Radiological Protection (ICRP) to calculate the dose coefficient for ingested
OBT5. HDO and OBD, the models developed to analyse the amount of D excreted through urine after
administration of D-labelled compounds and food. FWT, free water tritium; OBT, organically bound tritium;
DT, digestive tract; OBD, organically bound deuterium; FWD, free water deuterium; dm, distribution factor, km,
excretion rate constant ( day−1).
mean half-life of 9.4 days, with lower and upper 90% confidence intervals of 5 and 13 days, r espectively13. These
results, obtained from humans, have supported the use of the ‘10-day’ value for half-life of FWT, as used in the
existing ICRP OBT model.
However, few studies in humans have examined the biokinetics of tritium derived from ingested OBT. Many
studies have reported the biokinetics of tritium in rodents, after the administration of OBT in foods such as
wheat14, rice15, and soybean15, or in the component molecules of major nutrients, such as amino acids16–19, fatty
acids17, and c arbohydrates17–19. Hunt et al.20 examined the retention time of tritium in urine from volunteers
after the administration of flesh from fish procured from a fisherman in Cardiff Bay (UK), which was contami-
nated with discharged tritium from the GE Healthcare plant. They reported the retention function as having a
fast-decreasing component, with half-lives ranging from 4 to 11 days, which they considered to correspond to
the FWT compartment. A second component, with a longer half-life, corresponding to the OBT compartment,
was not detected due to the background fl uctuation20. Since there have been few biokinetic studies on OBT in
humans, the half-life of tritium in the OBT compartment (40 days) used in the ICRP OBT model, was calculated
by the excretion rate derived from the mass balance data for carbon (16 kg of body carbon and 300 g d −1 of intake/
excreted carbon) in a reference m an21. This is because the tritium bound to carbon is fixed until the compound
is metabolically degraded to HTO and carbon dioxide; therefore, the metabolic rate of OBT is considered to be
approximately equal to that of organic carbon.
The distribution ratio of ingested OBT to the FWT compartment in the ICRP model (50%) is not based on
experimental metabolic data for OBT, or organic carbon, in humans. This ratio was considered a conservative
assumption, from a regulatory perspective, based on metabolic data obtained from animals such as m ice22,
rabbits23, rats24, and kangaroo r ats25. For a more realistic estimation of dose from ingested OBT, we need experi-
mental data from humans26,27.
In this paper, we report the results of experiments with administered deuterium (D)-labelled compounds as
follows: D2O, D-labelled glucose, D-labelled alanine, D-labelled palmitic acid, and D-labelled soybean. Deute-
rium is a stable isotope of hydrogen. Isotopes have an almost identical rate of chemical reaction. However, this
can differ significantly in cases where the molecular weights of molecules involved in the reaction are relatively
Scientific Reports | (2021) 11:2816 | https://doi.org/10.1038/s41598-021-82460-5 2
Vol:.(1234567890)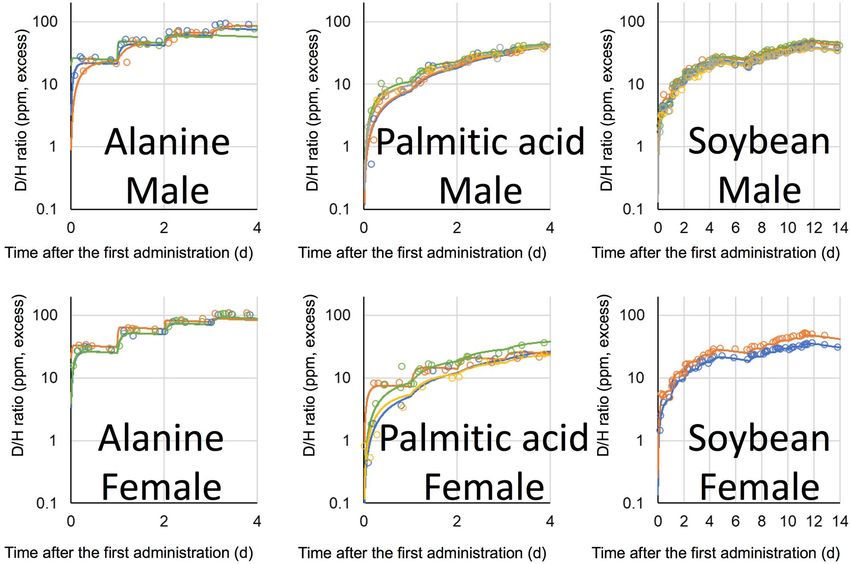
www.nature.com/scientificreports/
Figure 2. D/H ratios in urine after single oral administration of D2O and D-labelled glucose. The ratio was
normalized to the same dosage per body weight (1 g D per 70 kg). Lines were fitted using models shown in
Fig. 1. Data below the 90% upper confidence limit of the background fluctuation for each volunteer, and the
subsequent data after elimination from the fit, are shown by crosses. Each colour represents a different volunteer.
small. Priest et al. examined the retention time of tritium in mice, after the administration of various tritiated
compounds; in biokinetics, no difference was observed between HTO and D TO16. Since, in common with
tritiated compounds, the molecular weights of molecules with organically bound deuterium (OBD) are higher
than that of inorganic molecules, the biokinetics of OBD are considered the same as those of OBT. Therefore,
deuterium labelling was used as a substitute for tritium labelled compounds and foods, for the study of metabolic
rates of OBT.
Results and discussion
D/H ratios in urine and 13C/12C ratios in breath. D2O and D-labelled glucose were administered once
to volunteers, orally, while D-labelled alanine and D-labelled palmitic acid were administered once daily for four
successive days. The D/H ratios in urine, after the administration of D 2O and D-labelled glucose, are shown in
Fig. 2, and those of D-labelled alanine and D-labelled palmitic acid are shown in Fig. 3. Boiled green soybean,
which was cultivated hydroponically in 20% D 2O solution, was administered as D-labelled soybean on week-
days, for 2 weeks, and the subsequent D/H ratios in urine are shown in Fig. 4. It is noteworthy that, in all figures
showing D/H ratios in urine, the ratios are shown as increments above the background values measured before
administration, and are normalised to the same dosage per body weight (1 g D per 70 kg). After the adminis-
tration of D2O and D-labelled glucose, the D/H ratios increased and then decreased, within two exponential
Scientific Reports | (2021) 11:2816 | https://doi.org/10.1038/s41598-021-82460-5 3
Vol.:(0123456789)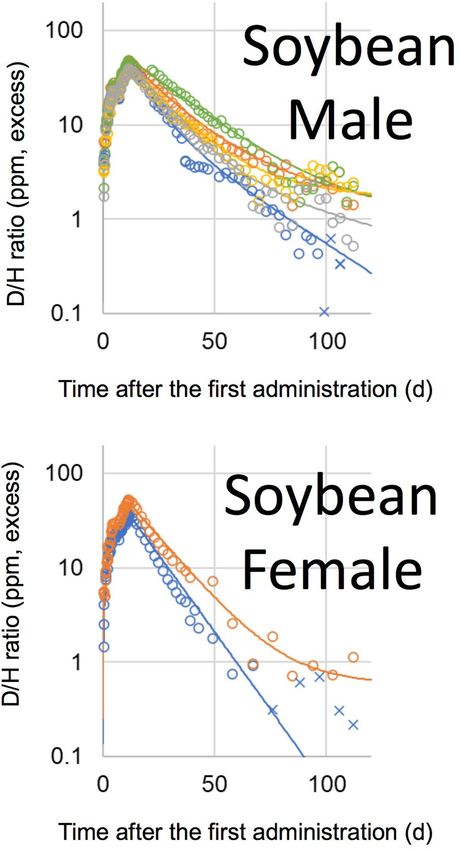
www.nature.com/scientificreports/
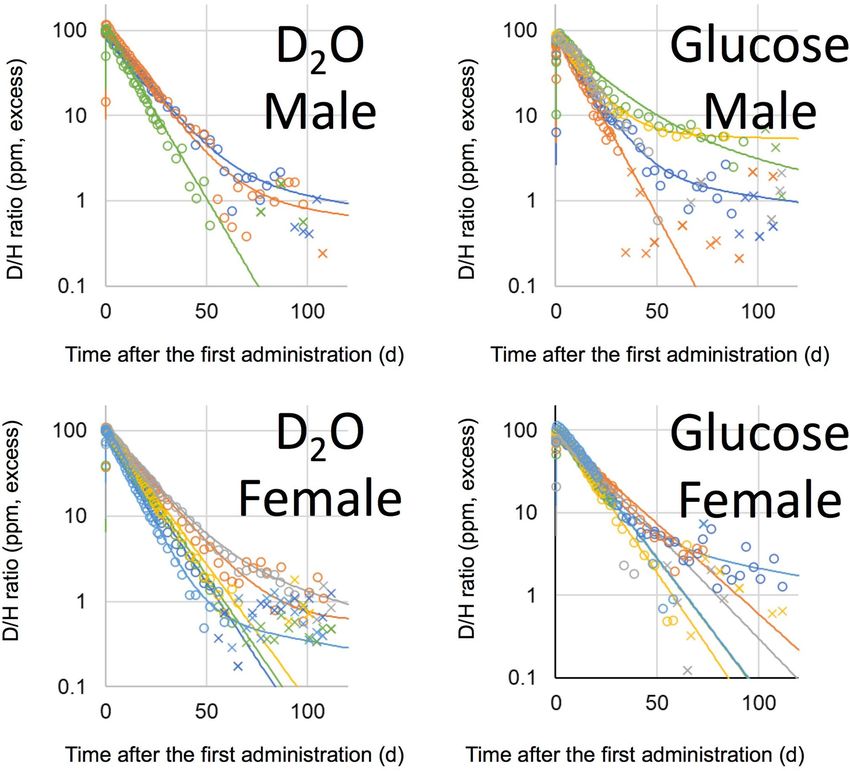
Figure 3. D/H ratios in urine, after oral administration of D-labelled alanine and palmitic acid, over four
successive days. The ratio was normalized to the same dosage per body weight (1 g D per 70 kg). Lines were
fitted using models shown in Fig. 1. Data below the 90% upper confidence limit of the background fluctuation
for each volunteer, and the subsequent data after elimination from the fit, are shown by crosses. Each colour
represents a different volunteer.
components, in 2 of 3 male volunteers and 2 of 6 female volunteers in the D2O group, and in 3 of 5 males and
1 of 5 female volunteers in the glucose group. However, the second component was not detected for the rest of
the volunteers because of the rapid decrease in the ratios to below the limit (90% upper confidence limit of the
background fluctuation of urine samples from each volunteer obtained before the administration) to cut off data
and any subsequent data. The D/H ratios in urine, during the administration of D-labelled alanine, palmitic
acid, and soybean, increased at each time point (Fig. 5). After the peak of the last administration, the ratios
decreased exponentially within one or both components (Figs. 3, 4) similarly to changes observed in volunteers
administered with D2O and D-labelled glucose. For the volunteers with D-labelled glucose, alanine, and palmitic
acid, the 13C-labelled compounds were administered simultaneously. The excess of the 13C/12C ratios in breath,
above the background ratio, were normalised to the same dosage per body weight (1 g 13C per 70 kg), and are
shown in Fig. 6. The 13C/12C ratios of alanine and palmitic acid showed steep peaks, in contrast to the gradual
increase in D/H ratios for volunteers given these compounds. The half-life of FWT is significantly higher than
the reported half-life of carbon dioxide measured by intravenous injection of 14C-bicarbonate (5 min)28. The
difference between the D/H and 13C/12C ratios was considered to be due to the difference in the metabolisms
of HDO and 13CO2, because the metabolic degradation rates of D-labelled and 13C-labelled compounds were
considered the same until they degraded into inorganic molecules. The degradation ratio for OBT and organic
carbon is assumed as the same by the ICRP5.
Biokinetics of deuterium ingested as D2O. We developed metabolic models to analyse the data
obtained from each volunteer administered D-labelled compounds or food. The structure of these models is
Scientific Reports | (2021) 11:2816 | https://doi.org/10.1038/s41598-021-82460-5 4
Vol:.(1234567890)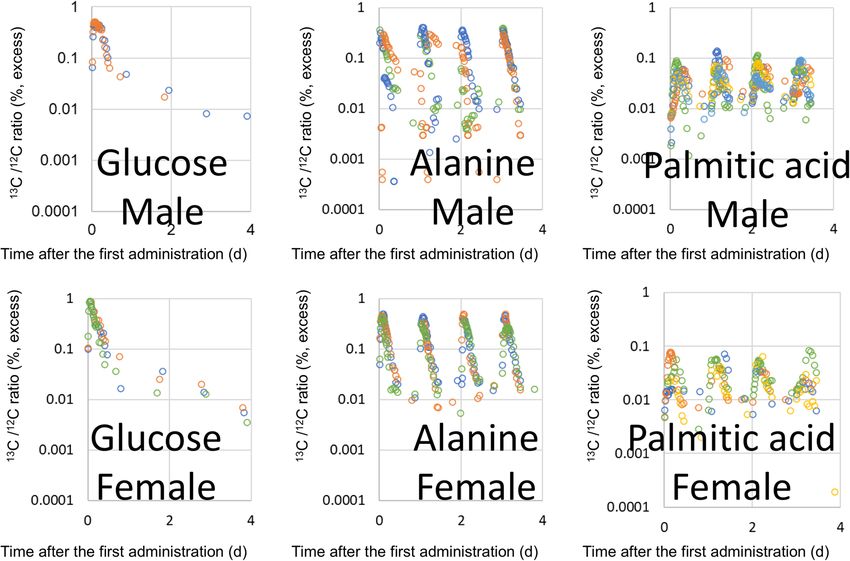
www.nature.com/scientificreports/
Figure 4. D/H ratios in urine, after oral administration of D-labelled soybean for 2 weeks, except for Saturday
and Sunday. The ratio was normalized to the same dosage per body weight (1 g D per 70 kg). Lines were fitted
using models shown in Fig. 1. Data below the 90% upper confidence limit of the background fluctuation for
each volunteer, and the subsequent data after elimination from the fit, are shown by crosses. Each colour
represents a different volunteer.
shown in Fig. 1. The parameter values in the metabolic model for each volunteer were determined by the least
squares method, and are summarised in Tables 1, 2, 3, 4 and 5.
The mean half-lives and standard deviations for the free water deuterium (FWD) compartment of the HDO
models, as estimated from the data of D2O-administered males (n = 3), females (n = 6), and the combined group
of volunteers, were 10 ± 2, 10 ± 3, and 10 ± 3 days, respectively (Fig. 7). These values were comparable to the
reported half-lives of the FWT described above and to the value given by the ICRP OBT model. These results
support the assumption that the biokinetics of OBD are equivalent to that of OBT.
The half-lives of the OBD compartment in the HDO models were estimated using data from 1 of 3 male and 3
of 6 female D2O-administered volunteers. The second component of the exponential decrease was not observed
in the remaining volunteers in the group. The values obtained varied from 44 to 107 days. Balonov et al. studied
the metabolism of HTO after its injection, inhalation, and ingestion, and reported that the second component
of HTO decreased with a half-life ranging from 39 to 76 days29. Trivedi et al. (1997) reported a longer half-life,
Scientific Reports | (2021) 11:2816 | https://doi.org/10.1038/s41598-021-82460-5 5
Vol.:(0123456789)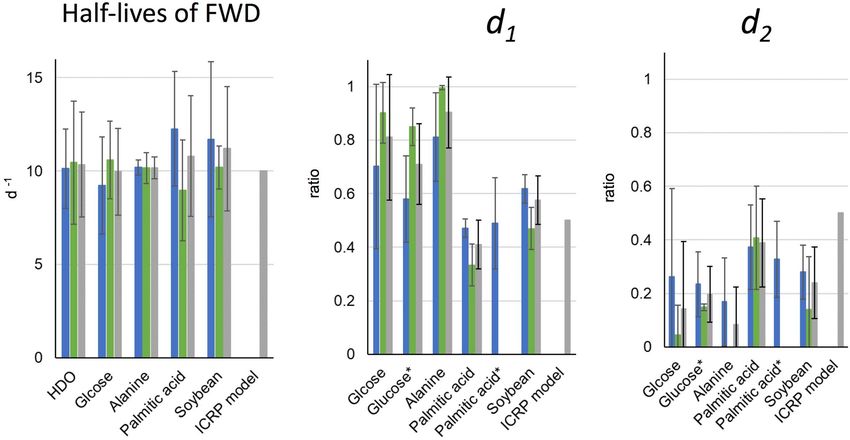
www.nature.com/scientificreports/
Figure 5. D/H ratios in urine after the oral administration of D-labelled alanine, palmitic acid, and soybean for
4, 4, and 14 days, respectively; all panels are the enlargement of the same data shown in Figs. 3 and 4. The ratio
was normalized to the same dosage per body weight (1 g D per 70 kg). Lines were fitted using a model shown in
Fig. 1. Each colour represents a different volunteer. D-labelled alanine and palmitic acid were administered over
four successive days. D-labelled soybean was administered daily for 2 weeks, except for Saturday and Sunday.
ranging from 58 to 104 days, in urine from workers exposed to HTO30. Our results are comparable to these,
although the longer half-lives of the second component were considered to be affected by the observation period.
Half‑lives of the FWD compartment in the OBD models. The half-lives of the FWD compartment
in the OBD models estimated using data from volunteers administered with D-labelled glucose (n = 11), ala-
nine (n = 6), palmitic acid (n = 9), and soybean (n = 7), were 10 ± 2, 10 ± 1, 11 ± 3, and 11 ± 3 days, respectively
(Fig. 7). The difference between male and female volunteers was not significant (p > 0.05) for either compound or
food. The mean half-life of FWD for each compound and food did not vary significantly (p > 0.05). Values were
approximately comparable to half-lives of the fast-decreasing component, reported from experiments adminis-
tering HTO6–13 and OBT20 described above, and the value used in the ICRP OBT model5. These results indicate
that the half-lives of FWD in the OBD models were independent of the metabolic degradation rates of ingested
compounds and foods, and corresponded to the half-life of FWD in each volunteer.
Distribution ratios (d1) to the FWD compartment in the OBD models. The mean distribution
ratios (d1) for glucose, to the FWD compartment, determined in males (n = 5), females (n = 6), and in the com-
bined group, were 70 ± 31%, 90 ± 11%, and 81 ± 23%, respectively (Fig. 7). In a previous study, the biokinetics
of organic carbon were investigated using 13C-labelled compounds, including the administering of 13C-labelled
glucose to males and females, and 13C-labelled palmitic acid to male v olunteers31. The ratios reported from this
previous study were approximately equivalent to ours: male, 58 ± 16%; female, 85 ± 7%; and all, 71 ± 15% (Fig. 7).
The mean distribution ratios (d1) determined from the data in male (n = 5) and female (n = 4) volunteers in the
palmitic acid group were 47 ± 3% and 33 ± 8%, respectively. The ratio for male was comparable to the ratio found
for male volunteers treated with 13C-labelled palmitic acid (49 ± 17%) in the previous paper (Fig. 7). These results
exhibit the same metabolic rate for each compound, independent of the isotope label used. The difference in the
distribution ratios between male and female volunteers administered palmitic acid was significant (p < 0.01). The
ratio of body fat to body weight in a healthy Japanese aging from 20 to 29 years is larger in females (28.4 ± 7.0%)
than that in males (18.7 ± 6.6%)32. The cause of the smaller d1 value in female volunteers was presumed to be
the larger transfer ratio to body fat due to the larger mass of body fat compared with that for male volunteers.
Melintescu et al. have estimated significantly larger retention of tritium from OBT intake for females than for
Scientific Reports | (2021) 11:2816 | https://doi.org/10.1038/s41598-021-82460-5 6
Vol:.(1234567890)www.nature.com/scientificreports/
Figure 6. 13C/12C in breath after the oral administration of 13C -labelled glucose, alanine, and palmitic acid.
Each colour represents a different volunteer. 13C -labelled alanine and palmitic acid were administered over four
successive days. 13C -labelled glucose soybean was administered once at day 0.
Volunteer
Male Female All
Parameter 1 2 3 Average S.D 1 2 3 4 5 6 Average S.D Average S.D
ka (d−1) 39 8.6 21 23 15 92 14 6.4 21 8.9 23 28 32 26 26
ke (d−1) 0.059 0.063 0.090 0.071 0.017 0.081 0.043 0.078 0.072 0.056 0.098 0.071 0.020 0.071 0.018
k1 (d−1) 0.0091 0.0083 – 0.0087 0.0005 – 0.019 – – 0.0067 0.0074 0.011 0.007 0.010 0.005
k2 (d−1) 0.0092 0.0065 – 0.0079 0.0020 – 0.0017* – – 0.016 0.010 0.013 0.007 0.010 0.0053
T1/2 ka (d−1) 0.018 0.080 0.033 0.044 0.032 0.0075 0.051 0.11 0.033 0.078 0.030 0.051 0.037 0.049 0.034
T1/2 ke (d−1) 12 11 7.7 10 2 8.6 16 8.9 9.6 12 7.1 10 3 10 3
T1/2 k1 (d−1) 76 83 – 80 5 – 36 – – 104 94 78 36 79 26
T1/2 k2 (d−1) 75 107 – 91 23 – – – – 44 68 56 17 74 26
Rr 0.91 1.0 0.92 0.94 0.05 0.70 0.97 0.97 0.93 1.0 0.99 0.93 0.12 0.93 0.10
Table 1. Estimated parameters of HDO model for each D2O administered volunteer. S.D., standard deviation.
ka, transfer rate from digestive tract (DT) compartment to free water deuterium (FWD) compartment ( d−1); k1,
transfer rate from organically bound deuterium (OBD) compartment to FWD compartment ( d−1); k2, transfer
rate from FWD compartment to OBD compartment (d−1); ke, excretion rate from FWD compartment (d−1);
T1/2 km, half-life of km (d); Rr, recovery ratio to the administered deuterium. The structure of the HDO model
and the parameters are shown in Fig. 1. Parameter values were determined by the least squares method except
for the value accompanied with asterisk. *Presumed value of data that did not show a clear indication of the
second component of exponential decrease.
males due to the higher adipose mass in their physiologically based multicompartment model33. Our results
were consistent with their estimations.
Scientific Reports | (2021) 11:2816 | https://doi.org/10.1038/s41598-021-82460-5 7
Vol.:(0123456789)www.nature.com/scientificreports/
Volunteer
Male Female All
Parameter 1 2 3 4 5 Average S.D 1 2 3 4 5 6 Average S.D Average S.D
d1 0.77 0.85 0.73 0.18 0.99 0.70 0.31 0.73 0.81 0.98 1.0 0.88 1.0 0.90 0.11 0.81 0.23
d2 0.23 0.0 0.27 0.81 0.0 0.26 0.33 0.27 0.0 0.0 0.0 0.0 0.0 0.045 0.110 0.14 0.25
ka (d−1) 3.3 5.3 12 501 3.6 105 222 77 11 5.9 8.8 5.6 11 20 28 59 148
ke (d−1) 0.085 0.097 0.050 0.085 0.078 0.079 0.017 0.073 0.049 0.072 0.081 0.057 0.072 0.067 0.012 0.073 0.015
k1 (d−1) 0.0070 – 0.010 0.0017* – 0.0062 0.0047 0.0095 – – – – – 0.0095 – 0.0070 0.0041
T1/2 ka (d−1) 0.21 0.13 0.059 0.0014 – 0.10 0.09 0.0090 0.065 0.12 0.078 0.12 0.060 0.076 0.042 0.086 0.062
T1/2 ke (d−1) 8.1 7.1 14 8.2 8.9 9.2 2.6 9.5 14 9.6 8.6 12 9.6 11 2 10 2
T1/2 k1 (d−1) 100 – 66 – – 83 23 73 – – – – – 73 – 80 17
Rr 1.0 0.85 1.0 0.99 0.99 0.96 0.07 1.0 0.81 0.98 1.0 0.88 1.0 0.95 0.08 0.95 0.07
Table 2. Estimated parameters of OBD model for each volunteer administered with D-labelled glucose. S.D.,
standard deviation. ka, transfer rate from digestive tract (DT) compartment to free water deuterium (FWD)
and organically bound deuterium (OBD) compartments (d−1); k1, transfer rate from OBD compartment to
FWD compartment (d−1); ke, excretion rate from FWD compartment (d−1); T1/2 km, half-life of km (d); Rr,
recovery ratio to the administered deuterium; d1, distribution factor to FWD compartment; d2, distribution
factor to OBD compartment. The structure of the OBD model and the parameters are shown in Fig. 1.
Parameter values were determined by the least squares method except for the value accompanied with asterisk.
*Presumed value of data that did not show a clear indication of the second component of exponential decrease.
Volunteer
Male Female All
Parameter 1 2 3 Average S.D 1 2 3 Average S.D Average S.D
d1 0.82 0.94 0.67 0.81 0.14 1.0 1.0 0.99 1.0 0.01 0.90 0.13
d2 0.18 0.0 0.33 0.17 0.16 0.0 0.0 0.0 0.0 0.0 0.085 0.14
ka (d−1) 15 3.6 112 44 60 13 79 15 35 37 39 45
ke (d−1) 0.065 0.071 0.068 0.068 0.003 0.074 0.068 0.063 0.069 0.006 0.068 0.004
k1 (d−1) 0.011 – 0.0066 0.0088 0.0031 – – – – – 0.0088 0.0031
T1/2 ka (d−1) 0.047 0.19 0.0062 0.082 0.098 0.055 0.0088 0.046 0.036 0.024 0.059 0.068
T1/2 ke (d−1) 11 9.8 10 10 0 9.3 10 11 10 1 10 1
T1/2 k1 (d−1) 63 – 105 84 29 – – – – – 84 29
Rr 1.0 0.94 1.0 0.98 0.03 1.0 1.0 0.99 1.0 0.01 0.99 0.02
Table 3. Estimated parameters of OBD model for each volunteer administered with D-labelled alanine. S.D.,
standard deviation; ka, transfer rate from digestive tract (DT) compartment to free water deuterium (FWD)
and organically bound deuterium (OBD) compartments (d−1); k1, transfer rate from OBD compartment to
FWD compartment (d−1); ke, excretion rate from FWD compartment (d−1); T1/2 km, half-life of km (d); Rr,
recovery ratio to the administered deuterium; d1, distribution factor to FWD compartment; d2, distribution
factor to OBD compartment. The structure of the OBD model and the parameters are shown in Fig. 1.
Parameter values were determined by the least squares method.
The mean distribution ratios (d1) to the FWD compartment, estimated from the data in D-labelled alanine-
administered male (n = 3) and female (n = 3) volunteers were 81 ± 14% and 100 ± 0%, respectively. The metabolism
differs between amino acids. From previous experiments involving the administration of 13C-labelled compounds,
the mean distribution ratios of amino acids were obtained from male and female volunteers as follows: glutamic
acid, 64 ± 9% and 63 ± 45%, respectively; glycine, 36 ± 4% and 40 ± 1%, respectively; phenylalanine, 31 ± 3% and
40 ± 4%, respectively; and leucine, 45 ± 6%, obtained from male volunteers only31. Our data for alanine gave much
larger ratios than these amino acids (p < 0.01).
Using the d1 of glucose, alanine, and palmitic acid described above, the d1 of soybean was estimated to be
a weighted mean of these ratios according to the nutritional balance of green soybean, in the assumption that
these compounds represent carbohydrates, proteins, and lipids, respectively. The estimated distribution ratio
(d1) for soybean based on these compounds (73 ± 8%) was greater than that obtained by the D-labelled soybean
administration experiment (58 ± 9%). The reason for the difference was presumed to be the representativeness of
alanine and palmitic acid as amino acid and lipid. The ratio of alanine was greater than the ratios of other amino
acids, as described above, and the ratio of palmitic acid was greater than the reported ratio of unsaturated fatty
acids obtained by the 13C-labelled experiment in a previous paper as follows: oleic acid, 35 ± 11%; linoleic acid,
29 ± 12%31. Our estimation of ratio (53 ± 7%) improved when we additionally considered the ratios obtained by
the 13C-labelled compound administration experiments (see “Methods”).
Scientific Reports | (2021) 11:2816 | https://doi.org/10.1038/s41598-021-82460-5 8
Vol:.(1234567890)www.nature.com/scientificreports/
Volunteer
Male Female All
Parameter 1 2 3 4 5 Average S.D 1 2 3 4 Average S.D Average S.D
d1 0.49 0.51 0.49 0.43 0.45 0.47 0.03 0.36 0.29 0.43 0.25 0.33 0.08 0.41 0.09
d2 0.51 0.24 0.23 0.57 0.42 0.40 0.15 0.55 0.59 0.21 0.27 0.41 0.19 0.40 0.16
ka (d−1) 0.93 0.91 2.1 2.0 1.8 1.5 0.6 0.79 12 1.4 1.7 4.0 5.4 2.6 3.6
ke (d−1) 0.059 0.055 0.078 0.063 0.040 0.059 0.014 0.11 0.099 0.059 0.064 0.083 0.025 0.070 0.022
k1 (d−1) 0.0070 0.0077 0.0086 0.0019 0.0017* 0.0063 0.0031 0.010 0.0024 0.013 0.013 0.0097 0.0051 0.0080 0.0042
T1/2 ka (d−1) 0.75 0.76 0.33 0.35 0.39 0.51 0.22 0.88 0.057 0.50 0.40 0.46 0.34 0.49 0.26
T1/2 ke (d−1) 12 13 8.9 11 17 12 3 6.3 7.0 12 11 9.0 2.7 11 3
T1/2 k1 (d−1) 98 90 80 373 – 161 142 67 294 52 53 117 119 138 125
Rr 1.0 0.76 0.72 1.0 0.87 0.87 0.13 0.92 0.89 0.64 0.53 0.74 0.19 0.81 0.16
Dose coefficient
10 5.4 4.2 36 22 16 13 7.3 29 3.2 3.5 11 12 13 12
(× 10–11 Sv Bq−1)
Table 4. Estimated parameters of OBD model for each volunteer administered with D-labelled palmitic
acid. S.D., standard deviation. ka, transfer rate from digestive tract (DT) compartment to free water
deuterium (FWD) and organically bound deuterium (OBD) compartments ( d−1); k1, transfer rate from OBD
compartment to FWD compartment (d−1); ke, excretion rate from FWD compartment (d−1); T1/2 km, half-life
of km (d); Rr, recovery ratio to the administered deuterium; d1, distribution factor to FWD compartment; d2,
distribution factor to OBD compartment. The structure of the OBD model and the parameters are shown in
Fig. 1. Parameter values were determined by the least squares method except for the value accompanied with
asterisk. *Presumed value of data that did not show a clear indication of the second component of exponential
decrease.
Volunteer
Male Female All
Parameter 1 2 3 4 5 Average S.D 1 2 Average S.D Average S.D
d1 0.59 0.61 0.70 0.56 0.62 0.62 0.05 0.41 0.52 0.47 0.08 0.58 0.09
d2 0.26 0.24 0.29 0.44 0.16 0.28 0.10 0.0 0.28 0.14 0.19 0.24 0.14
ka (d−1) 2.7 4.7 2.8 3.0 2.4 3.1 0.9 2.6 3.8 3.2 0.8 3.1 0.81
ke (d−1) 0.10 0.058 0.041 0.055 0.064 0.063 0.022 0.074 0.063 0.068 0.008 0.065 0.019
k1 (d−1) 0.035 0.011 0.0022 0.0034 0.013 0.013 0.013 – 0.0012 0.0012 – 0.011 0.013
T1/2 ka (d−1) 0.25 0.15 0.25 0.23 0.29 0.23 0.05 0.27 0.18 0.22 0.06 0.23 0.05
T1/2 ke (d−1) 6.9 12 17 13 11 12 4 9.4 11 10 1 11 3
T1/2 k1 (d−1) 20 61 311 205 53 130 124 – 578 578 – 205 214
Rr 0.86 0.85 1.0 1.0 0.78 0.90 0.10 0.41 0.80 0.61 0.28 0.81 0.20
Dose coefficient (× 10–
11 1.9 4.2 18 17 2.9 8.7 7.8 N.D N.D – – – –
Sv Bq−1)
Table 5. Estimated parameters of OBD model for each volunteer administered with D-labelled soybean. S.D.,
standard deviation. ka, transfer rate from digestive tract (DT) compartment to free water deuterium (FWD)
and organically bound deuterium (OBD) compartments (d−1); k1, transfer rate from OBD compartment to
FWD compartment (d−1); ke, excretion rate from FWD compartment (d−1); T1/2 km, half-life of km (d); Rr,
recovery ratio to the administered deuterium; d1, distribution factor to FWD compartment; d2, distribution
factor to OBD compartment. The structure of the OBD model and the parameters are shown in Fig. 1.
Parameter values were determined by the least squares method. N.D., not determined.
The procedure used to estimate the distribution ratio of soybean, which utilised the ratios of various com-
pounds estimated by both D- and 13C-labelled compound administration experiments, was applied to the esti-
mation of dietary reference intakes, to validate the ratio in the ICRP model. The ratios calculated for reference
intakes in J apan34 and the United S tates35, with a relatively high carbohydrate and high fat content, respectively,
were 68 ± 15% and 66 ± 14%. These values were slightly higher than those in the ICRP model were (50%). The
estimated dose coefficients, from the ICRP model, when the ratio of 50% is replaced by the ratios of 68% and 66%,
were 3.3 × 10⁻¹¹ and 3.4 × 10⁻¹¹ Sv Bq−1, respectively. These values are slightly smaller than the dose coefficient
used in the ICRP model (4.2 × 10⁻¹¹ Sv Bq−1), and suggest that the ratio of 50% adopted by the ICRP was cautious.
The distribution ratio in the D-labelled soybean administration experiment (48 ± 16%) was approximately
comparable to the distribution ratio to the FWT compartment in the ICRP model. In rats, the cumulative excre-
tion of tritium in urine, during continuous feeding on tritiated rice, was greater than that shown in tritiated
soybean15. Obtaining such data in humans for other major foods may help to support the ratio used in the ICRP
model.
Scientific Reports | (2021) 11:2816 | https://doi.org/10.1038/s41598-021-82460-5 9
Vol.:(0123456789)www.nature.com/scientificreports/
Figure 7. Biokinetic parameters of the OBD metabolic models. The model structure is shown in Fig. 1. Half-
lives of FWD, the half-life of deuterium (D) in free water D (FWD) compartment among volunteers of each
group; d1, distribution factor to FWD; d2, distribution factor to OBD compartment; blue, male volunteers; green,
female volunteers; grey, all volunteers. Error bar shows the standard deviation among volunteers in each group.
*The values obtained from 13C-labelled compound administration e xperiments31. In those case, the ratios of the
first and the second component of the exponential decrease in 13C/12C ratios in breath corresponded to d1 and
d2, respectively.
Half‑lives of the OBD compartment in OBD models. The second component of the exponential
decrease was not observed in some volunteers in the glucose and alanine groups (Figs. 2, 3). The distribution
ratios d1 in the OBD models of glucose and alanine were 81 ± 23% and 90 ± 13%, respectively. In those volunteers,
the second component seemed to be below the background fluctuation, since most of the administered OBD was
considered to be immediately degraded to FWD. Further studies are necessary to clarify the half-lives of OBT,
for such molecules.
The second component was observed in almost all volunteers in the palmitic acid and soybean groups, except
for one female volunteer in the soybean group. The half-life of the OBD compartment was calculated from k1 in
each volunteer. The half-lives varied markedly among volunteers, as follows: males treated with palmitic acid,
80–405 days; females treated with palmitic acid, 52–294 days; and males treated with soybean, 20–311 days. Since
(in all but one case in each group) the ratios were above the background fluctuation throughout the experimental
period, the reason for the difference seemed to be due to the higher variability among individuals in the half-life
of OBT, instead of errors derived from experimental detection limits. Longer half-lives, of several hundred days,
have been reported in studies on urine from clock dial painters exposed to tritiated luminous compounds36.
Taylor, in 2003, proposed a dosimetry model involving a third component with a half-life of 350 days37. The
ICRP also adopted a second OBT compartment, with a longer half-life of 365 days, in its model for w orkers4. This
work first provided the half-lives of the second component, estimated for OBT in major nutritional molecules
and foods, including half-lives of several hundred days in some volunteers. These results suggest the necessity
for a long half-life compartment in dosimetry models for OBT.
Estimation of committed effective doses for palmitic acid and soybean. The committed effective
doses from 1 Bq of tritium were estimated by the OBD models of males and females in the palmitic acid group
and males in the soybean group. The values varied from 4.2 × 10⁻¹¹ to 3.5 × 10⁻¹⁰ Sv Bq−1, 3.2 × 10⁻¹¹–2.9 × 10–
10
Sv Bq−1 and 1.9 × 10⁻¹¹–1.8 × 10⁻¹⁰ Sv Bq−1, among respective groups. The recovery ratios of Rr (d1 + d2) in the
palmitic acid and soybean groups were 0.81 ± 0.16 and 0.90 ± 0.10, respectively. Since the committed effective
doses from the unrecovered fraction were not included in the estimates, the true values would be higher. The
values for palmitic acid and soybean were higher than the dose coefficient used by the ICRP, for members of
the public (4.2 × 10⁻¹¹ Sv Bq−1). In rats, cumulative residual amounts of OBT, after the administration of tritiated
fatty acids, were higher than those from glucose w ere17, and that from soybean was higher than that from rice
and wheat, which mainly consisted of c arbohydrate15. In humans, the estimated committed effective dose from
1 Bq of 14C in fatty acids was greater than that from glucose31. This work provides the first estimates of the com-
mitted effective dose from OBT in major nutritional molecules and food. They were, however, considered com-
pound and ingredient specific. In our study, since the committed effective doses for glucose and alanine were
Scientific Reports | (2021) 11:2816 | https://doi.org/10.1038/s41598-021-82460-5 10
Vol:.(1234567890)www.nature.com/scientificreports/
Body weight
Age (years) (kg)
Volunteer group Administration Sex Mean S.D Mean S.D N
M 22.3 2.5 83.7 14.4 3
D 2O D2O
F 21.5 3.2 52.0 6.1 6
M 21.4 0.5 66.1 6.3 5
Glucose D-labelled glucose
F 23.4 3.1 53.8 4.7 6
M 20.7 1.2 62.6 4.8 3
Alanine D-labelled alanine
F 21.3 1.2 53.0 4.0 3
M 20.8 0.5 63.6 13.2 5
Palmitic acid D-labelled palmitic acid
F 20.3 0.5 47.1 5.1 4
M 20.8 0.4 62.6 4.7 5
Soybean D-labelled soybean
F 21.5 0.7 52.7 0.3 2
Table 6. Volunteer groups. M, male. F, female. S.D., standard deviation.
not obtained, due to the lack of reliable d2 and k1 in the OBD models, we could not find the effective dose for a
reference diet by the weighted mean of each nutrient molecule. Therefore, further study is necessary to validate
the recommended dose coefficient of the ICRP, by obtaining comprehensive data regarding the metabolism of
OBT for various nutrient molecules and foods, such as proteins, carbohydrates, and grains.
Conclusions
For reference diets in Japan and the United States, the estimated distribution ratios of ingested OBT to be
immediately metabolised to FWT were slightly greater than the value assumed in the ICRP OBT model, which
has been adopted for the calculation of dose coefficient. These results suggest that the assumed value, used in
the ICRP model, was cautious from the viewpoint of radiation safety. However, the half-life of the OBT com-
partment, in each volunteer administered palmitic acid and soybean, varied from dozens to several hundred
days. These results provide the estimated half-lives of OBT for major nutritional molecules and food. For dose
estimation, the need to consider long half-lives of over 100 days was suggested. Consequently, the committed
effective doses for 1 Bq of tritiated palmitic acid and soybean were greater than the dose coefficient value used
for members of the public, recommended by the ICRP (4.2 × 10⁻¹¹ Sv Bq−1). These results suggest that OBT, for
some ingredients, might give higher doses than the current dose coefficient suggests. However, we were unable
to obtain the dose for the reference diets. Therefore, to validate the dose coefficient by the ICRP, further stud-
ies are necessary to estimate the committed effective doses from other major nutrient molecules and foods. In
addition to that, further studies on various age groups are deemed necessary, because our findings are based on
data from volunteers aging from 20 to 28.
Methods
Ethical considerations. All experimental protocols in the current study conform to the ethical guidelines
of the 1975 Declaration of H elsinki38 and were approved by the Review Board for Human Subject Experiments
established by the Institute for Environmental Sciences, Aomori, Japan. Written informed consent was obtained
from each volunteer prior to participation.
Procedures for the administration of labelled materials. D2O, and D-labelled glucose, alanine, pal-
mitic acid, and soybean were administered orally to healthy adult Japanese male and female volunteers. The total
number of volunteers was 42, although some dropped out of the experiment, for various reasons. The data from
these volunteers were eliminated. This study lasted 4 years; administration experiments were conducted from
September to January, and each volunteer participated in one of the 4 years. The numbers of volunteers in each
group, their ages, and body weights are shown in Table 6.
D2O and D-labelled glucose solutions were administered once orally, at 12:15, immediately before eating
lunch on experimental day 0. D-labelled alanine and palmitic acid were mixed with food and administered once
daily for four successive days, at 12:15. The administration period for D-labelled soybean lasted 12 days, with
two series of 5 consecutive days of administration, in the same manner, with an interval of 2 days. For each vol-
unteer administered D-labelled compounds, the same compound labelled with 13C was given simultaneously in
each administration, apart from three male and three female volunteers who were not administered 13C-labelled
glucose alongside their D-labelled glucose.
Preparation of labelled compounds and soybean. All D-labelled and 13C-labelled compounds were
purchased from Cambridge Isotopes, Inc. (Tewksbury). In each D-labelled molecule, hydrogen bound to carbon
was uniformly replaced by D. Such D is not exchangeable to hydrogen in free body water after administration
until it is metabolised to HDO, and is called non-exchangeable OBD (Nx-OBD). Exchangeable hydrogen, which
was not bound to carbon, such as hydroxyl group hydrogen, was not replaced by D. In each 13C-labelled com-
pound, 13C was uniformly labelled.
Scientific Reports | (2021) 11:2816 | https://doi.org/10.1038/s41598-021-82460-5 11
Vol.:(0123456789)www.nature.com/scientificreports/
Harvested crop weight H content D/H ratio D content
Harvest number gDW gH/100 gDW % gOBD/100 gDW
1 189.0 7.2 ± 0.2 12.0 ± 0.5 1.7 ± 0.1
2 222.8 7.1 ± 0.7 10.1 ± 0.8 1.4 ± 0.2
3 313.3 7.4 ± 0.2 9.8 ± 0.5 1.5 ± 0.1
Table 7. Characterization of D-labelled soybean. H, hydrogen. D, deuterium. DW, dry weight. OBD,
organically bound deuterium. Values are presented as mean ± standard deviation.
D-labelled compound or food 13
C-labelled compound
Volunteer group Administration g person−1 gNx-OBD person−1 Administration g person−1 g13C person−1
D2O D2O 5.5 1.1 – – –
13
Glucose D-labelled glucose 7.0 0.51 C-labelled glucose 3.0 1.2
13
Alanine D-labelled alanine 4.0 0.34 C-labelled alanine 0.40 0.17
13
C-labelled palmitic
Palmitic acid D-labelled palmitic acid 4.0 0.85 0.40 0.30
acid
D-labelled soybean
90 1.6 – – –
harvest 1
D-labelled soybean
Soybean 110 1.6 – – –
harvest 2
D-labelled soybean
85 1.2 – – –
harvest 3
Table 8. Amounts of administered materials. Nx-OBD non-exchangeable organically bound deuterium.
D-labelled soybean was obtained by hydroponic culture with 20% D/H water. The D-labelled soybean was
harvested three times. The harvested soybeans were boiled, freeze-dried, and then homogenised. The soy powder
product was orally administered. To measure the D/H ratio, the soy powder was first immersed in drinking water,
to replace exchangeable OBD (Ex-OBD), which was not bound to carbon. After the second freeze-drying process,
the D/H ratio was measured using a mass spectrometer (Iso Prime 100; Elementar, Langenselbold, Germany).
Buried tritium is defined as the tritium in a large biomolecule that remains in the molecule after rinsing samples
with tritium-free water, despite its exchangeable position in the molecule39. A fraction of buried deuterium was
considered to remain in soybean powder. However, the ratio of buried tritium has been estimated as less than
5% compared to the non-exchangeable OBT present in washed plant s amples40. Therefore, we considered that
effect of the amount of buried deuterium on the measured D/H ratio of soy powder was negligible. The hydrogen
content of the soybean powders (gH/gDW) was measured using a gas chromatograph (NCH-22F; Sumika Chemi-
cal Analysis Service, Oosaka, Japan). The OBD content of the soybean powders (gOBD/gDW) were calculated
from their D/H ratio and hydrogen content, and are summarised in Table 7.
Dosage of D and 13C. Dosages of D and 13C in labelled compounds and foods are summarised in Table 8.
The doses of D for the volunteer groups administered HDO and D-labelled glucose were 1.1 and 0.51 g per
person, respectively. The total dosage of D for the groups of D-labelled alanine and palmitic acid were 0.34 and
0.85 g per person, respectively, over four successive days of administration. The D-labelled soybean administra-
tion experiments were conducted three times, corresponding to three harvests, and the resulting dosages of D in
these experiments were 1.6 (n = 2), 1.6 (n = 3), and 1.2 (n = 3) g per person, over four days.
Sample collection and determination of D/H and 13C/12C ratio. Urine and breath samples were
periodically collected from days − 7 to 119, where the first day of the administration was defined as day 0. Urine
samples were collected daily, when the volunteers rose in the morning, until day 28, then every two or three days
until day 119. Additional samples were collected frequently, after administration. Urine samples were collected
at every urination until bedtime, on days of administration. Breath samples were collected immediately prior to
the administration, every 20 min from 12:30 to 17:10, and then hourly from 18:00 until bedtime.
Urine was distilled, and the condensed water was collected for the measurement of D/H ratio, using a mass
spectrometer (Iso Prime 100; Elementar, Langenselbold, Germany). Breath samples were collected using an
airtight bag. The samples were analysed within 3 days. After purifying the C O2 in the breath using a gas chro-
matograph (MAT GC; Thermo Electron, Waltham, MA, USA), the 13C/12C ratio was measured using a mass
spectrometer (Dalta V Advantage; Thermo Electron, Waltham, MA, USA).
The increments were calculated of D/H and 13C/12C ratios above the background values measured for the
samples before administration. The ratios were normalised to the same dosage (1 g D or 13C per 70 kg body
weight). When the D/H or 13C/12C ratios were below the limits (90% upper confidence limits of the background
fluctuation), to cut off the data and any subsequent data were discarded.
Scientific Reports | (2021) 11:2816 | https://doi.org/10.1038/s41598-021-82460-5 12
Vol:.(1234567890)www.nature.com/scientificreports/
Representative molecule Corresponding nutrition d1* Experiment**
Glucose Carbohydrate 0.81 ± 0.23 D-labelled glucose
Alanine Alanine 0.90 ± 0.13 D-labelled alanine
13
Glycine Glycine 0.29 ± 0.04 C-labelled glycine31
13
Leucine Branched chain amino acids 0.33 ± 0.03 C-labelled leucine31
13
Phenylalanine Aromatic amino acids 0.25 ± 0.04 C-labelled phenylalanine31
13
Glutamic acid Other amino acids 0.61 ± 0.06 C-labelled glutamic acid31
Palmitic acid Saturated fatty acids 0.41 ± 0.09 D-labelled palmitic acid
13
Oleic acid Mono-unsaturated fatty acids 0.35 ± 0.11 C-labelled oleic acid31
13
Linoleic acid Poly-unsaturated fatty acids and others 0.29 ± 0.12 C-labelled linoleic acid31
Table 9. Representative molecules for each nutrient. *Ratio of organic compounds to inorganic compounds
immediately after administration. **Isotope administration experiments to determine the value of d1. Values of
d1 are mean ± standard deviation.
Development of the models. A metabolic model was developed, for each volunteer. For volunteers in
the glucose, alanine, palmitic acid, and soybean groups, the model structure of the OBD shown in Fig. 1 was
adopted, while for volunteers in the D2O group, the model structure for HDO was adopted. For each model,
parameters were determined using the least squares method, using Microsoft Excel version 2007. The detailed
procedures have been described previously31.
Data below the detection limit were discarded, and the second component was not clearly discernible in 3
of 42 volunteers, e.g., the data from the female subject in the palmitic acid group are shown in Fig. 3, in red. In
this case, k1 was not determined and other parameters were determined under the condition that k1 was fixed at
0.0017 d−1. The value was derived from the mean residence time of carbon (1.6 years) in adipose tissue, having
one of the slowest metabolic rates among human o rgans41. The value was considered the same as that of OBD
in adipose tissue.
Estimations of the parameter values for food and reference diet by the values for various
compounds. The d1 for soybeans was estimated by the weighted mean of the ratios obtained from admin-
istration experiments with D-labelled compounds, or with D-and 13C-labelled compounds, corresponding to
their known nutritional composition in boiled soybean42, assuming the nutritional balance of boiled soybean
remained the same before and after the immersion process. The combinations of the examined molecules, which
were the representative molecules and their assumed corresponding nutrition, are shown in Table 9. DNA pre-
cursors were not taken into consideration. To validate the distribution ratio (50%) to the HTO compartment, in
the ICRP model, ratios for reference diets were calculated in the same manner as nutritional surveys conducted
in Japan43 and the United States35, as examples of relatively high carbohydrate and high fat diets, respectively. The
composition of amino acids in protein in the reference diet was adopted from Iwaya [44].
Calculation of dose coefficient. The 50-year cumulative burden of tritium, after ingestion, was estimated
for each volunteer, using the OBD model developed in this study, under the assumption that tritium has the
same metabolic behaviour as deuterium. The committed effective dose from ingested OBT for each volunteer
was calculated from the 50-year cumulative burden, according to the procedure published by the ICRP, using a
ody5.
tissue-weighting factor of unity, under the assumption of uniform distribution of tritium throughout the b
Although the ratio of recovery to administration was not unity in some volunteers, the unrecovered fraction was
not considered in the estimation of cumulative burden. Therefore, the estimated committed effective dose would
increase when the unrecovered fraction is included.
Data availability
The datasets generated and analysed during the current study are available from the corresponding author, on
reasonable request.
Received: 6 October 2020; Accepted: 20 January 2021
References
1. United Nations Scientific Committee on the Effects of Atomic Radiation (UNSCEAR). Effects of Ionizing Radiation. Volume I:
Report to the General Assembly, Scientific Annexes A and B. UNSCEAR 2006 Report. https://www.unscear.org/unscear/en/publi
cations/2006_1.html (accessed on 1st December 2020).
2. Diabaté, S. & Strack, S. Organically bound tritium. Health Phys. 65, 698–712 (1993).
3. Kim, S. B., Baglan, N. & Davis, P. A. Current understanding of organically bound tritium (OBT) in the environment. J Environ.
Radioact. 126, 83–91 (2013).
4. International Commission on Radiological Protection (ICRP). Occupational intakes of radionuclides—Part 1. ICRP Publication
134 (2016).
5. International Commission on Radiological Protection (ICRP). Age dependent doses to members of the public from intake of
radionuclides—Part1. ICRP Publication 56 (1990).
6. Butler, H. & Leroy, J. H. Observation of biological half-life of tritium. Health Phys. 11, 283–285 (1965).
Scientific Reports | (2021) 11:2816 | https://doi.org/10.1038/s41598-021-82460-5 13
Vol.:(0123456789)www.nature.com/scientificreports/
7. Foy, J. M. & Schnieden, H. Estimation of total body water (virtual tritium space) in the rat, cat, rabbit, guinea-pig, and man, and
of the biological half-life of tritium in man. J. Physiol. 154, 169–176 (1960).
8. Wylie, K. F., Bigler, W. A. & Grove, G. R. Biological half-life of tritium. Health Phys. 9, 911–914 (1963).
9. Eakins, J. D., Hutchinson, W. P. & Lally, A. E. The radiological hazard from tritium sorbed on metal surfaces. Health Phys. 28,
213–224 (1975).
10. Richmond, C. R., Langham, W. H. & Trujillo, T. T. Comparative metabolism of tritiated water by mammals. J. Cell. Comp. Physiol.
59, 45–53 (1962).
11. Osborn, R. V. Absorption of tritiated water vapour by people. Health Phys. 12, 1527–1537 (1966).
12. Pinson, E. A. & Langham, W. H. Physiology and toxicology of tritium in man. J. Appl. Physiol. 10, 108–126 (1957).
13. Hill, R. L. & Johnson, J. R. Metabolism and dosimetry of tritium. Health Phys. 65, 628–647 (1993).
14. Takeda, H. et al. Comparative biokinetics of tritium in rats during continuous ingestion of tritiated water and tritium-labelled
food. Int. J. Radiat. Biol. 77, 375–381 (2001).
15. Takeda, H. & Iwakura, T. Incorporation and distribution of tritium in rats exposed to tritiated rice and tritiated soybean. J. Radiat.
Res. 33, 309–318 (1992).
16. Priest, N. D. et al. Tritium (3H) retention in mice: administration as HTO, DTO or as 3H-labelled amino acids. Health Phys. 112,
439–444 (2017).
17. Takeda, H. Metabolic and dosimetric study to estimate an annual limit on intake for organic tritium. Fusion Sci. Technol. 28,
964–969 (1995).
18. Takeda, H. Comparative Metabolism of tritium in rat after single ingestion of some tritiated organic compounds versus tritiated
water. J. Radiat. Res. 23, 345–357 (1982).
19. Balonov, M. I., Muksinova, K. N. & Mushkacheva, G. S. Tritium radiobiological effects in mammals: review of experiments of the
last decade in Russia. Health Phys. 65, 713–726 (1993).
20. Hunt, J., Baily, T. & Reese, A. The human body retention time of environmental organically bound tritium. J. Radiol. Prot. 29,
23–36 (2009).
21. International Commission on Radiological Protection (ICRP). Report on the task group on reference man. ICRP Publication 23
(1975).
22. Rodgers, D. W. Tritium dynamics in mice exposed to tritiated water and diet. Health Phys. 63, 331–337 (1992).
23. Pietrzak-Flis, Z., Radwan, I. & Indeka, L. Tritium in rabbits after ingestion of freeze-dried tritiated food and tritiated water. Radiat.
Res. 76, 420–428 (1978).
24. Rochalska, M. & Szot, Z. The incorporation of organically-bound tritium of food into some organs of the rat. Int. J. Radiat. Biol.
Relat. Stud. Phys. Chem. Med. 31, 391–395 (1977).
25. Martin, J. R. & Koranda, J. J. Biological half-life studies of tritium in chronically exposed kangaroo rats. Radiat. Res. 50, 426–440
(1972).
26. Galeriu, D., Beresford, N. A., Takeda, H., Melintescu, A. & Crout, N. M. J. Toward a model for the dynamic transfer of tritium and
carbon in mammals. Radiat. Prot. Dosim. 105, 387–390 (2003).
27. Richardson, R. B. & Dunford, D. W. Review of the tritium and C-14 internal dosimetry models and their implementation in the
Genmod-PC code. Health Phys. 81, 289–301 (2001).
28. Winchell, H. S. et al. Kinetics of CO2-HCO3− in normal adult males. J. Nucl. Med. 11, 711–715 (1970).
29. Balonov, M. I., Dolgiev, E. I. & Likhtarev, I. A. Exchange kinetics and dosimetry of tritium oxide in man for different routes of
administration. Health Phys. 27, 367–375 (1974).
30. Trivedi, A., Galeriu, D. & Richardson, R. B. Dose contribution from metabolized organically bound tritium after acute tritiated
water intakes in humans. Health Phys. 73, 579–586 (1997).
31. Masuda, T. et al. Estimation of dietary 14C dose coefficient using 13C-labelled compound administration analysis. Sci. Rep. 10, 8156
(2020).
32. Ito, H. et al. Relation between body composition and age in healthy Japanese subjects. Eur. J. Clin. Nutr. 55, 462–470 (2001).
33. Melintescu, A., Galeriu, D. & Takeda, H. Reassessment of tritium dose coefficients for the general public. Radiat. Prot. Dosim. 127,
153–157 (2007).
34. Ministry of Health, Labour and Welfare, Japan. The National Health and Nutrition Survey, Japan (in Japanese). https://www.mhlw.
go.jp/bunya/kenkou/kenkou_eiyou_chousa.html (accessed 8 September 2020).
35. U.S. Department of Agriculture. The United States. Nutrient Intakes from Food and Beverages. https://www.ars.usda.gov/north
east-area/beltsville-md-bhnrc/beltsville-human-nutrition-research-center/food-surveys-research-group/docs/wweia-data-table
s/ (accessed 8 September 2020).
36. United Nations Scientific Committee on the Effects of Atomic Radiation (UNSCEAR). Source, effects and risks of ionizing radia-
tion. UNSCEAR 2016 Report. https://www.unscear.org/unscear/en/publications/2017.html (accessed 1 December 2020).
37. Taylor, D. M. Biokinetic models for the behaviour of carbon-14 from labelled compounds in the human body: can a single generic
model be justified?. Radiat. Prot. Dosim. 108, 187–202 (2004).
38. World Medical Association (WMA). WMA Declaration of Helsinki – Ethical Principles for Medical Research Involving Human Sub-
jects. https://www.wma.net/policies-post/wma-declaration-of-helsinki-ethical-principles-for-medical-research-involving-human
-subjects/ (accessed 20 November 2020).
39. International Atomic Energy Agency (IAEA). EMRAS, Tritiium and C-14 Working Group Meeting Report 9. http://www-ns.iaea.
org/downloads/rw/projects/emras/tritium/minutes-ninth-meeting.pdf (accessed 20 November 2020).
40. Kim, S. B., Workman, W. J. G. & Davis, P. A. Experimental investigation of buried tritium in plant and animal tissues. Fusion Sci.
Technol. 54, 257–260 (2008).
41. Arner, P. et al. Dynamics of human adipose lipid turnover in health and metabolic disease. Nature 478, 110–113 (2011).
42. Ministry of Education Culture, Sports, Science and Technology, Japan. Standard Tables of Food Composition in Japan-2015—
(Seventh revised edition) https://www.mext.go.jp/en/policy/science_technology/policy/title01/detail01/sdetail01/sdetail01/13851
22.htm (accessed 9 September 2020).
43. Iwaya, M. Amino acid composition of dietary protein ingested by the Japanese and its nutritional evaluation. Jpn. J. Nutr. Diet. 42,
297–304 (1984).
Acknowledgements
We wish to express our sincere gratitude to the volunteers for their willing and extended co-operation. The
authors are grateful to Kensaku Matsushita for technical assistance. This study was performed under a contract
with the government of Aomori Prefecture, Japan, and partially supported by a grant-in-aid from the Fugaku
Trust for Medicinal Research (to T.M.).
Author contributions
TM conceived the idea and designed the study; TM and TY acquired the data; TM analysed the data; TM wrote
the manuscript; All authors critically reviewed the data and the manuscript.
Scientific Reports | (2021) 11:2816 | https://doi.org/10.1038/s41598-021-82460-5 14
Vol:.(1234567890)You can also read