Evaluating the impact of new aircraft separation minima on available airspace capacity and arrival time delay
←
→
Page content transcription
If your browser does not render page correctly, please read the page content below
THE AERONAUTICAL JOURNAL                APRIL 2020 VOLUME 124 NO 1274                                         447

                 pp 447–471.   c The Author(s) 2020 . This is an Open Access article, distributed under the terms of the Creative
                 Commons Attribution licence (http://creativecommons.org/licenses/by/4.0/), which permits unrestricted re-use,
                 distribution, and reproduction in any medium, provided the original work is properly cited.
                 doi:10.1017/aer.2019.160

                 Evaluating the impact of new
                 aircraft separation minima on
                 available airspace capacity and
                 arrival time delay
                 E. Itoh
                 eri@mpat.go.jp
                 Air Traffic Management Department
                 National Institute of Maritime, Port and Aviation Technology
                 Electronic Navigation Research Institute
                 Tokyo
                 Japan

                 M. Mitici
                 Faculty of Aerospace Engineering
                 Delft University of Technology
                 Delft
                 The Netherlands

                 ABSTRACT
                 Although the application of new, reduced aircraft separation minima can directly increase
                 runway throughput, the impact thereof on the traffic flow of aircraft arriving at the destination
                 airport has not been discussed yet. This paper proposes a data-driven and queue-based mod-
                 eling approach and presents an analysis of the impact on the delay time of arriving aircraft in
                 the airspace within a radius of 100 nautical miles around an airport. The parameters of our
                 queuing model were estimated by analysing the data contained in the radar tracks and flight
                 plans for flights that arrived at Tokyo International Airport during the 2 years of 2016 and
                 2017. The results clarified the best arrival strategy according to the distance from the arrival
                 airport: The combination of airspace capacity control and reduction of the flight time and
                 separation variance is the most powerful solution to mitigate delays experienced by arriving
                 traffic while also allowing an increase in the amount of arrival traffic. The application of new
                 wake vortex categories would enable us to increase the arrival traffic to 120%. In addition, the
                 arrival delay time could be minimised by implementing the proposed arrival traffic strategies
                 together with automation support for air traffic controllers.

                                   Received 19 August 2019; revised 2 December 2019; accepted 3 December 2019.
Downloaded from https://www.cambridge.org/core. 05 Feb 2022 at 15:56:10, subject to the Cambridge Core terms of use.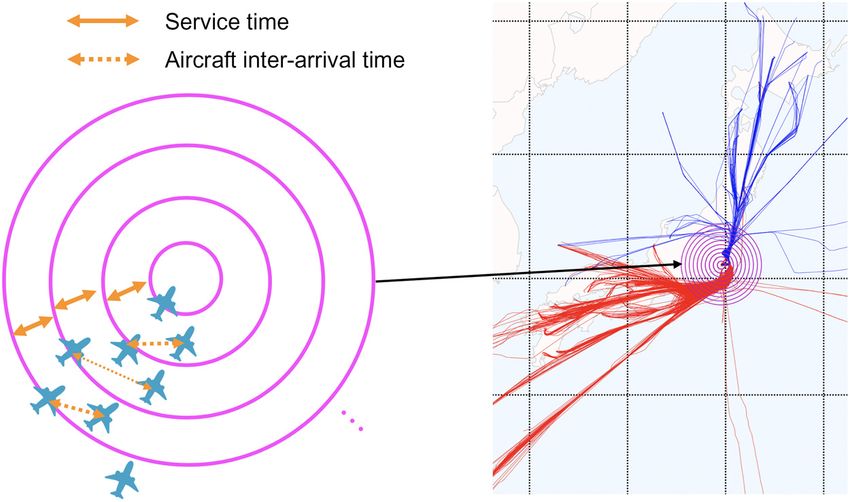
448                                    THE AERONAUTICAL JOURNAL                                          APRIL 2020

              Keywords: queuing theory; data analysis; data-driven air transport; arrival management;
              wake vortex categories

              NOMENCLATURE
              AMAN               arrival management
              ATM                air traffic management
              CAi                coefficient of variation of aircraft inter-arrival times in airspace area i
              CBi                coefficient of variation of aircraft service times in airspace area i
              ci                 number of servers in airspace area i
              Di                 delay an aircraft experiences in airspace area i
              E-AMAN             extended arrival management
              FCFS               first come first served
              GIM-S              ground-based interval management spacing
              IAT                inter-aircraft time
              i                  number of airspace area
              ICAO               international civil aviation organization
              IM                 interval management
              LRATFM             long range air traffic flow management
              MTOM               maximum take-off mass
              NM                 nautical mile
              RECAT              wake turbulence re-categorization
              STD                standard deviation
              TBFM               time-based flow management
              TMA                traffic management advisory
              TRACON             terminal radar approach control
              TSAS               terminal sequencing and spacing
              tIAT               IAT in seconds
              WS                 wind span

              Greek Symbol
              E[Ai ]             mean of aircraft inter-arrival times in seconds
              E[Bi ]             mean of aircraft service times in seconds
                  G/G/c
              E[Di      ]        expected total airborne delay of a G/G/c queuing model in airspace area i in
                                 seconds
                    M/M/c
              E[Di          ]    expected total airborne delay of a M/M/c queuing model in airspace area i in
                                 seconds
              E[tmin ]           mean of the minimum time separation in seconds
              λi                 arrival rate (number of arrival aircraft per hour) at airspace area i
              λRW 22             arrival rate (number of arrival aircraft per hour) at Runway 22
              μi                 service ratio at airspace area i

Downloaded from https://www.cambridge.org/core. 05 Feb 2022 at 15:56:10, subject to the Cambridge Core terms of use.
ITOH AND MITICI               EVALUATING THE IMPACT OF NEW AIRCRAFT SEPARATION MINIMA...              449

                 ρi                 parameter to estimate queue-stability at airspace area i
                 σAi                variance of aircraft inter-arrival times in seconds
                 σBi                variance of aircraft service times in seconds

                 1.0 INTRODUCTION
                 Increasing the runway throughput is one of the most promising solutions to accommo-
                 date future air traffic growth. In this regard, the application of new wake vortex cate-
                 gories that lower the separation minima between arriving aircraft have been considered(1-3) .
                 Consequently, this affects aircraft arrival flows in that these separation minima lead to a reduc-
                 tion in the aircraft inter-arrival time, or, equivalently, they allow an increased aircraft arrival
                 rate at an airport. An analysis is required to clarify whether the use of these new separation
                 minima standards contributes to efficiently controlled arrival traffic, particularly for increased,
                 future air traffic volumes. Further, it would be of interest to analyse the impact of these new
                 minima separation standards on the airspace surrounding the destination airport, given the
                 available airspace capacity, while ensuring reasonable delays in arrival times. To clarify this,
                 we propose a new approach based on data-driven queuing models to analyse the impact of
                 new aircraft separation minima on the traffic flow of arrival aircraft. For our analysis, we con-
                 sider the airspace within a radius of 100 nautical miles (NM) from the destination airport. We
                 demonstrate the effectiveness of our models with a case study at Tokyo International Airport,
                 the fifth busiest airport in the world(4) .
                    The management of aircraft arrivals at airports is central to airport operations. In the United
                 States, the Traffic Management Advisory (TMA)(5) was deployed in air traffic control centers
                 in the 1990s. The enhanced version thereof, Time-Based Flow Management (TBFM)(6) and
                 Terminal Sequencing and Spacing (TSAS)(7) , considers future airborne-based operations(8) .
                 These systems contribute to sequencing and time spacing the arrival traffic consistently in
                 en-route and terminal airspace areas. In Europe, the on-going SESAR project has facilitated
                 collaboration among European countries and contributed to the development of ‘Enhanced’
                 Arrival Management (AMAN), which coordinates the arrival time-schedules covering wider
                 ranges of airspace than in the case of conventional operations(9) . In the Asia-Pacific region,
                 strategic air traffic flow management is achieved by using Long Range Air Traffic Flow
                 Management (LRATFM), which has been devised to provide a basis for research into appli-
                 cations beyond the time-frames of the current system(10) . On-going Japanese research and
                 development on an ‘Extended’ AMAN (E-AMAN) aims to ensure the efficiency of the traf-
                 fic flow arriving at Tokyo International Airport(11) . In the E-AMAN scheme, arrival traffic
                 flow control, which is designed to coordinate the traffic volume by considering the limited
                 airspace capacity and runway throughput, shifts to time-based operations close to the des-
                 tination airports, which ensures minimum time-spacing between arrivals. One of the most
                 important requirements E-AMAN is designed to comply with, is to schedule the arrival time
                 to accommodate an increasing arrival ratio, while reducing the arrival time delay.
                    Several studies have analysed the aircraft arrival process at airports by means of queu-
                 ing theory. For example, the aircraft arrival delay was analysed(12-15) by employing queuing
                 models focused especially on runway-related delay and capacity constraints. Bauerle et al(12)
                 determined the expected waiting time for aircraft arriving at a single runway using an
                 M/SM/1 queuing model. Simple bounds for the expected waiting time were determined
                 in comparison to M/G/1 and M/D/1 models. However, in their case study, the authors
                 did not make use of operational data or compare their results against actual data. Rue

Downloaded from https://www.cambridge.org/core. 05 Feb 2022 at 15:56:10, subject to the Cambridge Core terms of use.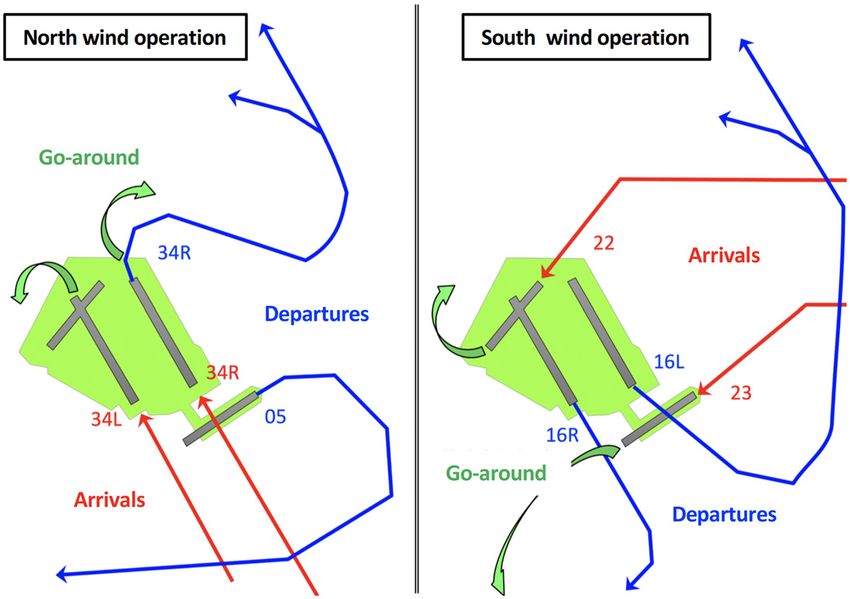
450                                    THE AERONAUTICAL JOURNAL                                          APRIL 2020

              and Rosenshine(14) modeled the arrival of aircraft at Pittsburgh International Airport as an
              M/M/1 and M/Ek /1 queue. The authors determined, using Semi-Markov decision pro-
              cesses, the maximum number of aircraft allowed to land at the airport during peak hours.
              Bolender and Slater(15) estimated the expected aircraft arrival delay by means of M/D/n
              queues, which yielded reasonable results when compared with numerical simulation data.
              Again, no comparative analysis with actual flight data was conducted. Long et al.(13) modeled
              the National Airspace System in the United States as a network of aircraft arriving, taxi-
              ing, and departing queues, with the TRACON sectors modeled as an M/E3 /n queue. The
              study provided a macroscopic view of the impact of ATM technologies and costs. Our previ-
              ous paper(16) presented an analysis of the arrival delay at an airport using a G/G/c queuing
              model. In this study, we considered extending the arrival airspace, while considering current
              minimum separation standards and airspace capacity. In another study(17) we evaluated dif-
              ferent tactical control strategies for arrivals at an airport using a M/G/c/K queuing model.
              In this paper, we present an evaluation of the impact of new separation minima standards on
              arrival delay. We model the traffic flow of aircraft arriving from within a radius of 100NM
              from the destination airport by means of a G/G/c queue, and provide a microscopic view of
              the analysis to clarify the optimal balance between increasing the arrival rate considering the
              airspace capacity, with the ultimate aim of minimising the delay in arrival time.
                 This remainder of the paper is organised as follows. Section 2 introduces air traffic opera-
              tions at Tokyo International Airport and characterises the arrival traffic data recorded in 2016
              and 2017. This data analysis supports the models that are subsequently presented. Section 3
              compares the potential increase in the runway throughput by applying new wake vortex cat-
              egories, RECAT-Dubai, EU, US 1.5, with a current standard. The expected future arrival
              ratio is estimated by combining these categories and safety margins depending on the lev-
              els of automation support that were introduced for air traffic controllers. Section 4 proposes a
              queue-based modeling approach in which the aircraft arrival process is formulated as a G/G/c
              queuing model. Based on the data-driven analysis, the probability distributions of the inter-
              arrival time and service time are estimated. The number of virtual service counters, which
              directly translates into capacities of the assigned airspace, is also estimated based on the traf-
              fic data. In Section 5, the G/G/c queuing model is applied to estimate the aircraft arrival
              delay time as a function of the distance from the destination airport by increasing the radius
              of the airspace centered at the arrival airport from 10 to 100NM in increments of 10NM. We
              analyse the positive impact of reducing the inter-arrival time within the arrival traffic flow
              on the airspace capacity. In this context, the aircraft delay time is estimated by means of the
              proposed queue-based approach. Section 6 discusses the impact of new aircraft separation
              minima on the traffic flow of aircraft arriving at the airport. Furthermore, the optimal arrival
              strategy, which meets the key requirements of the E-AMAN design, is suggested. This strat-
              egy mitigates the arrival delay time while increasing the arrival traffic ratio. Finally, Section 7
              provides the conclusions and outlines our plans for future work.

              2.0 CASE STUDY DATA DESCRIPTION – TOKYO
                  INTERNATIONAL AIRPORT
              2.1 Aircraft arrival operations
              In this section we describe the aircraft arrival operations at Tokyo International Airport. Tokyo
              International Airport is the fifth busiest airport in the world with respect to passenger traffic,

Downloaded from https://www.cambridge.org/core. 05 Feb 2022 at 15:56:10, subject to the Cambridge Core terms of use.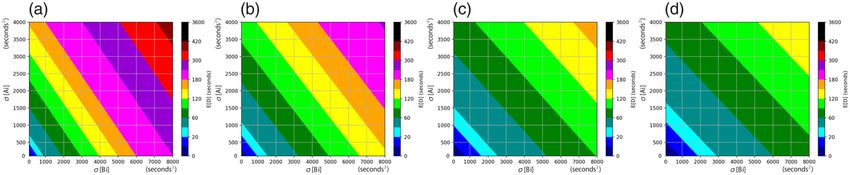
ITOH AND MITICI               EVALUATING THE IMPACT OF NEW AIRCRAFT SEPARATION MINIMA...              451

                                     Figure 1. Departure and arrival operations depending on wind direction.

                 processing a total of 83,189,933 passengers in 2017. An increase of 4.32% in the number of
                 passengers was registered in 2017 relative to 2016(4) . The maximum number of departures
                 and arrivals accommodated per year is 447,000, with a maximum of 80 operations per hour.
                 Over 60% of the domestic flights in Japan are concentrated at this airport. The airport makes
                 use of four runways on a daily basis, with the choice of runway configuration depending on
                 the wind direction (see Fig. 1). For operations at times of a northerly wind, runway 34L is used
                 for arrivals from the south-west direction, whereas runway 34R is used for arrivals from the
                 north. Runway 34R is also used for departure traffic. For operations when a southerly wind
                 prevails, runway 22 is used for arrivals from the south-west, and runway 23 for arrivals from
                 the north.
                    In this study we consider flight plans and track data for a period of 71 days, which are
                 randomly selected from the odd months of 2016 and 2017. In 2016, there were a total average
                 of 608 arrivals per day, of which 530 flights were domestic and 78 flights international. In
                 2017, eight additional international flights were accommodated every day compared to 2016.
                 Thus, in 2017, there were a total average of 614 arrivals per day, of which 530 flights were
                 domestic and 84 flights were international. The total number of arrivals between 8:00AM
                 and 11:00PM is slightly below the maximum allowed daily traffic threshold, and the most
                 congested period is between 5:00PM and 10:00PM.

                 2.2 Data-driven analysis of the aircraft arrival flows
                 One of the features of the arrival traffic flow at Tokyo International Airport is that the
                 arrivals are clustered either in the northern or the southwestern part of the airport. The period
                 8:00AM–11:00PM has a total of 569 arrivals, of which 422 flights arrive from the south-west,
                 and 147 flights arrive from the north. Figure 2 shows the flight track data for one day of oper-
                 ation in September 2017. The flight tracks of arrivals that use runway 22 are drawn in red,
                 whereas arrivals at runway 23 are drawn in blue.
                    Air traffic flow in Japan is strategically controlled with a central focus on arrivals at Tokyo
                 International Airport. Figure 3 shows the number of arrival flights crossing the concentric
                 circles with radii ranging from 10 to 100NM every 10NM centered at Tokyo International

Downloaded from https://www.cambridge.org/core. 05 Feb 2022 at 15:56:10, subject to the Cambridge Core terms of use.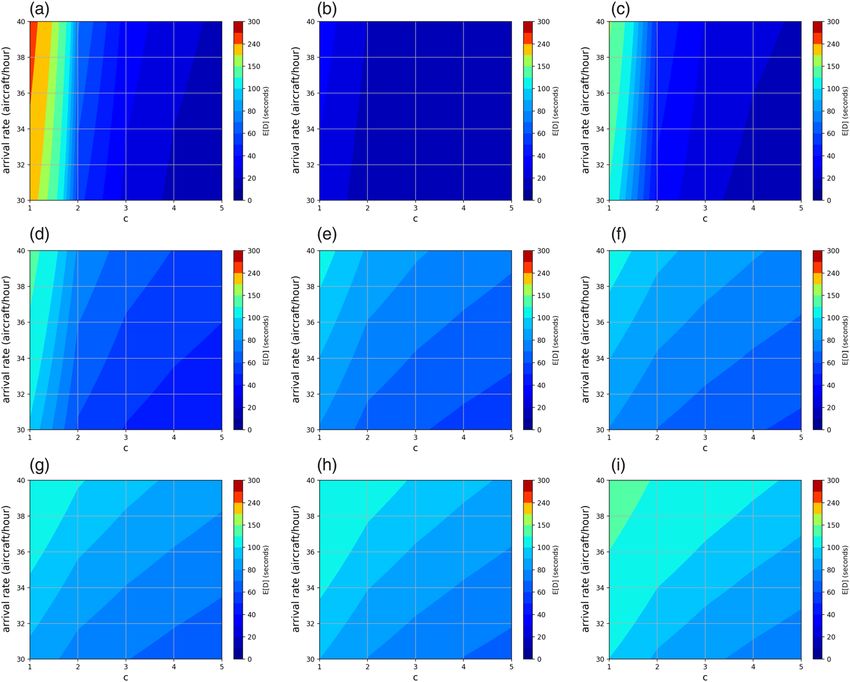
452                                    THE AERONAUTICAL JOURNAL                                          APRIL 2020

              Figure 2. Example of flight tracks during an entire day in September 2017. The red and blue tracks rep-
              resent the traffic flow from the south-west and the north, respectively. Concentric circles are drawn every
                  100NM for the airspace with a radius from 100 to 500NM centered at Tokyo International Airport.

              Airport per hour from 5:00PM to 10:00PM. The total number of flight arrivals is controlled
              within a maximum of 40 (30 arrivals from the south-west and 10 arrivals from the north).
              Figure 4 shows the distribution of departure airports for both domestic and international
              flights depending on the number of arrivals in a day. It is obvious that a larger number of
              domestic flights arrive from the south-west. Additionally, international arrivals from airports
              in other Asian countries also approach from the south-west. As global air traffic passenger
              demand is expected to increase by 250% in the next 20 years according to Asian economic
              growth forecasts(18) , a further increase in arrivals from the south-west is estimated to occur.
                 Table 1 shows the types of aircraft, expressed as a percentage, that arrive and depart. The
              majority of the aircraft are used for short and medium-distance passenger transportation using
              A737-800 (B738), A320, and B767-300 (B763). The second category includes long-distance
              passenger aircraft such as B777-200 (B772) and B787-8 (B788). Finally, less than 1% of the
              flights are business jets including Gulfstream and Bombardier products.

              3.0 CURRENT AND NEW AIRCRAFT SEPARATION
                  MINIMA
              3.1 Wake vortex categories
              The minimum aircraft inter-arrival time is decided based on wake vortex categories, which
              define aircraft separation minima between the preceding and succeeding aircraft according to
              their aircraft type. Table 2 compares the aircraft types by categorising them according to the
              maximum take-off mass (MTOM) and length of wind span (WS) of the aircraft based on four
              different standards: ‘Current ICAO’ is the current international standard, ‘RECAT-Dubai’ is
              the new standard implemented at Dubai International Airport(3) , ‘RECAT-US 1.5’ is the new

Downloaded from https://www.cambridge.org/core. 05 Feb 2022 at 15:56:10, subject to the Cambridge Core terms of use.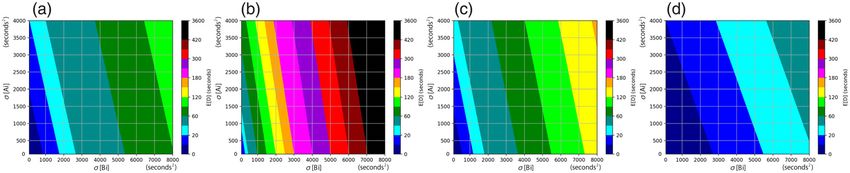
ITOH AND MITICI

                                                                                                                                                                         Table 1
                                                                                                                                            Aircraft types as a percentage of the total number of aircraft arrivals

                                                                                                                       Types B738 B763 B772 A320 B788 B773 B77W B789 A321 B737 A333 E170 A332 B744 B734 Others
                                                                                                                       (%)   34   18   14       10     6      3       3      2      2      2      2      1     0.6    0.5   0.4   0.8

Downloaded from https://www.cambridge.org/core. 05 Feb 2022 at 15:56:10, subject to the Cambridge Core terms of use.
                                                                                                                                                                                                                                        EVALUATING THE IMPACT OF NEW AIRCRAFT SEPARATION MINIMA...
                                                                                                                                                                                                                                        453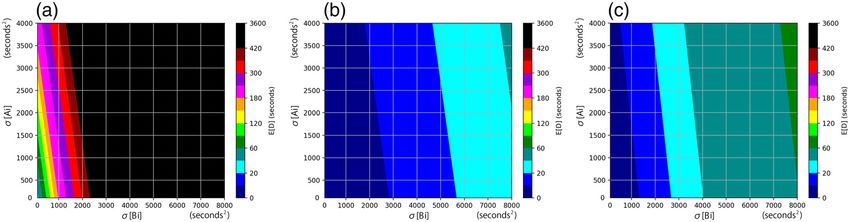
454                                    THE AERONAUTICAL JOURNAL                                          APRIL 2020

              Figure 3. Number of aircraft arriving per hour during the hours 5:00PM–10:00PM in 2016 and 2017.
                                  (a) Traffic flow from the north. (b) Traffic flow from the south.

              US standard(2) , and ‘RECAT-EU’ is the new EU standard(1) . In these standards(1-3) , the mini-
              mum distance separation is decided using combinations of preceding and succeeding aircraft
              types. Specifically, ‘RECAT-Dubai’ employs the combination of low separation minima in
              ‘RECAT-US1.5’ and ‘RECAT-EU,’ and is proposed as the new ICAO standard. Thus, the air-
              craft types arriving at a destination airport (see Table 1) determine the runway throughput
              following these separation standards.

              3.2 Distance separation minima under RECAT-Dubai
              Table 3 summarises the distance-based wake turbulence separation minima based on the
              RECAT-Dubai standards(3) . The radar separation minimum (3NM in Japan) is applied for
              category sets not included in the table. Figure 5 shows the frequency of a specific type of

Downloaded from https://www.cambridge.org/core. 05 Feb 2022 at 15:56:10, subject to the Cambridge Core terms of use.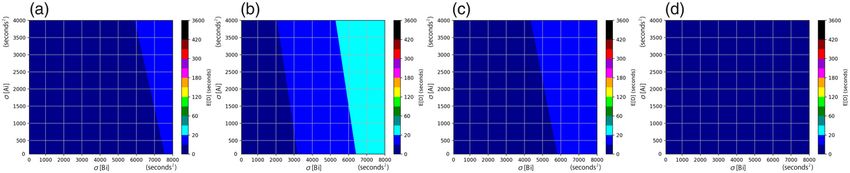
Table 2
Wake vortex categories depending on maximum certified take-off mass (MTOM) and wing span (WS)
Current ICAO standard RECAT-Dubai RECAT-US 1.5 RECAT-EU
SUPER (J) A A A
ITOH AND MITICI
A380 136,000kg ≤ MTOM 136,000kg ≤ MTOM 100,000kg ≤ MTOM
74.68m < WS 74.68m < WS 72m < WS
HEAVY (H) B B B
136,000kg ≤ MTOM 136,000kg ≤ MTOM 136,000kg ≤ MTOM 100,000kg ≤ MTOM
53.34m < WS ≤ 74.68m 53.34m < WS ≤ 74.68m 60m < WS ≤ 72m
C C C
136,000kg ≤ MTOM 136,000kg ≤ MTOM 100,000kg ≤ MTOM
38.10m < WS ≤ 53.34m 38.10m < WS ≤ 53.34m WS < 52.0m
MEDIUM (M) D D D
7,000kg < MTOM < 136,000kg 18,600kg < MTOM < 136.000kg MTOM < 136,000kg 15,000kg < MTOM < 100,000kg
32m < WS 38.1m < 53.34m 32m < WS
E or E
18,600kg < MTOM ≤ 136,000kg 18,600kg < MTOM 15,000kg < MTOM ≤ 100.000kg
27.43m < WS ≤ 32.0m 27.43m < WS ≤ 38.1m 32.0m < WS
F E
18,600kg < MTOM < 136.000kg 18,600kg < MTOM
WS ≤ 27.43m 19.81m < WS ≤ 27.43m
Downloaded from https://www.cambridge.org/core. 05 Feb 2022 at 15:56:10, subject to the Cambridge Core terms of use.
LIGHT (L) G F F
MTOM ≤ 7,000kg MTOM ≤ 18,600kg MTOM ≤ 18,600kg MTOM ≤ 15,000kg
WS ≤ 38.1m
EVALUATING THE IMPACT OF NEW AIRCRAFT SEPARATION MINIMA...
or
MTOM < 7,000kg
455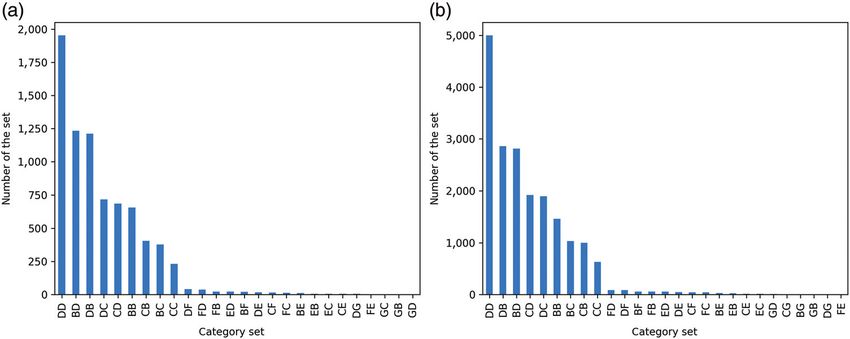
456                                    THE AERONAUTICAL JOURNAL                                          APRIL 2020

              Figure 4. Distributions of departure airports depending on the numbers of arrivals in a day. (a) Departure
                               airports of domestic flights. (b) Departure airports of international flights.

              preceding-succeeding aircraft set when the RECAT-Dubai standard is applied to current traf-
              fic flow arriving at Runways 22 and 34L between 8:00AM and 10:00PM. Arrival sequencing
              is determined by the radar data. The majority of aircraft (see Table 1) arriving at Tokyo
              International Airport are of types D, B, and C with a ratio of approximately 5:3:2. When
              arrival sequencing is optimised by means of, for instance position shifting, one or two addi-
              tional aircraft arrivals per hour are accommodated, relative to the current first come first served
              (FCFS) sequencing. However, these position-shifting operations are not necessarily equitable
              from the airlines’ point of view. Furthermore, it is not clear how such optimisation opera-
              tions can be achieved without increasing the workload of air traffic controllers and/or without
              any automation support for the air traffic controllers. Equally important, these optimisation
              operations may also propagate traffic congestion to succeeding and/or surrounding aircraft
              traffic. For these reasons, the optimisation of arrival sequencing was not addressed in the
              study presented in this paper.

Downloaded from https://www.cambridge.org/core. 05 Feb 2022 at 15:56:10, subject to the Cambridge Core terms of use.
ITOH AND MITICI EVALUATING THE IMPACT OF NEW AIRCRAFT SEPARATION MINIMA... 457
Table 3
Distance-based wake turbulence separation minima under RECAT-Dubai
separation standards
Distance-based
Preceding Succeeding wake turbulence
aircraft group aircraft group separation minima
A B 4.0NM
C, D 5.0NM
E, F 6.0NM
G 8.0NM
B B 3.0NM
C, D 4.0NM
E, F 5.0NM
G 7.0NM
C D 3.0NM
E, F 3.5NM
G 6.0NM
D G 4.0NM
E G 4.0NM
Figure 5. Current arrival sets of aircraft categories according to RECAT-Dubai standards. (a) Runway 22,
southerly wind operation, 8–22h. (b) Runway 34L, northerly wind operation, 8–22h.
3.3 Aircraft time separation minima under different standards
In this section we determine the time separation associated with the current ICAO, RECAT-
Dubai, RECAT-US 1.5, and RECAT-EU standards. The same arrival sequences are given to
estimate the time separation. Figure 6 shows the minimum time separation, when these four
standards are applied to the arrival traffic flow at runway 22 and runway 34L. We note that
these runways are used only for arrivals during the congested time period 5:00PM–10:00PM
at Tokyo International Airport. To determine the aircraft time-based separation for each of the
four standards, the distance-based separation minima are divided by the aircraft ground speed
Downloaded from https://www.cambridge.org/core. 05 Feb 2022 at 15:56:10, subject to the Cambridge Core terms of use.458 THE AERONAUTICAL JOURNAL APRIL 2020
Table 4
Comparing the mean and STD of the arrival time separation
Current ICAO standard RECAT-Dubai RECAT-US 1.5 RECAT-EU
Runway 22, southerly wind operation, 5:00PM–10:00PM
Mean (sec) 99.10 84.25 89.61 84.53
STD (sec) 22.50 12.56 20.31 12.83
Runway 34L, northerly wind operation, 5:00PM–10:00PM
Mean (sec) 95.75 81.80 87.03 82.15
STD (sec) 21.94 12.34 19.71 12.62
Figure 6. Comparing the time-separation when four different wake vortex categories are applied to the
arrivals at Tokyo International Airport. (a) Runway 22, southerly wind operation, 17–22h. (b) Runway 34L,
northerly wind operation, 17–22h.
at 5NM prior to the runway threshold. We obtained this aircraft speed from the flight track
data recorded during the period 2016–2017. Table 4 compares the mean and STD values of
the time-based separation when the four standards are taken into consideration. As shown in
Fig. 6 and Table 4, RECAT-Dubai has the best potential to minimise aircraft inter-arrival time,
whereas RECAT-EU shows slightly larger values. However, it is unrealistic to analyse arrival
traffic flows only by considering the time-based separation minima. This is because the air
traffic controllers use safety margins, together with the separation minima, to ensure that the
separation requirements are always maintained during operations. As such, the next section
presents an analysis of the separation minima, together with the safety margins.
3.4 Safety margins depending on the levels of automation support
As a benchmark for safety margins, the Inter-Aircraft Time (IAT) was introduced(19) . This
safety margin corresponds to one standard deviation (STD) value of the aircraft arrival time,
i.e. 68% of the time the aircraft arrives within the mean of the assigned arrival time ± 1/2
IAT. The value of IAT depends on the level of automation of the tools that support air traffic
controllers, as provided in Table 5: ‘No metering’ is the baseline capacity, i.e. the amount traf-
fic the air traffic controllers are able to handle without using any automation tools; ‘Metering’
is the capability when air traffic controllers are supported by arrival management (AMAN)
Downloaded from https://www.cambridge.org/core. 05 Feb 2022 at 15:56:10, subject to the Cambridge Core terms of use.ITOH AND MITICI EVALUATING THE IMPACT OF NEW AIRCRAFT SEPARATION MINIMA... 459
Table 5
Inter-Aircraft Time (IAT) when applying different levels of automation(19)
Capacity IAT (sec)
No metering (baseline) 18.0
Metering 16.5
GIM-S, TSAS 12.0
IM 5.0
Figure 7. Estimation of arrival rates according to combinations of wake vortex categories and automation
levels.
systems, which automatically suggest the ideal arrival time schedules; ‘GIM-S, TSAS’ is the
capability supported by advanced levels of AMAN (refer to Ref. (7)); and ‘IM’ is its combi-
nation with aircraft self-separation (refer to Ref. (8)). In general, as the level of automation
support increases, the values of IAT decrease. Therefore, a higher level of automation support
can accommodate an increased aircraft arrival rate.
3.5 Estimating the arrival rate at Runway 22 under various separation
standards and safety margins resulting from automation
Figure 7 shows the arrival rate (number of arrival aircraft per hour) at Runway 22 λRW22 ,
under the four separation standards and considering the safety margins for different levels of
automation. We determine this arrival rate as follows:
3600.0
λRW22 = , · · · (1)
E[tmin] + tIAT
where E[tmin ] is the mean of the minimum time separation (sec) at Runway 22 for southerly
wind operation during the period 5:00–10:00PM, corresponding to each wake vortex category
in Table 8, and tIAT is IAT in seconds corresponding to each automation level in Table 5.
Downloaded from https://www.cambridge.org/core. 05 Feb 2022 at 15:56:10, subject to the Cambridge Core terms of use.460 THE AERONAUTICAL JOURNAL APRIL 2020
Figure 7 shows that the introduction of the RECAT categories has the potential to support
an increase in the aircraft arrival rate up to 133% (40 arrivals per hour) with the highest
automation support ‘IM,’ when compared with the current arrival rate of 30 arrivals per hour
from the south-west (see Fig. 3(b)). When considering the highest level of automation support
‘IM,’ the current ICAO standard supports an increase in the arrival rate of up to 116% (35
arrivals per hour). Without any automation support, the current ICAO standard supports an
increase in the arrival rate up to 103% (31 arrivals per hour). However, RECAT-Dubai and
RECAT-EU lead to an increase in up to 116% (35 arrivals per hour) relative to the current
arrival rate (30 arrivals per hour). In the case of ‘metering’ automation support, RECAT-
Dubai and RECAT-EU increase the arrival rate up to 120% (36 arrivals per hour), compared
to the current ICAO standards that allow the arrival rate to increase to a maximum rate of
103% (31 arrivals per hour).
4.0 MODELING THE FLOW OF ARRIVAL AIR TRAFFIC
UNDER CURRENT OPERATIONAL STANDARDS
4.1 Modeling the flow of arrival air traffic using a G / G / c queuing model
We propose a queuing model for traffic arriving from the south-west at Tokyo International
Airport between 5:00PM and 10:00PM, which represents the most congested arrival period.
We specify our queuing model using the arrival flow, service time, and the number of servers
as follows. The aircraft arrive in a given airspace according to an hourly rate, i.e. a specified
number of arrivals per hour, referring to Figs 3(b) and 7. The time between two consecutive
arrivals in an airspace area is termed the aircraft inter-arrival time. Upon arrival, the aircraft
receives a service time, i.e. the time the aircraft spends flying in the given airspace. We con-
sider a multi-server queuing model, in which the number of servers indicates the number of
aircraft that are allowed to be present at any time in the given airspace, i.e. the capacity of
the given airspace. We apply this model to nine disjoint airspace areas, defined as concentric
circles centered at the airport and with radii increasing in increments of 10NM (see Fig. 8).
We formulate this aircraft arrival process by means of a G/G/c queuing model as follows.
We consider the circular airspace with a radius of 100NM centered at the airport. We partition
this area using concentric circles (see Fig. 8) centered at the airport, with radii at increments
of 10NM. This partitioning defines nine airspace areas 1, 2, . . . , 9, where area 1 is the airspace
area centered at the airport within the circular rings with radii of 10 and 20NM, area 2 is the
airspace area centered at the airport within the circular rings with radii of 20 and 30NM radii,
and so on. An aircraft arriving at area 1 crosses the circle with radius of 20NM, whereas an
aircraft arriving at area 2 crosses the circle with radius of 30NM, and so on.
The G/G/c queuing model allows us to estimate potential aircraft delay time under the
assumption that both service time and inter-arrival time follows general distributions. This
paper applies the G/G/c model because this model fits the data characteristics of the both
distributions of service time and inter-arrival time. An airborne delay would occur when the
aircraft is requested to fly a longer route, i.e. vectoring/metering/speed adjustments.
Let Di denote the delay an aircraft experiences in airspace area i, 1 ≤ i ≤ 9 because of the
lack of capacity in area i − 1. Then we approximate the total airborne delay in airspace area i
as follows(20-23) :
G/G/c M/M/c CA2 i + CB2 i
E[Di ] E[Di ] , · · · (2)
2
Downloaded from https://www.cambridge.org/core. 05 Feb 2022 at 15:56:10, subject to the Cambridge Core terms of use.ITOH AND MITICI EVALUATING THE IMPACT OF NEW AIRCRAFT SEPARATION MINIMA... 461
Figure 8. Illustration of the service time and inter-arrival time in the airspace divided into nine areas.
√
σ [Ai ]
where CAi = E[Ai √
]
is the coefficient of variation of the aircraft inter-arrival time in airspace
σ [Bi ]
area i and CBi = E[Bi ] is the coefficient of variation of the aircraft service time in airspace
area i. Here E[Ai ] and σ [Ai ] are the mean and variance of aircraft inter-arrival time, and E[Bi ]
and σ [Bi ] are the mean and variance of aircraft service time in the airspace area i.
M/M/c
In Equation (2), E[Di ] denotes the expected aircraft delay time in airspace area i
when a M/M/c queuing model is considered, which is well known(16,17,24,25) . This means
that the arrival process is considered a Poisson process with a parameter λi , with service
times are assumed to follow an exponential distribution with a parameter μi and there is a
fixed number of parallel servers ci . Identical servers is well-known and determined, following
Refs. (24) and (25).
Moreover, for stability, we have that
λi
ρi = < 1. · · · (3)
ci · μi
If ρi is not less than 1, then the queue becomes unstable and the estimated delay time for
incoming aircraft tends to become extraordinarily long.
4.2 Parameter estimation for the G / G / c queuing model based on flight
track data analysis
We estimate the parameter of the G/G/c queuing model as follows. For each airspace area i ∈
{1, 2, . . . , 9}, we estimate the values of ci to be the number of aircraft present at the same
time in this area, as recorded in the historical flight track data. Figure 9 shows the num-
ber of aircraft present in airspace area i ∈ {1, 2, . . . , 9} every 10min during the time period
5:00PM–10:00PM during the 2 years (2016–2017) of flight track data. An analysis of the his-
torical flight data shows that the highest mean number of aircraft in airspace i, i ∈ {1, 2, . . . , 9}
is at most two. Thus, we choose c = 2 to represent the current capacity for airspace i, i ∈
{1, 2, . . . , 9}.
The value c = 2 is also relevant from the perspective of safety requirements and mini-
mum aircraft separation standards because the inter-arrival aircraft distance is approximately
Downloaded from https://www.cambridge.org/core. 05 Feb 2022 at 15:56:10, subject to the Cambridge Core terms of use.462 THE AERONAUTICAL JOURNAL APRIL 2020
Table 6
Parameters of exmpirical distributions of the inter-arrival time and service
time in seconds and squared seconds, for the G/G/c model
i 1 2 3 4 5 6 7 8 9
E[Ai ] 111.5 112.4 111.8 108.9 108.3 107.3 106.7 106.2 106.3
σ [Ai ] 473.7 623.3 707.2 2607 3488 3720 4048 4267 4723
E[Bi ] 219.7 153.7 186.0 163.2 121.9 99.24 93.18 86.11 83.84
σ [Bi ] 7016 508.5 3666 1640 331.9 177.1 181.6 154.5 179.5
ρi (c = 2) 0.9853 0.6838 0.8313 0.7495 0.5626 0.4624 0.4364 0.4053 0.3944
Figure 9. Data-driven estimates of the number of servers, c, for the G/G/c model.
5NM (i.e. two aircraft within a 10NM range in-trail), which is exactly the minimum aircraft
separation currently required for radar separation in the en-route airspace.
The mean and variance of the inter-arrival time, E[Ai ] and σ [Ai ], are estimated from the
data distribution of the time-separation between the preceding and succeeding aircraft when
entering airspace area i ∈ {1, 2, . . . , 9}. The mean and variance of the service time, E[Bi ] and
σ [Bi ], are estimated from the data distribution of the flight time in each airspace area i. Table 6
lists the values of these parameters with ρi when c = 2 is given. As shown in Table 6, all values
of ρi satisfy the stability condition in Equation (3).
5 ANALYSING THE IMPACT OF NEW AIRCRAFT
SEPARATION STANDARDS ON ARRIVAL
OPERATIONS
5.1 Estimating the minimum required airspace capacity
As discussed in Section 4.1, Equation (3) shows the condition for queue stability. In this
section we estimate the minimum required airspace capacity while ensuring that the queue
remains stable, i.e. that ρ < 1.
Downloaded from https://www.cambridge.org/core. 05 Feb 2022 at 15:56:10, subject to the Cambridge Core terms of use.ITOH AND MITICI EVALUATING THE IMPACT OF NEW AIRCRAFT SEPARATION MINIMA... 463
Figure 10. Comparison of maximum arrival rate satisfying ρ < 1.
Figure 10 shows the estimation of the maximum arrival rate λi , i ∈ {1, 2, . . . , 9}, under a
fixed service rate E[Bi ] (see Table 6) and airspace capacity ci ∈ {1, 2, 3}, such that ρ → 1.
As shown in Fig. 10, increasing the airspace capacity ci allows for higher arrival rates for
all airspace i ∈ {1, . . . , 9}. For c = 1, 32 arrivals per hour is not allowed because the queue
stability condition for airspace i ∈ {1, 2, . . . , 5} no longer holds. When c = 2, the maximum
arrival rate allowed in airspace i = 1 is 32 arrivals, while 40 arrivals are not allowed in airspace
i = 3. If c = 3, then for all airspace i ∈ {1, 2, . . . , 9} it is possible to have 40 arrivals per hour.
Thus, for airspace i = 1, we need to ensure a capacity of at least c1 = 2 to be able to handle
32 arrivals per hour, while c1 = 3 is required to be able to handle 40 arrivals per hour.
Table 7 summarises the minimum ci values to stabilise the G/G/c queuing model for
airspace i, i ∈ {1, 2, . . . , 9}. Table 7 shows that the airspace closer to the airport requires more
capacity (larges values for ci ), especially in the airspace i ∈ {1, 3}. This is because close to
the destination airport, i.e. airspace i = 1, the aircraft slow down. Thus, the mean service rate
is reduced. In the airspace i = 3 and 4, especially i = 3, the inter-aircraft arrival time is con-
trolled by using vectoring operations. As a result, in this airspace the aircraft change their
heading direction and adjust the spacing between succeeding aircraft. Therefore, the service
rate μi is reduced in the airspace i = 1, 3, 4. In i = 2, the aircraft inter-arrival time is already
controlled, and most arriving aircraft follow in-trail because the airspeed is faster than in the
i = 1 airspace.
5.2 Impact on aircraft arrival delay when increasing airspace capacity
In this section we estimate the arrival delay time in airspace i ∈ {1, 2, 3, 4}, where the max-
imum arrival rate is limited in comparison with the airspace i, i ∈ {5, . . . , 9} (see Fig. 10).
As shown in Fig. 11, we consider five combinations of arrival rates and airspace capacities,
which satisfy the minimum ci in Table 7, to estimate the arrival time delay. First, for the
current arrival rate of 30 arrivals per hour, the capacity c = 2 results in an increased arrival
time delay in comparison with the cases when c = 3. Thus, increasing the airspace capacity to
ci = 3, i ∈ {1, 2, 3, 4}, is an efficient solution for mitigating arrival delay. However, even when
Downloaded from https://www.cambridge.org/core. 05 Feb 2022 at 15:56:10, subject to the Cambridge Core terms of use.464 THE AERONAUTICAL JOURNAL APRIL 2020
Table 7
Minimum ci values that enable the arrival rates of 32, 36, and 40 arrivals per
hour, respectively, to be handled in airspace i, i ∈ {1, 2, . . . , 9}
Arrival rate Airspace area i
(aircraft/hour) 1 2 3 4 5 6 7 8 9
32 2 2 2 2 2 1 1 1 1
36 3 2 2 2 2 1 1 1 1
40 3 2 3 2 2 2 2 1 1
Table 8
Comparison of the mean and STD of the arrival time separation for the
metering operation
Current ICAO standard RECAT-Dubai RECAT-EU RECAT-US 1.5
Runway 22, south wind operation, 5:00PM–10:00PM
Mean (NM) 4.430 3.858 3.869 4.061
STD (NM) 0.8185 0.4197 0.4270 0.7327
Figure 11. Comparison of arrival delay time in airspace i ∈ {1, 2, 3, 4}.
considering ci = 3, for high arrival rates of 40 aircraft per hour, the arrival delay time remains
high, especially in the case of airspace i = 1.
5.3 Aircraft arrival delay for various values of the variance of the service
time and the variance of the inter-arrival time
Generally, reducing the variance of the service time and inter-arrival time are options to miti-
gate the delay in the arrival time in each airspace i ∈ {1, 2, . . . , 9}. In this section we determine
the arrival delay for various values of the variance of the service time and the inter-arrival
Downloaded from https://www.cambridge.org/core. 05 Feb 2022 at 15:56:10, subject to the Cambridge Core terms of use.ITOH AND MITICI EVALUATING THE IMPACT OF NEW AIRCRAFT SEPARATION MINIMA... 465
Figure 12. Aircraft arrival delay for various values of the variance of the inter-arrival time and service
time – airspace i = 1. (a) c1 = 2, 32 arrivals per hour. (b) c1 = 3, 32 arrivals per hour. (c) c1 = 3, 36 arrivals
per hour.
Figure 13. Arrival delay under various values for the variance of the inter-arrival time and service time –
ci = 2, 32 arrivals per hour, at airspace i ∈ {2, 3, 4, 5}. (a) i = 2. (b) i = 3. (c) i = 4. (d) i = 5.
time, respectively. We consider different aircraft arrival rates and airspace capacities ci such
that the requirements in Table 7 are satisfied.
Figure 12 shows the arrival delay for various values of the airspace capacity c1 and aircraft
arrival rates. Figure 12(a) indicates that, when c1 = 2, the arrival delay dramatically increases
even though the variance decreases. Thus, c1 = 3 is necessary at airspace i = 1 to enable 32
arrivals per hour to be handled (see Fig. 12(b)). Increasing the variance of the service time
is critical for the arrival delay, especially when considering higher arrival rates, e.g. 32 or
36 arrivals per hour. In general, the variance of the service time at airspace i = 1 is larger
than that in the other airspace i, i ∈ {2, 3, . . . , 9} (see also Table 6) because in this area the
arriving aircraft slow down before landing, and they are also affected by the wind velocity
and wind direction associated with the used runway configuration. Because of this, in airspace
i = 1, significant traffic control is necessary to ensure that the arrival delay is limited to the
minimum.
Figures 13-15 show the arrival delay by varying the variance of the service time and inter-
arrival time, respectively, at airspace i ∈ {2, 3, 4, 5}. We consider the case when ci ∈ {2, 3} and
an arrival rate of 32 and 36 aircraft arriving per hour. The lowest service rate (the service time
with the highest mean) is in airspace i = 3 among the airspace i ∈ {2, 3, 4, 5} (see Table 6),
and the second lowest service rate is in airspace i = 4 (see Table 6). This can be explained by
the fact that currently, in these two areas, the air traffic controllers space the arriving aircraft.
Thus, in the airspace i = 3, 4, when ci = 2, the arrival delay time increases even for small
values of the service and inter-arrival variance, as shown in Figs 13 and 14. Increasing the
airspace capacity ci = 3 is the most realistic solution to mitigate the arrival delay time, rather
than minimising the variance of the service time and the inter-arrival time (see Fig. 15).
Downloaded from https://www.cambridge.org/core. 05 Feb 2022 at 15:56:10, subject to the Cambridge Core terms of use.466 THE AERONAUTICAL JOURNAL APRIL 2020
Figure 14. Arrival delay for various values of the variance of the inter-arrival time and the service time,
ci = 2, 36 arrivals per hour, at airspace i ∈ {2, 3, 4, 5}. (a) i = 2. (b) i = 3. (c) i = 4. (d) i = 5.
Figure 15. Arrival delay under various values for the variance of the inter-arrival time and the service time,
ci = 3, 36 arrivals per hour, at airspace i ∈ {2, 3, 4, 5}. (a) i = 2. (b) i = 3. (c) i = 4. (d) i = 5.
Figure 16. Arrival delay for various values of the variance of the inter-arrival time and the service time,
ci = 1, 32 arrivals per hour, at airspace i ∈ {6, 7, 8, 9}. (a) i = 6. (b) i = 7. (c) i = 8. (d) i = 9.
Figure 17. Arrival delay for various values of the variance of the inter-arrival time and the service time,
ci = 2, 32 arrivals per hour, at airspace i ∈ {6, 7, 8, 9}. (a) i = 6. (b) i = 7. (c) i = 8. (d) i = 9.
Figures 16-18 show the arrival delay for various values of the variance of the service time
and inter-arrival time at airspace i ∈ {6, 7, 8, 9}. Although the minimum airspace capacity in
these areas is estimated to be ci = 1, i ∈ {6, 7, 8, 9}, as shown in Table 7, in the airspace i ∈
{6, 7, 8, 9}, ci = 2 is required to minimise the arrival delay time for both of the arrival rates of
32 and 36 arrivals per hour.
Downloaded from https://www.cambridge.org/core. 05 Feb 2022 at 15:56:10, subject to the Cambridge Core terms of use.ITOH AND MITICI EVALUATING THE IMPACT OF NEW AIRCRAFT SEPARATION MINIMA... 467
Figure 18. Arrival delay under various values of the variance of the inter-arrival time and the service time,
ci = 2, 36 arrivals per hour, at airspace i ∈ {6, 7, 8, 9}. (a) i = 6. (b) i = 7. (c) i = 8. (d) i = 9.
Figure 19. Estimation of service time E[B].
These results clarify that increasing the airspace capacity is a higher-priority strategy than
the effort of minimising the variance of the service time, except for the case of airspace i = 5.
Figure 14(d) shows that, for the current inter-arrival time with a variance of 3,488 sec2 (see
Table 6) the arrival delay time is large. This shows that for airspace i = 5, to limit the arrival
delay we have two possible strategies when considering an arrival rate of 36 arrivals per hour:
(1) increase the airspace capacity c5 = 3 (see Fig. 15(d)) or, (2) maintain c5 = 2 and limit the
inter-arrival time variance (see Fig. 14(d)).
5.4 Service time envelopes estimating the arrival delay
Optimising the service time in each airspace i is the other potential solution for mitigating the
arrival delay time while increasing the arrival rate. Figure 19 shows the estimated envelope of
the maximum service time satisfying the condition ρ < 0.85. Figure 19 shows that an increase
in the arrival rate reduces the service time at the same capacity c. At a larger capacity c, the
service time is increased.
The estimated service time shown in Fig. 19 is given to airspace i ∈ {1, 2, . . . , 9} for esti-
mating the arrival time delay corresponding to airspace capacity ci and the arrival rate as
shown in Fig. 20. One of the features clarifies that the arrival time delay increases while i
increases if the same amount of service time is allowed. This means that the delay in the
arrival time increases if the same amount of flight time associated with the airspace closer
Downloaded from https://www.cambridge.org/core. 05 Feb 2022 at 15:56:10, subject to the Cambridge Core terms of use.468 THE AERONAUTICAL JOURNAL APRIL 2020
Figure 20. Estimating the impact of the service time at airspace i ∈ {1, 2, 3, . . . , 9}. (a) i = 1. (b) i = 2. (c)
i = 3. (d) i = 4. (e) i = 5. (f) i = 6. (g) i = 7. (h) i = 8. (i) i = 9.
to the arrival airport would be associated with the airspace farther away. In other words, it is
more efficient to extend the flight time closer to the arrival airport than in the airspace farther
away. One of the reasons is that the variance of the inter-arrival time becomes larger in the
case of the airspace farther away, as shown in Table 6. To increase the service time is more
effective when the variance of the inter-arrival time is smaller. This means that extending the
flight time in airspace farther away is not the solution to reduce the arrival delay time.
6.0 DISCUSSION
The results of our analysis clarified that the best strategy to increase the amount of arriving
traffic while minimising the arrival delay time in the airspace within a circle with a radius
of 100NM centered at the Tokyo International Airport is as follows: (1) allowing an airspace
capacity c1 = 3 and minimising the variances of the service time in the airspace i = 1; (2)
allowing ci = 3 in the airspace i ∈ {2, 3, 4}; (3) allowing c5 = 3, or c5 = 2 and reducing the
variances of the inter-arrival time; (4) allowing ci = 2 in the airspace i ∈ {6, 7, 8, 9}. The
airspace i = 5, 6 is the transition area in which to control the airspace capacity from ci = 2
to ci = 3. These results provide the key requirements for designing the E-AMAN system
intended to support the arrival scheduling tasks of air traffic controllers.
Downloaded from https://www.cambridge.org/core. 05 Feb 2022 at 15:56:10, subject to the Cambridge Core terms of use.ITOH AND MITICI EVALUATING THE IMPACT OF NEW AIRCRAFT SEPARATION MINIMA... 469
Figure 21. Comparison of the distance separation with the safety margin for the metering condition of
different standards.
Satisfying 2 < ci ≤ 3 means that in-trail arrival aircraft achieve an approximate distance-
separation of between 3.3 and 5NM. Considering the queue of preceding arrival aircraft, the
preferred distance-separation should be closer to 3.3NM. Figure 21 and Table 8 compare
the mean and STD of the distance-separation each of the wake vortex categories achieves at
Runway 22 with the safety margin of the metering operation (see Table 5). A comparison of
the mean values of the distance-separation indicates that all four standards satisfy 2 < ci ≤
3. However, 36 arrivals per hour would be achievable only by applying RECAT-Dubai and
RECAT-EU at Runway 22 (see Fig. 7).
In the current operation, radar separation minima is 3NM in the terminal area, and 5NM in
the en-route sectors. Currently, the boundary between the terminal and en-route area for the
south-west traffic is located at around 60–80NM away from the Tokyo International Airport.
Therefore, the recommendations above satisfy the current operational constraints.
Shifting the arrival delay time to airspace farther away from the arrival airport is not an
option to mitigate the arrival delay time because the variances of the inter-arrival time increase
as the distance from the arrival airport becomes longer. Extending the mean of the service
time (flight time) only has a powerful effect when the aircraft inter-arrival time is controlled to
minimise the variance. Thus, arrival strategies to extend the aircraft flight time, i.e. vectoring
and point-merge, are effective in the airspace close to the airport where the variance of the
inter-arrival time is controlled.
7.0 CONCLUSION
This study has analysed arrival strategies to minimise the delay in aircraft arrival while allow-
ing future growth in the amount of arrival traffic. A data-driven queuing model was proposed
to analyse the impacts of applying new wake vortex minima, which reduces the aircraft inter-
arrival time, on the traffic flow of aircraft arriving within a circle with a radius of 100NM
centered at the arrival airport. Two years of data consisting of radar tracks and flight plans of
air traffic arriving at Tokyo International Airport were analysed as a case study. The volume
of future arrival traffic was estimated by using both the new time-separation standards and
Downloaded from https://www.cambridge.org/core. 05 Feb 2022 at 15:56:10, subject to the Cambridge Core terms of use.470 THE AERONAUTICAL JOURNAL APRIL 2020
the level of automation support. Based on the data-driven analysis and the estimation of the
future traffic volume, a queue-based model was proposed to analyse the impact on the delay
in arrival time of potential future arrival strategies. Based on the analysis, the best arrival
strategy was suggested based on the distance from the arrival airport.
Based on the proposed requirements for future arrival scheduling, the next step would be
the engineering design of the E-AMAN system. Human-in-the-loop simulation, which evalu-
ates the operational feasibility of air traffic controllers and pilot operation, will be conducted
to clarify the effectiveness of the proposed design requirements in the real operation.
In this study, the volume of traffic arriving in future has been estimated by only considering
aircraft separation standards and the performance of automation support for arrival manage-
ment. However, this estimation would be more precise if we were to consider constraints on
the departure and airport management, i.e. runway occupancy time. In future, we plan to
extend the proposed approach not only to arrival traffic, but also departure traffic and the
airport surface movements.
ACKNOWLEDGEMENTS
This research was conducted under CARATS initiatives supported by the Japan Civil Aviation
Bureau (JCAB), Ministry of Land, Infrastructure, Transport and Tourism (MLIT) as the
‘Studies on the Extended Arrival Management.’ This research was also supported by the
Ministry of Education, Culture, Sports, Science and Technology (MEXT) as the ‘Post-
K Computer Exploratory Challenge’ (Exploratory Challenge 2: Construction of Models
for Interaction Among Multiple Socioeconomic Phenomena, Model Development and its
Applications for Enabling Robust and Optimized Social Transportation Systems, Project ID:
hp180188). The authors are grateful to JCAB for providing air traffic data, and Ms. Mayumi
Ohnuki for assisting data preparation and figure corrections. The authors would like to thank
Enago (www.enago.jp) for the English language review.
REFERENCES
1. ROOSELEER, F. and TREVE, V. RECAT-EU European wake turbulence categorisation and separation
minima on approach and departure. Eurocontrol, 2015. https://www.eurocontrol.int/publication/
european-wake-turbulence-categorisation-and-separation-minima-approach-and-departure
2. Federal Aviation Administration (FAA). Wake turbulence recategorization, Air Traffic
Organization Policy, Order: JO 7110.659B, 2015.
3. General Civil Aviation Authority. OMDB – Dubai/international – implementation of Dubai re-
categorisation (RECAT) wake turbulence separation scheme within Dubai CTA, AIP Supplement
– United Arab Emirates, 2019.
4. Passenger traffic 2016 final (annual), Airports Council International (ACI), 1st January, 2018.
5. ERZBERGER, H. and ITOH, E. Design principles and algorithms for air traffic arrival scheduling,
NASA/TP-2014-218302, 2014.
6. Federal Aviation Administration. Nextgen portfolio – time based flow management, 2017.
7. THIPPHAVONG, J., JUNG, J., SWENSON, H., MARTIN, L., LIN, M. and NGUYEN, J. Evaluation of the termi-
nal sequencing and spacing system for performance-based navigation arrivals, 2013 IEEE/AIAA
32nd Digital Avionics Systems Conference (DASC), 2013.
8. VAN TULD, P. Flight deck interval management flight test final report, NASA/CR-2017-219626,
June 2017, 2017.
9. EUROPEAN COMMISSION. Cross border SESAR trials for enhanced arrival management: periodic
reporting for period 1 – PJ25 XSTREAM, 2017.
Downloaded from https://www.cambridge.org/core. 05 Feb 2022 at 15:56:10, subject to the Cambridge Core terms of use.ITOH AND MITICI EVALUATING THE IMPACT OF NEW AIRCRAFT SEPARATION MINIMA... 471
10. International Civil Aviation Organization. Long range ATFM concept trials, The 8th Meeting of
the ICAO Asia/Pacific Air Traffic Flow Management Steering Group (ATFMSG/8), May 2018,
2018.
11. ITOH, E., BROWN, M., SENOGUCHI, A., WICKRAMASINGHE, N. and FUKUSHIMA, S. Future arrival man-
agement collaborating with trajectory-based operations. In Air Traffic Management and Systems
II, pp 137–156, Springer, Japan, 2017.
12. BÄUERLE, N., ENGELHARDT-FUNK, O. and KOLONKO, M. On the waiting time of arriving aircrafts and
the capacity of airports with one or two runways, Eur J Oper Res, 2007, 177, (2), pp 1180–1196.
13. LONG, D., JOHNSON, J., GAIER, E.M. and KOSTIUK, P.F. Modeling air traffic management technologies
with a queuing network model of the national airspace system, NASA Langley Technical Report
Server, 1999.
14. RUE, R.C. and ROSENSHINE, M. The application of semi-Markov decision processes to queuing of
aircraft for landing at an airport, Transp Sci, 1985, 19, (2), pp 154–172.
15. BOLENDER, M.A. and SLATER, G.L. Evaluation of scheduling methods for multiple runways, J Aircr,
2000, 37, (3), pp 410–416.
16. ITOH, E. and MITICI, M. Queue-based modeling of the aircraft arrival process at a single airport,
Aerospace, 2019, 6, (10), 103. https://doi.org/10.3390/aerospace6100103.
17. ITOH, E. and MITICI, M. Analyzing tactical control strategies for aircraft arrivals at an airport using
queue-based modeling, Under Review, 2019.
18. International Civil Aviation Organization. Long-term traffic forecasts passenger and cargo, total
passenger traffic: history and forecasts, p 10, 2016.
19. ARBUCKLE, D. Interval management application, ICAO Aircraft Surveillance Applications
Workshop, March 2017.
20. WHITT, W. The queuing network analyzer, Bell Syst Tech J , 1983, 62, (9), pp 2779–2815.
21. WHITT, W. Approximations for the GI/G/m queue, Prod Oper Manage, 1993, 2, (2), pp 114–161.
22. KIMURA, T. A two-moment approximation for the mean waiting time in the GI/G/s queue, Manage
Sci, 1986, 32, (6), pp 751–763.
23. KINGMAN, J.F.C. The single server queue in heavy traffic, In Mathematical Proceedings of the
Cambridge Philosophical Society, vol 57, pp 902–904, Cambridge University Press, UK, 1961.
24. HILLIER, F. Introduction to Operations Research, Tata McGraw-Hill Education, US, 2012.
25. ADAN, I. and RESING, J. Queuing systems, Eindhoven University, 2015.
Downloaded from https://www.cambridge.org/core. 05 Feb 2022 at 15:56:10, subject to the Cambridge Core terms of use.You can also read


