Evaluating the social and ecological effectiveness of partially protected marine areas
←
→
Page content transcription
If your browser does not render page correctly, please read the page content below
Contributed Paper

Evaluating the social and ecological effectiveness of
partially protected marine areas
John W. Turnbull ,1,2 Emma L. Johnston ,1,2 and Graeme F. Clark                                             1,2

1
  School of Biological, Earth and Environmental Sciences, University of New South Wales, Kensington Campus, Sydney, NSW 2052,
Australia
2
  Evolution and Ecology Research Center, University of New South Wales, BEES, Sydney, NSW 2052, Australia

Abstract: Marine protected areas (MPAs) are a primary tool for the stewardship, conservation, and restoration
of marine ecosystems, yet 69% of global MPAs are only partially protected (i.e., are open to some form of fishing).
Although fully protected areas have well-documented outcomes, including increased fish diversity and biomass,
the effectiveness of partially protected areas is contested. Partially protected areas may provide benefits in some
contexts and may be warranted for social reasons, yet social outcomes often depend on MPAs achieving their
ecological goals to distinguish them from open areas and justify the cost of protection. We assessed the social
perceptions and ecological effectiveness of 18 partially protected areas and 19 fully protected areas compared
with 19 open areas along 7000 km of coast of southern Australia. We used mixed methods, gathering data via
semistructured interviews, site surveys, and Reef Life (underwater visual census) surveys. We analyzed qualitative
data in accordance with grounded theory and quantitative data with multivariate and univariate linear mixed-
effects models. We found no social or ecological benefits for partially protected areas relative to open areas in our
study. Partially protected areas had no more fish, invertebrates, or algae than open areas; were poorly understood
by coastal users; were not more attractive than open areas; and were not perceived to have better marine life than
open areas. These findings provide an important counterpoint to some large-scale meta-analyses that conclude
partially protected areas can be ecologically effective but that draw this conclusion based on narrower measures.
We argue that partially protected areas act as red herrings in marine conservation because they create an illusion
of protection and consume scarce conservation resources yet provide little or no social or ecological gain over
open areas. Fully protected areas, by contrast, have more fish species and biomass and are well understood,
supported, and valued by the public. They are perceived to have better marine life and be improving over time in
keeping with actual ecological results. Conservation outcomes can be improved by upgrading partially protected
areas to higher levels of protection including conversion to fully protected areas.

Keywords: environmental stewardship, fully protected areas, marine protected areas, mixed methods, partially
protected areas, social–ecological systems

Análisis de la Efectividad Social y Ecológica de las Áreas Marinas Parcialmente Protegidas

Resumen: Las áreas marinas protegidas (AMPs) son una herramienta importante para la administración, conser-
vación y restauración de los ecosistemas marinos; sin embargo, el 69% de las AMPs mundiales solamente están
parcialmente protegidas (es decir, están abiertas a alguna forma de pesca). Aunque las áreas completamente pro-
tegidas tienen resultados bien documentados, incluyendo el incremento en la diversidad de peces y la biomasa, la
efectividad de las áreas parcialmente protegidas está en disputa. Puede que las áreas parcialmente protegidas se
justifiquen por razones sociales, aunque los resultados sociales con frecuencia dependen de que las AMPs alcancen
sus metas ecológicas para distinguirlas de las áreas abiertas y justificar el costo de la protección. Analizamos las
percepciones sociales y la efectividad ecológica de 18 áreas parcialmente protegidas y 19 áreas completamente
protegidas a lo largo de 7000 km de costa en el sur de Australia. Usamos métodos mixtos, recopilando información
por medio de entrevistas semiestructuradas, encuestas en sitio y censos Reef Life (censos visuales submarinos).

Address correspondence to John Turnbull email john.turnbull@unsw.edu.au
Article impact statement: Partially protected areas create an illusion of protection and consume conservation resources for little or no social–
ecological gain.
Paper submitted March 5, 2020; revised manuscript accepted September 20, 2020.
This is an open access article under the terms of the Creative Commons Attribution-NonCommercial License, which permits use, distribution
and reproduction in any medium, provided the original work is properly cited and is not used for commercial purposes.
                                                                                                                                                         921
                                     Conservation Biology, Volume 35, No. 3, 921–932
                                     © 2021 The Authors. Conservation Biology published by Wiley Periodicals LLC on behalf of Society for Conservation Biology
                                     DOI: 10.1111/cobi.13677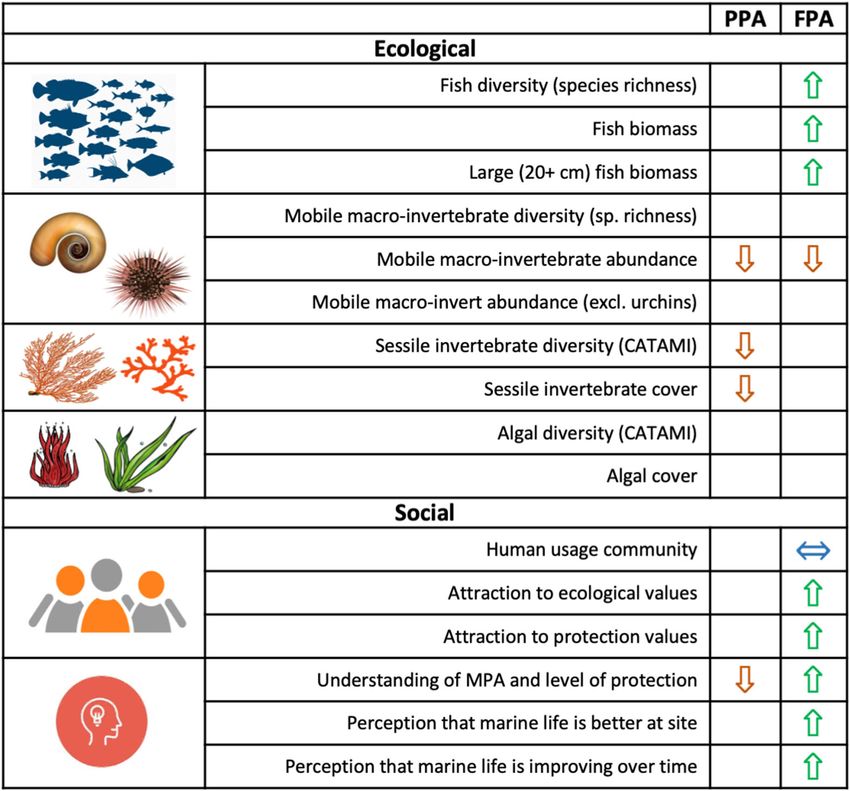
922                                                                                                                  Protected Areas

Analizamos los datos cualitativos de acuerdo con la teoría fundamentada y los datos cuantitativos con modelos
lineales de efectos mixtos multivariados y univariados. No encontramos beneficios sociales o ecológicos para
las áreas parcialmente protegidas en relación con las áreas abiertas en nuestro estudio. Las áreas parcialmente
protegidas no tuvieron más peces, invertebrados o algas que las áreas abiertas; los usuarios de la costa tenían
poco entendimiento de ellas; no eran más atractivas que las áreas abiertas; y no eran percibidas como albergues
de mejor vida marina que las áreas abiertas. Estos hallazgos proporcionan un contrapunto importante a algunos
metaanálisis a gran escala que concluyen que las áreas parcialmente protegidas pueden ser ecológicamente efec-
tivas, pero llegan a esta conclusión con base en medidas más reducidas. Discutimos que las áreas parcialmente
protegidas funcionan como pistas falsas para la conservación marina pues crean una ilusión de estar protegidas y
consumen pocos recursos para la conservación, pero proporcionan poca o ninguna ganancia ecológica o social
en comparación con las áreas abiertas. Las áreas completamente protegidas, al contrario, tienen más especies
de peces y biomasa y están bien comprendidas, respaldadas y valoradas por el público. Este tipo de AMPs son
percibidas como albergues de mejor vida marina y como en constante mejora con el tiempo al mantenerse en
regla con los resultados ecológicos actuales. Los resultados de la conservación pueden mejorarse si se eleva a las
áreas parcialmente protegidas a niveles más altos de protección incluyendo la conversión a áreas completamente
protegidas.

Palabras Clave: administración ambiental, áreas marinas protegidas, áreas completamente protegidas, áreas
parcialmente protegidas, métodos mixtos, sistemas socioecológicos

:  (MPAs) , , 69%
 () ,
, ,
 , ,
  18 19 ,
    7000 19      Reef Life
 ()  ,  ,
 ,
 ; ;
;
   , ,  ,
  ,       ,
,  ,  ,
,       ,
   ,   , ,
,  :;:

: , , , , ,

Introduction                                                         tected areas (FPAs) (Zupan et al. 2018a) are considered
                                                                     the gold standard for ecological effectiveness (Costello
No area in the ocean is untouched by human activity, and             & Ballantine 2015; Sala & Giakoumi 2017), yet they
over 40% of the marine environment is strongly affected              comprise just 2.46% of the area of the world’s oceans
by multiple stressors, often with cumulative impacts                 (UNEP-WCMC and IUCN, 2020). Partially protected ar-
(Halpern et al. 2015). Marine protected areas (MPAs) are             eas (PPAs), which allow the use of some fishing methods
a primary tool for stewardship, restoration, and conserva-           but not others (Zupan et al. 2018a), comprise 5.45% of
tion of marine ecosystems, and much research has been                the world’s oceans and the majority (69%) of MPA area
dedicated to understanding the factors that contribute to            (UNEP-WCMC and IUCN 2020).
their effectiveness (Ballantine 2014). Although substan-                Fully protected areas may be categorized as Interna-
tial areas of the ocean have been assigned to MPAs, many             tional Union for Conservation of Nature (IUCN) cate-
of these are ineffective, raising concerns that the illusion         gories Ia, Ib, II, or III (Day et al. 2012). Partially pro-
of conservation has been created (Costello & Ballantine              tected areas may be categorized as IUCN IV, provided
2015; Edgar 2017).                                                   fishing can be managed in a way that is compatible with
   Poor design and management have been highlighted                  MPA objectives, or V or VI if fishing is sustainable (Day
as key issues in MPA effectiveness, including factors                et al. 2012). Commercial or industrial fishing is incom-
such as size, level of protection, management, and en-               patible with all types of MPAs (IUCN WCPA, 2018). Al-
forcement (Edgar 2017). Sanctuary, no-take or fully pro-             though new MPAs continue to be declared, there is a

Conservation Biology
Volume 35, No. 3, 2021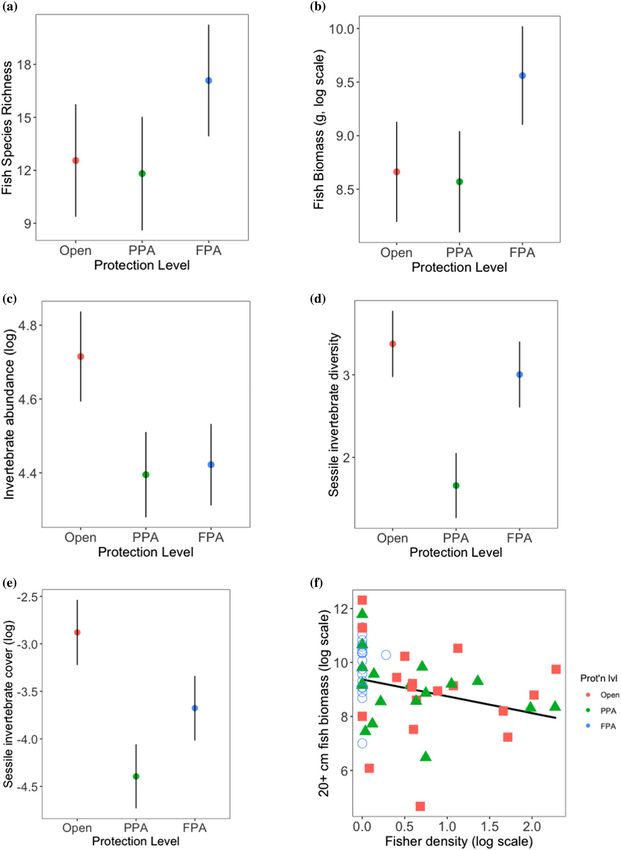
Turnbull et al.                                                                                                                923

declining emphasis on FPAs (Costello & Ballantine 2015).            permitted but not others, so they may be more diffi-
Furthermore, recent studies of both terrestrial and ma-             cult to understand, comply with, and enforce (Roberts
rine protected areas report an increasing trend toward              et al. 2020). Given these complexities and compromises,
downgrading, downsizing, and degazetting protected                  work is needed to reveal the value and effectiveness of
areas (PADDD), particularly in the last two decades                 PPAs as a conservation measure in the social–ecological
(Ritchie et al. 2013; Kroner et al. 2019).                          system.
   Despite the seeming popularity of PPAs among deci-                  We investigated the marine ecological and human
sion makers, their effectiveness is variable and a subject          communities of MPAs along the Great Southern Reef,
of debate (e.g., Costello & Ballantine 2015; Edgar 2017;            which spans 5 states along the southern half of the
Gill et al. 2017). One meta-analysis shows no significant           Australian continent (Bennett et al. 2016). As is the case
ecological effects of PPAs, although nonsignificant posi-           globally (Sala & Giakoumi 2017), the primary stated
tive effects were detected (Lester & Halpern 2008). An-             purpose of MPAs in all five states is broadly ecological:
other meta-analysis (Sciberras et al. 2015) shows some              the conservation and protection of biological diversity
ecological benefits of PPAs over open areas, but only for           and ecological processes (Appendix S1). Secondary
fishing-targeted species, and benefits were significantly           purposes are largely social; they include the sustainable
less in PPAs than FPAs. A third meta-analysis shows vary-           use of natural resources, cultural values including enjoy-
ing degrees of ecological effectiveness, depending on the           ment, appreciation, learning, research, and indigenous
level of partial protection (Zupan et al. 2018a), although          uses (Appendix S1). Support for Australia’s MPAs is
many of the studies within this analysis considered only a          high, including among people who fish (Martin et al.
narrow set of response parameters, such as one or a few             2016; Navarro et al. 2018), yet the complex factors
target species rather than overall community biodiversity           that motivate support, compliance, understanding (and
or biomass. Many PPAs have been in place for decades                misunderstanding), and the social and ecological values
and have had no ecological benefit relative to FPAs and             of these MPAs warrant further investigation (Clark &
limited to no benefits relative to open areas (e.g., Turn-          Johnston 2017; Davies et al. 2018).
bull et al. 2018; Sala et al. 2018). It is clear that further re-      We assessed both the social and ecological attributes
search on the effectiveness of PPAs is needed to improve            of open areas, PPAs, and FPAs in roughly equal propor-
conservation outcomes (Edgar 2017).                                 tion. Our goal was to determine how PPAs and FPAs are
   Partially protected areas also appear to offer little or no      used, understood, and perceived compared to open ar-
financial cost advantage over FPAs. A worldwide study               eas, and how protection relates to the ecological status
(Balmford et al. 2004) shows that FPAs are slightly more            of their broad fish, invertebrate, and algal communities.
costly per unit area than PPAs, but the level of protection
is not an important predictor of MPA cost compared with
other factors. A subsequent study modeling the protec-              Methods
tion of Australia’s Coral Sea shows that a large MPA with
a blend of partial and full protection is more costly than          Our research took place over 56 sites spanning 7000 km
a simpler FPA (Ban et al. 2011).                                    of coastline along Australia’s Great Southern Reef (Fig. 1).
   Social factors are also key considerations in the                Our sites were distributed among 5 Australian States (ju-
effectiveness of MPAs, including stakeholder engage-                risdictions) with roughly even distribution across protec-
ment, leadership, and management (Ballantine 2014), yet             tion levels; 19 sites were FPAs, 18 sites were PPAs, and 19
social–ecological studies of MPAs are rare (Hargreaves-             sites were open areas (outside MPAs). Partially protected
Allen et al. 2017; Davies et al. 2018; Brueckner-Irwin              areas were all open to fishing at 3 levels of regulation;
et al. 2019). Partially protected areas may be warranted            7 were highly protected, 7 were moderately protected,
for socioeconomic or political reasons (Sciberras et al.            and 4 were very weakly protected (Appendix S4) (Horta
2015), and this inherently entails a trade-off between              e Costa et al. 2016). Our study covered 20 MPAs, ranging
political, social, and ecological goals (Sala & Giakoumi            in protection level from IUCN Ia to VI, with an average
2017; Davies et al. 2018). Partially protected areas may            age of 20 years (SD 10.9) and an average size of 280 km2
improve some social values because they allow more                  (SD 725) (Appendix S3). Open areas were selected for
recreational activities than FPAs, yet they compromise              comparison based on the range of exposures, substrate
on values that depend on biodiversity and abundance                 (rocky reef, and beach), and development levels where
(e.g., observing wildlife). Although protected areas may            possible (Appendix S4).
be valued and even informally enforced by the local com-               Because the goals of MPAs are both ecological and so-
munity, potentially improving their ecological effective-           cial, we used mixed methods. We conducted 190 struc-
ness (Rife et al. 2013; Turnbull et al. 2018; Brueckner-            tured observation social surveys and 439 semistructured
Irwin et al. 2019), it is unclear whether this applies in           interviews to gather data on human usage, perceptions,
PPAs. Partially protected areas have more complex regu-             and values and analyzed data on 625 underwater vi-
lations than FPAs because some extraction activities are            sual census Reef Life Surveys to draw conclusions on

                                                                                                              Conservation Biology
                                                                                                              Volume 35, No. 3, 2021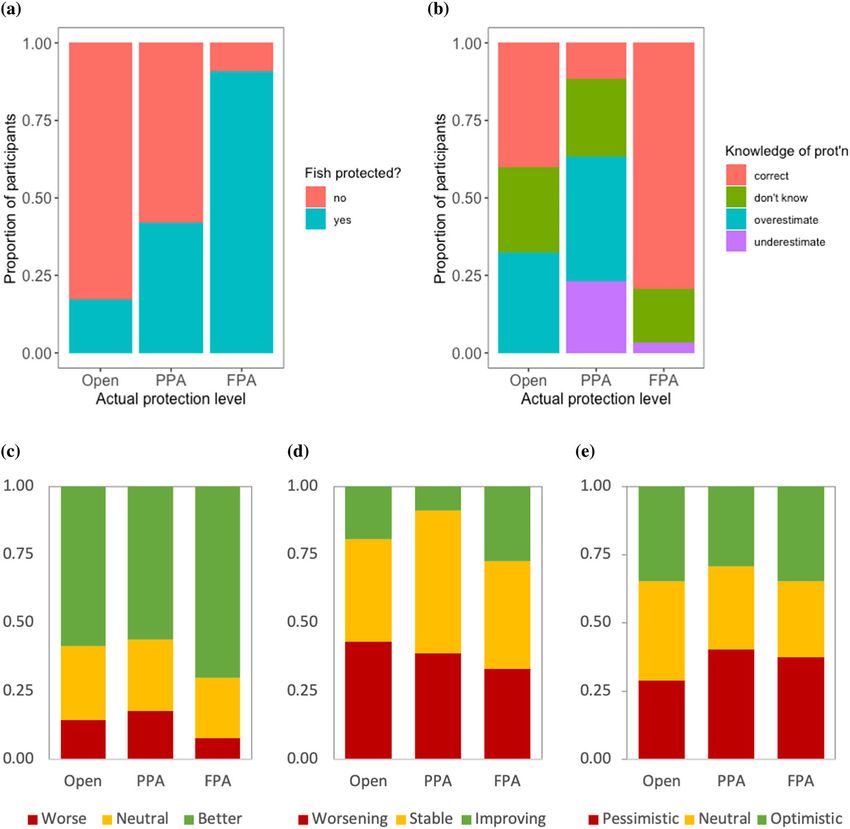
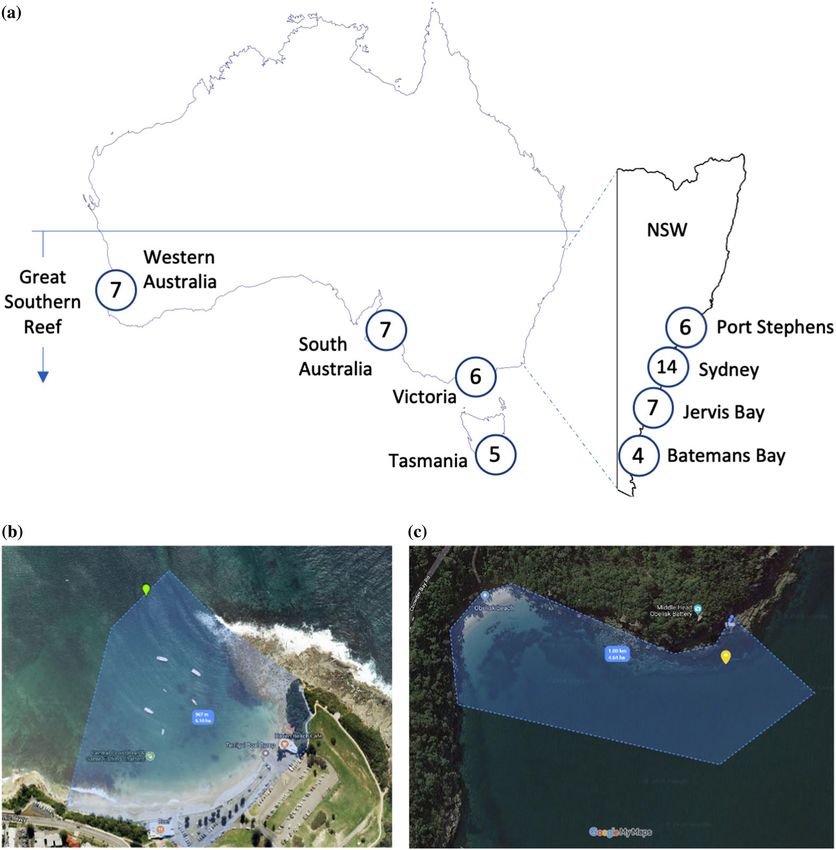
924                                                                                                             Protected Areas

Figure 1. (a) Location of study sites around Australia’s Great Southern Reef (numbers, number of sites surveyed
in each region), (b) study area at Terrigal Haven (developed site), and (c) study area at Middle Head
(undeveloped site) (pins, Reef Life Survey locations).

marine communities (RLS 2016). In the social aspects           logical variables, and qualitative data analysis to examine
of our study, we followed grounded theory, identifying         human factors in more detail.
and developing concepts via structured analysis and in-           We followed human ethical guidelines of the Univer-
ductive reasoning over the course of our study (Glaser         sity of New South Wales under permit HC180044. For a
et al. 1968). We used purposive sampling to achieve a          full description of our methods, see Appendix S2.
representative sample of coastal users and proceeded to
the point of theoretical saturation, which was achieved at
participant 358 out of 439 (Bryman 2016). Qualitative so-      Results
cial data were coded both in situ (e.g., self-identification
as local) and later in vivo (e.g., initial and thematic cod-   The PPAs were no better than open areas for any of our
ing of motivations and values). Survey guides are in Ap-       measured social or ecological factors based on the stated
pendix S2).                                                    goals of the MPAs in our study. The FPAs had signifi-
   Species richness, abundance (density), and biomass          cantly more fish richness and biomass and greater hu-
were selected as our ecological indicators because they        man understanding of their purpose than open areas.
represent the broad goals of MPAs and are used in similar      They also were more positively perceived and assigned
studies (e.g., Lester & Halpern 2008; Edgar et al. 2014).      higher value than open areas (Fig. 2). Significance and
We used both multivariate and univariate methods to an-        effect sizes for all results relating to partial and FPAs are
alyze relationships between and among social and eco-          in Appendix S7.

Conservation Biology
Volume 35, No. 3, 2021
Turnbull et al.                                                                                                       925

Figure 2. Summary of results of multivariate and univariate analysis for partially protected areas (PPAs) and
fully protected areas (FPAs) compared with open areas (blank cell, no significant difference between protected and
open areas; up arrow, positive significant relationship [e.g., more fish diversity and biomass]; down arrow,
negative significant relationship; left and right arrow combined, significantly different community with more of
some users and fewer of others; CATAMI, Collaborative and Automated Tools for Analysis of Marine Imagery
[Althaus et al. 2013]; p < 0.05, benchmark for significance based on permutational multivariate analysis of
variance for community results and mixed-effects linear regression for other results). The p-values and effect sizes
are in Appendix S7.

Social Surveys                                              perception of fish protection in open areas (pPPA = 0.006
                                                            and pFPA < 0.001). Belief that a participant was in an MPA
Of 56 sites, the busiest had a mean density of 31.9 peo-
                                                            (regardless of whether they were actually in an MPA)
ple/ha and the quietest had 0.13 people/ha (SD 5.02)
                                                            was also significantly related to the belief that fish were
(Appendix S4). Fully protected areas had 2.0 times as
                                                            protected (p < 0.001). Participants appeared to get cues
many SCUBA divers, 3.5 times as many snorkelers, almost
                                                            regarding fish protection from the presence of compli-
no people fishing, and 0.2 times as many people using
                                                            ance signage (p < 0.001) and the presence or absence of
watercraft (including boating) compared to open areas
                                                            people fishing (p < 0.001).
(p = 0.012) (Appendix S5). There was no significant
                                                               Most people in FPAs knew they were in one (79%),
difference between human usage communities in PPAs
                                                            contrasting with relatively few people correctly identify-
verses open areas (p = 0.837), including no difference in
                                                            ing that they were in a PPA (12%, p < 0.001) (Fig. 3b).
the density of people fishing (p = 0.305).
                                                            The remaining 88% in PPAs were split between those
   Almost half of participants who expressed a view of
                                                            who overestimated the level of protection (i.e., thought
protection in PPAs (42%) incorrectly believed that fish
                                                            they were in an FPA [40%]), those who underestimated
were protected at their site. Most participants in FPAs
                                                            the level of protection (i.e., thought they were in an
(91%) correctly perceived fish as protected (Fig. 3a).
                                                            open area [23%]), and those who responded with “don’t
Both of these results were significantly higher than the

                                                                                                     Conservation Biology
                                                                                                     Volume 35, No. 3, 2021
926 Protected Areas Figure 3. Perceptions of coastal users of protection and marine life by protection level (open, unprotected areas; PPA, partial protected areas; FPA, fully protected areas): (a) proportion of participants who expressed a view on fish protection at the site; (b) proportion of participants who correctly identified whether they were in a partial or full PA; (c) perceptions of how good the marine life is at a site compared with other sites in the region; (d) perceived changes in marine life over time; and (e) perceptions of what participants expect marine life at the site to be like 5 years in the future. Frequency distributions of responses over n = 439 participants know” (25%). The density of signage tended to increase is the need for freedom and recreation, particularly for the understanding of MPA status, but this relationship children. was not significant (p = 0.071). People in FPAs were significantly attracted to their Support for MPAs in which fishing was restricted was ecological values (p = 0.01) and the protection values high overall (92% support, 2% don’t support, and 6% neu- of the MPA (p = 0.009), whereas the factors attract- tral or unsure). Support among people who said they ing people to PPAs were not significantly different from fished at their site was similar (91% support, 1% don’t those in open areas (p = 0.64 and 0.14, respectively). support, and 8% neutral or unsure). People in FPAs were The most common ecological values attracting people to significantly more likely to support MPAs that restricted FPAs were more marine life, nature, biodiversity, natu- fishing (p = 0.015), primarily motivated by the need to ralness or pristineness, the ocean, and the environment. address overfishing and fishing pressure; conserve fish di- The most common protection or management values versity, abundance, and health; protect and preserve ma- were the presence of full protection, science or research rine life; enable recovery and restoration of fish stocks; value of protection, and avoiding user conflict due to and for ethical considerations (e.g., it is the right thing zoning. to do). Disagreement with MPAs centered on the be- The most frequently mentioned ecological value was liefs that existing rules—size and bag limits—were ad- the presence of fish, including abundance, richness, pro- equate and human pressures were low and that there tection, health, replenishment, catching, and concern Conservation Biology Volume 35, No. 3, 2021
Turnbull et al.                                                                                                          927

over declines. People were generally optimistic about         3.5 times more large (>20 cm) fish biomass in FPAs com-
the quality of marine life at their site (Fig. 3c) and per-   pared to open areas. Further analysis showed this could
ceived marine life to be better when there were more          be partly explained by fisher density (modeled separately
actual fish species (p < 0.001) and higher sessile (in-       because it was correlated with protection level), which
vertebrate and algal) diversity (p = 0.004). Wet users        had a significant negative relationship with fish biomass
(i.e., those with direct in-water experience of marine life   (p = 0.028) (Fig. 4f).
in its habitat such as swimmers, snorkelers, and divers)         Of the top 10 fish species that explained biomass dif-
perceived better marine life in FPAs compared to open         ferences, 7 (70%) were fished species that had higher
areas (p = 0.017), but no difference in marine life be-       biomass in FPAs than in open areas (Appendix S6). The
tween PPAs and open areas (p = 0.128). Signage did not        proportion of fished species in the top 10 explanatory
significantly influence people’s perceptions of marine        species was markedly higher than the proportion of
life.                                                         fished species in the overall data set (20%).
   Overall, people perceived stable or worsening marine          Our initial analysis showed significantly less mobile
life at their site through time (Fig. 3d). Least improve-     macroinvertebrate abundance (urchins, sea stars, shells,
ment was perceived in PPAs (although not significant),        etc.) in both FPAs and PPAs compared to open areas (p
whereas significantly more improvement was perceived          = 0.038 and 0.028, respectively), and this was due to
in FPAs by wet users (p = 0.017). Signage did not signifi-    low levels of barren-forming urchins (Centrostephanus
cantly affect these results. Perceived changes over time      rodgersii and Heliocidaris erythrogramma), which
were mostly founded on observing impacts or threats           were approximately half as abundant in MPAs compared
and changes in ecological values including fish, algae or     to open areas (Fig. 4c & Appendix S6). There was sig-
seagrass, marine mammals, birds, and crustaceans. The         nificantly less sessile invertebrate cover and diversity
main perceived threats were overfishing, pollution, over-     (sponges, soft corals, ascidians, etc.) in PPAs compared
population, development, erosion (often driven by cli-        to open areas (p = 0.003 for both) (Figs. 4d & 4e), but
mate change), and illegal fishing.                            no significant difference in sessile invertebrates between
   When asked to consider 5 years into the future, people     FPAs and open areas (Fig. 2 & Appendix S7). There was
were more optimistic than would be justified by history       no significant difference in algal cover or diversity among
(Figs. 3d & 3e), and there was no significant difference in   FPAs, PPAs, and open areas (Fig. 2 & Appendix S7)
optimism or pessimism between protection levels (pPPA
= 0.348 and pFPA = 0.710). Optimists spoke mostly of
management and stewardship, specifically caring for or
looking after a place, education of users, and the pres-      Discussion
ence of MPAs. Pessimists spoke mostly of threats into
the future, specifically human overpopulation, pollution,     Along the 7000 km coastline in our study, FPAs had more
fishing pressure, climate change, mismanagement, and          fish species and biomass, were better understood by peo-
reductions in protection (PADDD).                             ple, aligned better with the expectations of the pub-
   Many (27% of participants) reported observing non-         lic than PPAs, were more attractive to most users, and
compliance at their site; 10% reported seeing it once,        perceived to have better marine life than open areas.
12% sometimes, and 5% often. Observed noncompliance           Partially protected areas, despite being the most com-
did not vary significantly between MPAs and open              mon type of MPA (exceeding the area of FPAs by more
areas (pPPA = 0.908 and pFPA = 0.163), although almost        than 2:1 globally and 3:1 in Australia), were no better
one-third (30%) of all people in FPAs reported seeing         than open areas for any of our social or ecological in-
illegal fishing. Other forms of noncompliance included        dicators. Partially protected areas give the impression
illegally collecting invertebrates (observed by 4.6% of       of protection while consuming scarce conservation re-
people), keeping undersize fish (3.9%), exceeding bag         sources, so we argue that they are red herrings in marine
limits (3.4%), and illegal spearfishing (2.5%). Formal        conservation.
enforcement activity levels were low. During over 300            In popular culture, a red herring is a clue or piece
hours in the field, we observed enforcement activities        of information that is misleading or distracting (Oxford
on just 3 occasions: 2 in FPAs and 1 in a PPA.                University Press 2019). We regard PPAs as misleading for
                                                              several reasons. First, they create the illusion that fish
                                                              are effectively protected (Figure 3a). Partial protection is
Ecological Surveys
                                                              poorly understood; just 1 in 8 participants in PPAs (12%)
Fish species richness and biomass of all fish and large       knew they were in one, with 3 times as many people
(>20 cm) fish were higher in FPAs (p = 0.023, 0.023,          (40%) mistakenly believing they were in an FPA. People
and 0.05, respectively), and biomass was lower, but not       in our study appeared to assume or trust that the pres-
significantly so, in PPAs (Figs. 4a & 4b). There were 1.3     ence of an MPA has a positive ecological effect, yet in
times more fish species, 2.5 times more fish biomass, and     PPAs we could find no such effects.

                                                                                                        Conservation Biology
                                                                                                        Volume 35, No. 3, 2021
928 Protected Areas Figure 4. Comparison of open sites, partially protected areas (PPAs) and fully protected areas (FPAs) relative to significant factors: (a) species richness of all fish, (b) biomass of all fish, (c) abundance of mobile macroinvertebrates, (d and e) diversity and cover of sessile invertebrates based on CATAMI classification (Collaborative and Automated Tools for Analysis of Marine Imagery [Althaus et al. 2013]), and (f) significant negative relationship between fisher density and large fish biomass (regression line from mixed-effect model; bars, SE). We regard PPAs as a distraction primarily due to their advantage over FPAs. In a world of limited conservation opportunity costs. MPAs are financially costly in terms budgets, spending money with at best questionable or, of design, planning, management, and enforcement re- in the case of our study, no detectable ecological or so- sources (Rife et al. 2013), and PPAs offer no clear cost cial benefit represents a waste of resources that could be Conservation Biology Volume 35, No. 3, 2021
Turnbull et al.                                                                                                            929

assigned to more effective protection. Partially protected      that despite some fishing activities being prohibited in
areas also have a spatial opportunity cost. Any given ju-       PPAs, they show no significant improvement in any of
risdiction, such as state or commonwealth waters, is of fi-     our broad ecological indicators (Fig. 2).
nite area and so consuming an area with PPAs effectively           Partially protected areas may appear to be an attrac-
prevents the implementation of real protection in those         tive compromise because they allow large areas of ocean
same areas. This would not be the case if PPAs were seen        to be declared protected while allowing the public to
as stepping stones toward FPAs; however, the extensive          continue enjoying a range of extractive pursuits. This,
and growing PADDD phenomenon indicates that this is             however, represents another form of conservation red
not the case in many jurisdictions (Kroner et al. 2019).        herring. Marine protected areas work by removing or
   The misleading and diversionary nature of PPAs in our        significantly reducing human pressures—mostly fishing
study is perpetuated at an institutional or policy level by     pressure—from an area (Edgar et al. 2017). This is sup-
their inclusion in a commonly used conservation perfor-         ported by our finding of the significant negative relation-
mance indicator—percentage of jurisdiction under pro-           ship between fish biomass and fisher density (Fig. 4f) and
tection. Australia reports 36% of waters in MPAs (Parks         the proportion of fished species explaining significant
Australia 2020), yet three-quarters of this protected area      biomass differences (Appendix S6). Failure to remove
appear to have little or no social or ecological function, at   this pressure, by declaring an area as protected with-
least in the Great Southern Reef. In effect, these are the      out substantially reducing or eliminating fishing, must
very paper parks that other researchers caution against         therefore result in ineffective protection (Fig. 2 & Ap-
(Rife et al. 2013; Costello & Ballantine 2015); yet, they       pendix S4) (Zupan et al. 2018b). Ironically, the failure
are perceived as contributing to Australia’s marine con-        of PPAs to deliver ecological outcomes appears to lead
servation goals (Appendix S1).                                  to the failure of the desired social outcomes. More sus-
   We do not contend that PPAs cannot be effective in all       tainable social use of resources, scientific research, edu-
circumstances. Partially protected areas may play a role        cation, appreciation, and enjoyment largely rely on MPAs
as part of a wider management framework, for exam-              performing their ecological functions in order to distin-
ple, when placed adjacent to FPAs (Zupan et al. 2018a;          guish them from open areas and to justify the cost of
Kelleher 1999). Partially protected areas that explicitly       protection.
target social outcomes, such as enabling traditional fish-         The desire to achieve a combination of political, so-
ing practices, or narrow ecological outcomes, such as           cial, and ecological goals may be driving the prolifera-
protection of certain species or critical habitat, may suc-     tion of PPAs (Sciberras et al. 2015), but it has been ar-
ceed in achieving these goals (Cinner et al. 2020). It          gued that such considerations should not take priority
is noteworthy, however, that the PPAs in our study do           over ecological effectiveness (Boonzaier & Pauly 2016).
not explicitly limit themselves to such specific goals.         Most of the PPAs in our study allow commercial fishing,
Partially protected areas may also favor one stakeholder        even though industrial-level extraction of resources is in-
group over another, for example, protected areas that           compatible with MPAs (Day et al. 2019) (Appendix S3).
ban only commercial fishing may benefit recreational            Commercial fishing in MPAs is widespread in other juris-
fishers. However, such redistributions of social benefit        dictions (Horta e Costa et al. 2016; Sala et al. 2018), for
appear to occur with no overall improvement in broad            example, in the majority of Canadian MPAs (Robb et al.
ecological goals, such as biodiversity or biomass, in our       2011). One recent study of MPAs in the Mediterranean
study.                                                          Sea shows that 95% of the area under protection lacks
   Misconceptions about the effectiveness of PPAs may           adequate regulations to conserve biodiversity and ocean
be perpetuated by results of studies referenced as evi-         health (Claudet et al. 2020). With increasing global pres-
dence of effectiveness that are based on assessment cri-        sure to protect more of our oceans, driven in part by the
teria that are narrower than the overall goals of MPAs          World Conservation Congress goal of 30% of the oceans
(Edgar 2011). Marine protected areas generally aim to           free from extractive activities by 2030, such anomalies
achieve broad, ecosystem-wide outcomes (Edgar 2011;             must be addressed if real conservation outcomes are to
Sala & Giakoumi 2017) (Appendix S1), yet prior studies          be achieved (Sala et al. 2018).
draw conclusions on the basis of 1 or a few species or             We detected more fish and fewer urchins in FPAs, pos-
subsets, such as only species targeted by fishers (Zupan        sibly due to trophic cascade effects, as found in other
et al. 2018a; Sciberras et al. 2015). Partially protected       studies (Edgar et al. 2017). Our finding of fewer inver-
areas that allow one fishing gear yet ban another may           tebrates, but not more fish, in PPAs may be the result of
shift fishing pressure between fished areas and toward          small increases in fish numbers that were undetectable in
people who use the allowed gear and who are attracted           our analyses yet sufficient to affect invertebrate commu-
to the reduced competition over space and fish (Zupan           nities. This result may also be an artifact of the selective
et al. 2018b; Lester & Halpern 2008). Partially protected       placement of MPAs, which may be located to achieve
areas may therefore merely trade 1 or more species or           coverage of certain ecological features, such as habitat
pressure for another. This is supported by our finding          (Kelleher 1999). We were unable to separate such effects

                                                                                                          Conservation Biology
                                                                                                          Volume 35, No. 3, 2021
930 Protected Areas in our results due to the lack of pre-MPA establishment nage may improve awareness and understanding of PPAs, baseline data. although this may be countered by their higher levels Our finding that coastal users broadly support MPAs of regulation complexity relative to FPAs (Appendix S4). that restrict fishing (92% of participants), with similar High stewardship individuals (“uber stewards”) may im- support among people who fish (91%), is generally in prove awareness, and possibly therefore the effective- keeping with the results of other studies (Martin et al. ness of signage, through informal enforcement and ed- 2016; Navarro et al. 2018; McNeill et al. 2019). Even ucation, particularly through their extended social net- though McNeill et al. (2019) focused on the opposition works (Turnbull et al. 2020). Further research is war- of specialized fishers to FPAs, this opposition is reported ranted regarding the relationship among signage, stew- by a minority, with the majority of fishers (around 75%) ardship, and awareness of regulations. in support of FPAs and over 50% strongly in favor of Marine protected area effectiveness is driven in part them. We found even higher levels of support, possibly by compliance and enforcement (Rife et al. 2013). Even due to our sampling, which included a broad sample of though we recorded observed enforcement events in our all coastal users and did not target specific user segments, surveys, these events were not frequent enough to gen- such as people at boat ramps (Navarro et al. 2018), nor erate significant results. Recent studies, however, report rely on internet surveys that cannot be considered repre- very high levels of poaching in 1 FPA and the resulting sentative (McNeill et al. 2019). Almost three-quarters of need for higher prioritization of enforcement resources people who fish also undertake other activities, such as (Harasti et al. 2019). We directly observed noncompli- swimming and snorkeling, and this may explain the neg- ance events, such as fishing in FPAs on 7% of our site ligible difference in support among all users and people surveys, and 30% of participants reported seeing such who fish in our study. events at some time. This indicates that MPA perfor- Furthermore, our questions explicitly tested the pri- mance may be improved by allocating more resources mary human-use distinction between PPAs and FPAs to enforcement and prioritizing resources between PPAs along the Great Southern Reef—the former allow fish- and FPAs in such a way as to maximize conservation ing, whereas the latter restrict it—rather than using po- outcomes. tentially confusing, jurisdiction-specific language such as The broad geographic and social–ecological scope of sanctuary or no take. We believe that because MPAs are our study necessitated a focus on key factors that we se- generally implemented for the benefit of all users rather lected based on the stated goals of MPAs. Other social than specific interest groups in our study (Appendix S1), factors, such as impact on livelihoods, satisfaction with our research is an accurate reflection of the values and MPAs, and equity of access, warrant further investiga- support of stakeholder communities that are affected by tion, as do other contexts, such as geographies and differ- and benefit from MPAs. ent levels of economic development. Partially protected We found people were often knowledgeable about ma- areas may for example confer fisheries benefits (Zupan rine life. Their perceptions of the relative quality of ma- et al. 2018a, Cinner et al. 2020), and may be effective rine life were significantly related to actual fish species in traditional management settings (McClanahan et al. richness and sessile (invertebrate and algal) diversity. 2006) but these were beyond the scope of our study. This indicates coastal users have the ability to evalu- We conclude that although FPAs in our study had more ate and report conditions of marine life. In-water users fish and were generally well understood and valued com- (snorkelers, divers, and swimmers) also accurately re- pared with open areas, PPAs were not. PPAs along the ported better marine life in FPAs compared to other areas Great Southern Reef did not generally achieve their broad and observed positive changes over time that were not social or ecological purposes yet they gave the illusion observed in PPAs. It appears that people’s perceptions of protection and consumed scarce financial and spatial can be a useful indicator of what is happening to marine resources, acting as red herrings in marine conservation. life in an area, particularly if they experience marine life Although some PPAs in other jurisdictions may reduce directly (Uyarra et al. 2009). Reinforcing this, we found fishing pressure enough to provide ecological benefit, knowledge of marine life was significantly higher in lo- our results indicated there were large areas of coastline cals, those with longer experience with the site, those and multiple jurisdictions where this was not the case. who came to the site explicitly for its marine life, and We believe that if PPAs are to continue to be used to those who snorkeled, scuba dived, and line and spear a large extent around the world, rigorous performance fished. monitoring is required in order to ensure they are pro- Signage played a significant role in the perception of viding adequate conservation return on investment and whether fish were protected and appeared to influence are meeting the expectations of stakeholders. We recom- understanding of MPA status (although the latter was not mend that further integrated research be conducted to significant). Although 4 PPAs had no compliance signage examine the social and ecological effectiveness of PPAs at all, only 1 FPA lacked compliance signage (Appendix in other jurisdictions, and managers and decision mak- S4). We would expect that more compliance-related sig- ers should now move to reverse PADDD and implement Conservation Biology Volume 35, No. 3, 2021
Turnbull et al.                                                                                                                                  931

strategies to upgrade protected areas toward full protec-                  Clark G, Johnston E. 2017. Australia state of the environment 2016:
tion in order for MPAs to meet their intended purpose                          coasts, independent. Australian Government Minister for Environ-
                                                                               ment and Energy, Canberra, Australia.
and justify conservation investment.
                                                                           Clarke K, Gorley R. 2006. PRIMER v6: user manual/tutorial (Plymouth
                                                                               routines in multivariate ecological research). Primer-E, Plymouth,
                                                                               United Kingdom.
Acknowledgments                                                            Claudet J, Loiseau C, Sostres M, Zupan M. 2020. Underprotected ma-
                                                                               rine protected areas in a global biodiversity hotspot. One Earth
We thank all the people who gave their time to partici-                        2:380–384.
pate in our study and the anonymous reviewers for their                    Costello MJ, Ballantine B. 2015. Biodiversity conservation should focus
                                                                               on no-take Marine Reserves: 94% of Marine Protected Areas allow
constructive contribution. This research was supported
                                                                               fishing. Trends in Ecology & Evolution 30:507–509.
by the University of New South Wales and an Australian                     Davies TE, et al. 2018. Assessing trade-offs in large marine protected
Government Research Training Program (RTP) Scholar-                            areas. PLOS ONE 13 (e0195760) https://doi.org/10.1371/journal.
ship.                                                                          pone.0195760.
                                                                           Day J, Dudley N, Hockings M, Holmes G, Laffoley DdA, Stolton S, Wells
                                                                               SM. 2012. Guidelines for applying the IUCN protected area manage-
Supporting Information                                                         ment categories to marine protected areas. IUCN, Gland, Switzer-
                                                                               land.
                                                                           Day J, Dudley N, Hockings M, Holmes G, Laffoley D, Stolton S, Wells S,
Additional information is available online in the Support-                     Wenzel L. 2019. Guidelines for applying the IUCN protected area
ing Information section at the end of the online article.                      management categories to marine protected areas. 2nd Ed. IUCN,
The authors are solely responsible for the content and                         Gland, Switzerland.
functionality of these materials. Queries (other than ab-                  Department Primary Industries. 2019. Marine protected areas. Depart-
                                                                               ment of Primary Industries, Orange, Australia. Available from https:
sence of the material) should be directed to the corre-                        //www.dpi.nsw.gov.au/fishing/habitat/protecting-habitats/mpa (ac-
sponding author.                                                               cessed January 2020).
                                                                           Edgar GJ. 2011. Does the global network of marine protected areas
                                                                               provide an adequate safety net for marine biodiversity? Aquatic Con-
                                                                               servation: Marine and Freshwater Ecosystems 21:313–316.
Literature Cited
                                                                           Edgar GJ. 2017. Marine protected areas need accountability not wasted
Althaus F, Hill N, Edwards L, Ferrari R, Case M, Colquhoun J. 2013.            dollars. Aquatic Conservation 27:4–9.
    CATAMI classification scheme for scoring marine biota and sub-         Edgar GJ, Stuart-Smith RD, Thomson RJ, Freeman DJ. 2017. Consis-
    strata in underwater imagery–a pictorial guide to the collabo-             tent multi-level trophic effects of marine reserve protection across
    rative and annotation tools for analysis of marine imagery and             northern New Zealand. PLOS ONE 12 (e0177216) https://doi.org/
    video (CATAMI) classification scheme. Version 1. CATAMI Techni-            10.1371/journal.pone.0177216.
    cal Working Group. Available from http://catami.org/classification.    Edgar GJ, et al. 2014. Global conservation outcomes depend on
    Accessed January 2020.                                                     marine protected areas with five key features. Nature 506:216-
Anderson M, Gorley RN, Clarke RK. 2008. PERMANOVA+ for primer:                 220.
    guide to software and statistical methods. Primer-E, Plymouth,         Froese R, Pauly D. 2017. FishBase. Version 06/2017. Available from
    United Kingdom.                                                            www.fishbase.org.
Ballantine B. 2014. Fifty years on: lessons from marine reserves in New    Gill DA, et al. 2017. Capacity shortfalls hinder the performance of ma-
    Zealand and principles for a worldwide network. Biological Conser-         rine protected areas globally. Nature 543:665–669.
    vation 176:297–307.                                                    Glaser BG, Strauss AL, Strutzel E. 1968. The discovery of grounded the-
Balmford A, Gravestock P, Hockley N, McClean CJ, Roberts CM. 2004.             ory; strategies for qualitative research. Nursing Research 17,364–
    The worldwide costs of marine protected areas. Proceedings of the          368.
    National Academy of Sciences 101:9694–9697.                            Grech A, Edgar G, Fairweather P, Pressey R, Ward T. 2014. Australian
Ban NC, Adams V, Pressey RL, Hicks J. 2011. Promise and problems for           marine protected areas. Pages 582–599 in Stow A, Maclean N, Hol-
    estimating management costs of marine protected areas. Conserva-           well GI, editors. Austral ark: the state of wildlife in Australia and
    tion Letters 4:241–252.                                                    New Zealand. Cambridge University Press, Cambridge, United King-
Beijbom O, Edmunds PJ, Kline DI, Mitchell BG, Kriegman D. 2012.                dom.
    Automated annotation of coral reef survey images. IEEE Conference      Halpern BS, et al. 2015. Spatial and temporal changes in cumula-
    on Computer Vision and Pattern Recognition. https://doi.org/10.            tive human impacts on the world’s ocean. Nature Communications
    1109/CVPR.2012.6247798.                                                    6:1–7.
Bennett S, Wernberg T, Connell SD, Hobday AJ, Johnson CR, Poloczan-        Hargreaves-Allen VA, Mourato S, Milner-Gulland EJ. 2017. Drivers of
    ska ES. 2016. The ‘Great Southern Reef’: social, ecological and eco-       coral reef marine protected area performance. PLOS ONE 12
    nomic value of Australia’s neglected kelp forests. Marine and Fresh-       (e0179394) https://doi.org/10.1371/journal.pone.0179394.
    water Research 67:47–56.                                               Harasti D, Davis TR, Jordan A, Erskine L, Moltschaniwskyj N. 2019. Ille-
Boonzaier L, Pauly D. 2016. Marine protection targets: an updated as-          gal recreational fishing causes a decline in a fishery targeted species
    sessment of global progress. Oryx 50:27–35.                                (Snapper: Chrysophrys auratus) within a remote no-take marine
Brueckner-Irwin I, Armitage D, Courtenay S. 2019. Applying a social-           protected area. PLOS ONE 14 (e0209926) https://doi.org/10.1371/
    ecological well-being approach to enhance opportunities for ma-            journal.pone.0209926.
    rine protected area governance. Ecology and Society 24:7.              Horta e Costa B, Claudet J, Franco G, Erzini K, Caro A, Gonçalves EJ.
Bryman A. 2016. Social research methods. Oxford University Press, Ox-          2016. A regulation-based classification system for Marine Protected
    ford, United Kingdom.                                                      Areas (MPAs). Marine Policy 72:192–198.
Cinner, JE, et al. 2020. Meeting fisheries, ecosystem function, and bio-   IUCN (International Union for Conservation of Nature) WCPA (World
    diversity goals in a human-dominated world. Science 368:301–311.           Commission on Protected Areas). 2018. Applying IUCN’s global

                                                                                                                                Conservation Biology
                                                                                                                                Volume 35, No. 3, 2021
932 Protected Areas
conservation standards to marine protected areas (MPA). Version Robb CK, Bodtker KM, Wright K, Lash J. 2011. Commercial fisheries
1.0. IUCN, Gland, Switzerland. closures in marine protected areas on Canada’s Pacific coast: the
Kelleher G. 1999. Guidelines for marine protected areas. International exception, not the rule. Marine Policy 35:309–316.
Union for Conservation of Nature, Gland, Switzerland. Roberts KE, Hill O, Cook CN. 2020. Evaluating perceptions of marine
Kroner REG, et al. 2019. The uncertain future of protected lands and protection in Australia: does policy match public expectation? Ma-
waters. Science 364:881–886. rine Policy 112:103766.
Lester SE, Halpern BS. 2008. Biological responses in marine no-take Sala E, Giakoumi S. 2017. No-take marine reserves are the most effec-
reserves versus partially protected areas. Marine Ecology Progress tive protected areas in the ocean. ICES Journal of Marine Science
Series 367:49–56. 75,1166–1168.
Martin CL, Momtaz S, Jordan A, Moltschaniwskyj NA. 2016. Exploring Sala E, Lubchenco J, Grorud-Colvert K, Novelli C, Roberts C, Sumaila
recreational fishers’ perceptions, attitudes, and support towards a UR. 2018. Assessing real progress towards effective ocean protec-
multiple-use marine protected area six years after implementation. tion. Marine Policy 91:11–13.
Marine Policy 73:138–145. Sciberras M, Jenkins SR, Mant R, Kaiser MJ, Hawkins SJ, Pullin AS. 2015.
McClanahan TR, Marnane M, Cinner JE, Kiene W. 2006. A comparison Evaluating the relative conservation value of fully and partially pro-
of marine protected areas and alternative approaches to coral reef tected marine areas. Fish and Fisheries 16:58–77.
conservation. Current Biology 16:1408–1413. Turnbull JW, Esmaeili YS, Clark GF, Figueira WF, Johnston EL, Ferrari R.
McNeill A, Clifton J, Harvey ES. 2019. Specialised recreational fishers 2018. Key drivers of effectiveness in small marine protected areas.
reject sanctuary zones and favour fisheries management. Marine Biodiversity and Conservation 27:2217–2242.
Policy 107:103592. Turnbull JW, Johnston EL, Kajlich L, Clark GF. 2020. Quantifying local
MPAtlas.org. 2016. MPAtlas. MAPAtlas.org, Seattle. Available from coastal stewardship reveals motivations, models and engagement
http://www.mpatlas.org/explore (accessed April 2020). strategies. Biological Conservation 249:108714.
Navarro M, Kragt ME, Hailu A, Langlois TJ. 2018. Recreational fishers’ UNEP (UN Environment Programme)-WCMC (World Conservation
support for no-take marine reserves is high and increases with re- Monitoring) and IUCN (International Union for Conservation of Na-
serve age. Marine Policy 96:44–52. ture). 2020. Marine protected planet. UNEP-WCMC, Cambridge,
Oxford University Press. 2019. Oxford English dictionary. Ox- United Kingdom, and IUCN, Gland, Switzerland. Available from
ford University Press, Oxford, United Kingdom. Available from www.protectedplanet.net (accessed April 2020).
https://www.lexico.com/definition/red_herring (accessed March Uyarra MC, Watkinson AR, Cote IM. 2009. Managing dive tourism for
2020). the sustainable use of coral reefs: validating diver perceptions of
Parks Australia. 2020. Australian marine parks. Parks Australia, attractive site features. Environmental Management 43:1–16.
Canberra, Australia. Available from https://parksaustralia.gov.au/ Victorian National Parks Association. 2016. Victoria’s marine parks and
marine/parks/ (accessed August 2020). sanctuaries. Victorian National Parks Association, Melbourne, Aus-
PRIMER-E, L. 2012. PRIMER-E. Version 6.1.15. Primer-E, Plymouth, tralia. Available from http://vnpa.org.au/wp-content/uploads/2017/
United Kingdom. 02/Pr-M-Fact-sheet-Marine-national-parks.pdf.
QSR. 2018. nVivo. Version 12.1.0.249 pro edition. QSR International, Ward T. 2011. Marine environment: the jurisdictions. Aus-
Melbourne, Australia. tralian Government, Canberra, Australia. Available https://soe.
R Core Team. 2018. R: a language and environment for statistical com- environment.gov.au/science/soe/2011-report/6-marine/1-
puting. R Foundation for Statistical Computing, Vienna. introduction/1-1-the-jurisdictions (accessed January 2020).
Rife AN, Erisman B, Sanchez A, Aburto-Oropeza O. 2013. When Wescott G, Fitzsimons J. 2016. Big, bold and blue: lessons from Aus-
good intentions are not enough… Insights on networks of “pa- tralia’s marine protected areas. CSIRO PUBLISHING, Melbourne,
per park” marine protected areas. Conservation Letters 6:200– Australia.
212. Western Australian Auditor General. 2016. Management of marine
Ritchie EG, et al. 2013. Continental-scale governance and the hastening parks and reserves. Western Australian Auditor General, Perth, Aus-
of loss of Australia’s biodiversity. Conservation Biology 27:1133– tralia.
1135. Zupan M, Fragkopoulou E, Claudet J, Erzini K, Horta e Costa B,
Reef Life Survey (RLS). 2016. Standardised survey procedures for Gonçalves EJ. 2018a. Marine partially protected areas: drivers of
monitoring rocky and coral reef ecological communities. RLS, ecological effectiveness. Frontiers in Ecology and the Environment
Hobart, Australia. Available from http://reeflifesurvey.com/wp- 16:381–387.
content/uploads/2015/07/NEW-Methods-Manual_150815.pdf (ac- Zupan M, et al. 2018b. How good is your marine protected area at
cessed January 2020). curbing threats? Biological Conservation 221:237-245.
Conservation Biology
Volume 35, No. 3, 2021You can also read