Experimental and Density Functional Theory Characteristics of Ibrutinib, a Bruton's Kinase Inhibitor Approved for Leukemia Treatment
←
→
Page content transcription
If your browser does not render page correctly, please read the page content below
Hindawi
Journal of Spectroscopy
Volume 2021, Article ID 9968797, 8 pages
https://doi.org/10.1155/2021/9968797

Research Article
Experimental and Density Functional Theory Characteristics of
Ibrutinib, a Bruton’s Kinase Inhibitor Approved for
Leukemia Treatment

          Ali I. Ismail
          Department of Chemistry, Rabigh College of Science and Arts, King Abdulaziz University, Jeddah, Saudi Arabia

          Correspondence should be addressed to Ali I. Ismail; aeyesmaeel@kau.edu.sa

          Received 21 March 2021; Revised 1 May 2021; Accepted 8 May 2021; Published 15 May 2021

          Academic Editor: Vincenza Crupi

          Copyright © 2021 Ali I. Ismail. This is an open access article distributed under the Creative Commons Attribution License, which
          permits unrestricted use, distribution, and reproduction in any medium, provided the original work is properly cited.
          Ibrutinib, a Bruton’s tyrosine kinase that plays an essential role in the B-cell development and cancer cells, has been recently
          approved to treat chronic, lymphocytic, and other types of leukemia. This study focused on investigating ibrutinib by its electronic
          transitions, vibrational frequencies, and electrospray mass spectra. The experimental peaks for electronic spectrum were found at
          248.0 and 281.0 nm, whereas the ]C � 0 stretching frequency was found at 1652.4 and 1639.19 cm−1. These experimental properties
          were compared with the corresponding theoretical calculations in which density functional theory was applied. The optimized
          structure was obtained with the calculations using a hybrid function (B3LYP) and high-level basis sets [6-311G++(d,p)]. Most of
          the calculated vibrational frequencies showed a relatively good agreement with the experimental ones. The electronic transitions of
          ibrutinib calculated using time-dependent DFT method were performed at two different solvation methods: PCM and SMD. The
          mass spectrum of ibrutinib, its fragments, and its isotopic pattern agreed well with the expected spectra.

1. Introduction                                                          [17]. Several studies had been conducted on finding these
                                                                         irreversible inhibitors, which carry based on the structural
The current knowledge in biology and chemistry improved                  bioinformatics approach [5, 6]. It is believed that kinase
our understanding of cancer treatments. For example, most                inhibitors dominate more than 30% of the drug-discovery
cancer types express some specific dysregulated molecules                 industry [18, 19].
called tumor-specific antigens that will play an important                    Ibrutinib (or PCI-32765) is the first BTK covalent ir-
role in the tumor development process. Bruton’s tyrosine                 reversible inhibitor approved by several health agencies to
kinase is an enzyme that is important in B-cell development              treat leukemia types. After extensive laboratory studies and
[1–3]. Inhibition of this enzyme is found to cure various                clinical experiments, the approval was decided, providing
types of diseases such as B-cell lineage cancerous, including            promising treatment results with IC50 � 0.5 nM [20–25].
mainly different types of leukemias common in adults.                     Although some chemical properties of ibrutinib had been
Although chemotherapy kills the BTK-lineage cells, it also               reported, most importantly, the crystal structure was sol-
kills other vital cells in the body. However, the recent dis-            vated in different media [26]. However, many other char-
covery of molecules specific to BTK enzyme inhibition                     acteristics are yet to be reported, such as structural,
energizes the kinase-inhibition field research [4–16].                    vibrational, and electronic properties.
     The covalent BTK inhibitors attract great attention be-                 The purpose of this work is to investigate ibrutinib by its
cause it irreversibly forms a covalent bond with cysteine base           UV-Vis, IR, and ESI-MS characteristics. These experimental
(noncatalytic Cys481) located at the edge of the ATP-                    properties were compared with the corresponding theo-
binding BTK which brings a transient inhibition, higher                  retical calculations using the DFT at the B3LYP level of
efficiency, and better specificity and duration of drug action              theory and 6-311G++(d,p) basis sets.
2 Journal of Spectroscopy
2. Materials and Methods that can be recognized in the spectrum are at 248.0 nm with a
molar absorptivity of 22889 L/mol.cm and at 281.0 nm with a
2.1. Materials and Reagents. Ibrutinib was purchased from molar absorptivity of 16004 L/mol.cm. From the relatively
BLD Pharmatech Ltd. with >98% purity (via MolPort.com). high molar absorptivity, one can conclude that these ab-
All other reagents and solvents were of spectroscopic grade sorptions are allowed spectroscopically.
and bought from Sigma Aldrich.
3.2. Experimental FT-IR Spectrum. The FT-IR spectrum of
2.2. Experimental Methods. Ibrutinib’s UV spectrum was ibrutinib is depicted in Figure 3. The spectrum shows several
measured using Perkin Elmer Lamda 35 UV-Vis spectro- noticeable peaks. N-H peaks appeared at 3470.06 cm−1 and
photometer at room temperature. Ibrutinib was dissolved 3436.95 cm−1. Aromatic and aliphatic C-H peaks are found
and diluted with methanol to a final concentration of between 3063.37 and 2885.62 cm−1. Strong peaks at
1x10⁻⁵ M. The absorption spectrum was recorded at the 1652.40 cm−1 and 1639.19 cm−1 can be assigned for the C�O
range of 200–800 nm with 0.5 nm slit size. FT-IR spectrum stretching frequency. The series of other peaks from 1613.07
was obtained from compact Alpha FT-IR spectrometer to 1520 cm−1 can be assigned for C�C and C�N stretching
(Bruker, Germany). The device has got multireflection ZnSe frequencies. Bending frequencies of HCN and HCH in
as attenuated total reflectance (ATR) and deuterated tri- addition to υCH, υCC, υOC, and υNC have their peaks
glycine sulfate (DTGS) as detector. The accuracy of the between 1483 and 600 cm−1. The strong and obvious peaks
instrument reaches as low as 0.01 cm−1 for wavenumber and are presented in Table 1 with the help of the assignments
0.1% for transmittance. Ibrutinib was mixed and ground from the theoretical calculations.
with KBr to make a homogeneous mixture diffused by
compression to get a transparent disk. Ibrutinib’s mass
3.3. ESI-MS Spectrum. The positive mode ESI spectrum of
spectra were measured using positive polarization electro-
1 µM ibrutinib in methanol solution is shown in Figure 4(a)
spray ionization coupled with Q-TOF II Bruker high-res-
with the principle peak at m/z � 441.2032. This peak cor-
olution mass spectrometry. The mass spectrum of different
responds to the protonated compound [ibrutinib + H]+ as
concentrations of ibrutinib in 95% V/V methanol : formic
expected from the methanol electrospray ionization. The
acid solution (the formic acid solution is 5%FA : 95%H2O)
peak accuracy is comparable with the estimated one
was measured using ESI-MS in the range of 10 nM and
(441.20390) using the high mass spectrometry. The com-
1.0 µM. The electrospray was set at a flow rate of 10 uL/min,
pound can be detected as low as 10 nM with [ibrutinib + H]+
the capillary tip is set to be at 6000 V voltage, and the
is the major peak having S/N ∼ 10. Figure 5 shows the
temperature is set at 200 C. The parameters such as collision
tandem mass spectrum of ibrutinib in which two main peaks
cell RF (400.0 VPP), the reflector (1700 V), the transfer time
are found at m/z � 304.1178 and m/z � 138.1123.
(28.0 μs), and prepulse storage time (15.0 μs) were found
critical in obtaining the best sensitivity measurements for
ibrutinib. The tandem mass spectrum (MS2) was determined 3.4. Structural Optimization. The structure of ibrutinib was
at a collision energy of 25 J. optimized using a high level of DFT theory with hybrid
functional B3LYP and 6-311G++(d,p) as basis sets and is
shown in Figure 1. The minimum energy of the optimized
2.3. Computational Methods. The structural properties of molecule was computed as −1446.4520836 HF
ibrutinib were determined using the density functional (−39359.9847812 eV). The molecule’s point group was de-
theory (DFT) with a hybrid function of B3LYP level of cided as C1 with a dipole moment of 4.237 Debye projected
theory and a high level of basis sets with two sets of diffuse from the carbon in the center of the molecule (C8) in-plane
and polarization functions [6-311G++(d,p)]. The calcula- tilted toward the oxygen (O20). The bond lengths, bond
tions were carried out using Gaussian 09 software [27] to get angles, and torsion angles of the optimized structure are
the most optimized geometry with the lowest energy. The listed in Table S1 (supplementary materials). N-H bonds
final optimized structure (Figure 1) is then confirmed to were found around 1.01 Ǻ, and the C-bond lengths are
have all real vibrational states at the same theory level (no between 1.08 Ǻ and 1.10 Ǻ as expected. All carbon angles
negative vibrational frequency). The time-dependent DFT involve O or N were calculated between 104.7 and 108.6. C8-
(TDDFT) calculations were used to determine ibrutinib’s C9-C14 is measured around 140.4, which is relatively large
optimized structures of the excited states in methanol uti- due to the ring fusing. The torsion angles C8-C9-C14-N13
lizing two main solvation packages. Polarizable continuum and C8-C9-C14-N15 torsions are almost linear (177.7° and
model (PCM) and solvation model based on density (SMD) -3.0°), indicating that the fused moiety is planar that agrees
are widely used in literature as solvation models and will be with the aromaticity fact. The difference in the bond length
our choice of TDDFT calculations of electronic transitions. between C4-H35 and C4-H34 (1.10 and 1.09 Ǻ) might be
evidence of the intramolecular C2-O1···H35 hydrogen
3. Results bonding.
3.1. Experimental Electronic Spectrum. Figure 2 shows the
UV-Vis absorption spectrum of ibrutinib. The absorption 3.5. Vibrational Frequencies. The vibrational frequencies
mainly occurs between 200 nm and 340 nm. Two main peaks were calculated using the DFT method at the same level ofJournal of Spectroscopy 3
Figure 1: The optimized structure of ibrutinib using high-level density functional theory to identify bond length and bond angles.
calculations computed all molecular orbitals of each mol-
70000
ecule, suggesting the possible and most probable electronic
transitions. UV-Vis spectrum was constructed based on the
Molar absorptivity (L/(mol.cm))
60000
energy gaps between states for each structure from these
50000 calculations. All calculations were performed using DFT
coupled with B3LYP and 6-311G++(d,p) as basis sets. The
40000 final results were extracted and visualized using GaussSum
[30].
30000
Both PCM and SMD methods predicted almost identical
20000 absorption spectra with three peaks. The first peak at
310.13 nm using PCM, 309.28 using the SMD method
10000 appeared to be the major one for the PCM method with an
oscillator strength of 0.566. The second peak at 399.03 nm
0 (for PCM and 396.26 nm for SMD) is the SMD method’s
200 250 300 350 400 450 500
Wavelength (nm) major peak. The last peak is found at 325.98 nm (for PCM
and 326.61 nm for SMD) is considered as a minor peak with
Experimental an oscillator strength of 0.03–0.04. All results are tabulated
PCM (polarizable continuum model) in Table 2.
SMD (solvation model based on density)
Figure 2: The UV-Vis absorption spectrum of 1x10⁻⁵ M (in
methanol) ibrutinib and the density functional theory calculations
4. Discussion
using two solvation techniques: PCM and SMD. The comparative The main functional groups that can be easily distinguished
spectra provide important electronic and orbital information about
by IR are the N-H and C�O bonds. The υNH2 stretching
the molecule.
frequencies appeared experimentally at 3470.05 and
3436.95 cm−1, while the calculations revealed them at
theory and level of basis sets. The results showed that 3600.64 and 3478.42 cm−1. The main reason for a significant
ibrutinib (57 atoms) has a C1 point group with 165 degrees shift in the IR in organic compounds is probably due to the
of freedom that produces 165 IR modes. The main as- hydrogen bonding [31]. In ibrutinib, there might be either
signments of these IR frequencies are reported in Table 1. intramolecular forces (56H of NH2 interacting with 13N of
The software Veda 4 [28] was used to extract and assign the pyrimidine) or intermolecular forces of a possible dimer-
infrared modes after scaling it with 0.97 as recommended by ization. This may encounter the difference in the υNH2
Andersson and Uvdal [29]. stretching frequency between the theory and the
experimental.
Also, υ(O�C) stretching frequencies appeared experi-
3.6. Electronic Transition. The time-dependent DFT mentally at 1652.4 and 1639.19 cm−1, while the DFT esti-
(TDDFT) calculations are determined for all optimized mated them at 1653.85 and 1601.47 cm−1. The two υ(O�C)
structures. PCM and SMD calculation methods are sug- stretching frequencies differ theoretically at 1.45 and
gested to estimate the electronic transitions. These 37.7 cm−1 from the experimental. This change is considered4 Journal of Spectroscopy
% transmittance
3600 3100 2600 2100 1600 1100 600
Wavenumber (cm–1)
DFT calculations
Experimental results
Figure 3: Fourier transform infrared spectrum of ibrutinib. The spectrum is used to determine the molecule’s structural information,
especially the functional groups N-H2 (at 3599.6, 3478.0 cm−1) and C�O (at 1652.4, 1639.19 cm−1).
Table 1: The main experimental and calculated vibrational frequencies (in cm−1) and their assignments and contribution for Iibrutinib
molecule based on the density functional theory computations at the B3LYP level of theory and 6-311G++(d,p) basis sets.
Experimental frequency (cm−1) Calculated frequency (cm−1) Assignment[a]
3470.05 3600.64 υNH
3436.95 3478.42 υNH
3296.16 3139.9 υCH
3096.16 3094.3 υCH
2952.6 2980.81 υCH
2936.19 2937.16 υCH
2885.62 2893.51 υCH
1652.4 1653.85 υOC
1639.19 1601.47 υOC
1586.75 1557.82 υNC
1520.88 1505.44 υCC
1483.63 1470.52 βHCN
1455.80 1457.4056 βHCH
1312.54 1304.65 υCC
1275.4 1269.73 υNC
1167.02 1182.43 υOC
1147.17 1121.32 υCC
985.52 981.64 υCH
859.31 859.42 υCH, υCC
801.88 833.23 υCH
725.31 745.93 υCH
698.37 684.82 υCC
[a]
υ: stretching; ß–: bending.
within the agreement between the theory and the experi- up to 58 cm−1 for a large molecule like C60 fullerenes (even
ment encountering the bulkiness of the molecule. Kara et al. though the molecule is highly symmetric and has no
concluded that a 20 cm−1 difference between B3LYP and functional group other than C�C) [34].
experimental for C�O for a relatively medium-sized mol- Other functional groups such as C�C and C�N were laid
ecule is a good agreement [32]. Atac et al. suggested that the in 1400–1600 cm−1 for both experimental and theoretical
C�O difference between DFT and experimental can go up to calculations. The υCH, υCC, υNC, υOC, βHCH, and βHCN
35 cm−1 differences [33]. At the same time, Do et al. found are interfering in the range of 1483–600 cm−1. In general,
the difference between the theory and the experimental goes most of the peaks from the DFT calculations with the highJournal of Spectroscopy 5
H
H
H
O
H H
H
H
H HH
N
H
N
N
H N
N
H H
H H
O H+
H N
H
H H
H H
H
H
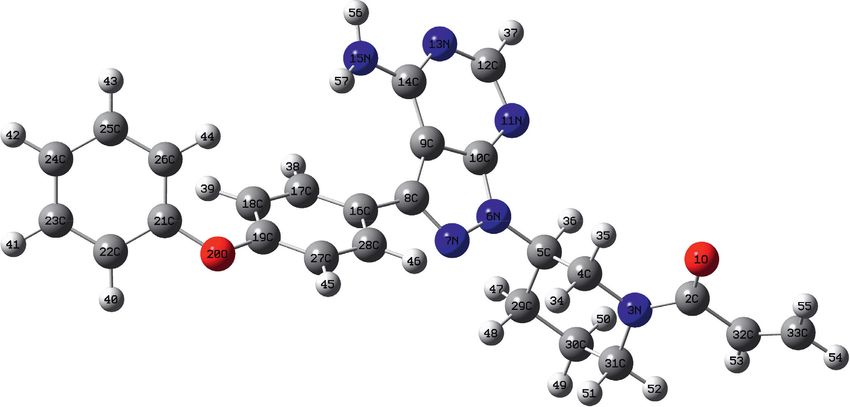
[Ibrutinib + H]+
Chemical formula : C25H25N6O2+
m/z : 441.20390 (100.0%), 442.20725 (27.0%), 443.21061 (3.5%)
100 441.2032 100 441.2031
80 80
60 60
Signal
Signal
40 40 442.2063
20 20
443.2083
0 0
200 300 400 500 600 436 438 440 442 444 446 448
m/z m/z
(a) (b)
Figure 4: Positive-mode electrospray ionization mass spectrometry of ibrutinib at room temperature with a direct fusion of methanol
solution using high-resolution mass spectrometry: (a) full-spectrum and (b) the isotopic pattern.
level of theory and basis sets agreed relatively well with the calculations revealed two significant peaks at around 310 nm
experimental counterpart peaks, as shown in Table 1 and and 399 nm (see Figure 2). These transitions are n-π ∗
Figure 3. transitions which are very sensitive to the environment, such
On the other hand, the electronic spectrum of ibrutinib as solvent and forces between the functional groups espe-
showed two peaks at 248.0 and 281.0 nm. In contrast, the cially with ibrutinib that has many functional groups.6 Journal of Spectroscopy
H
H
H
O
H H
H H
H H
O H
H H
N
H HH
H H N
H H H
H
H
H N
Chemical formula : C8H12NO+ N
H N H+
m/z : 138.09189 N
H
Chemical formula : C17H14N5O+
m/z : 304.11984
100 304.1178
80
60
Signal
40
441.2073
20
138.1123
0
50 100 150 200 250 300 350 400 450
m/z
Figure 5: Ibrutinib’s tandem mass spectrum with a direct fusion of methanol solution using a high-resolution electrospray ionization mass
spectrometer at a collision energy of 25 Joule. Two fragments were found at m/z � 304.1178 and 138.1123, corresponding to the pyrazole
pyridine bond breakage.
Table 2: The main peaks in the electronic spectrum for ibrutinib calculated by time-dependent density functional theory (B3LYP-6-
311G++(d,p)) in methanol using two different solvation methods: polarizable continuum model (PCM) and solvation model based on
density (SMD).
Solvation method Wavelength (nm) Oscillator strength Major contribution
PCM 310.13 0.566 HOMO ⟶ LUMO+2 (97%)
SMD 309.28 0.4881 HOMO ⟶ LUMO+2 (96%)
PCM 399.03 0.4641
HOMO ⟶ LUMO (98%)
SMD 396.26 0.5765
PCM 325.98 0.0416
HOMO⟶ LUMO+1 (99%)
SMD 328.61 0.0338
The two methods showed little difference from each other in computing the electronic transitions.
The peak at 310.13 (for PCM) nm 309.28 (for SMD) was PCM and 326.61 nm for SMD) is considered a minor peak
assigned as HOMO to LUMO +2 electronic transition for for the HOMO to LUMO +1 transition (see Table 2). Both
both methods. The second peak at 399.03 nm (for PCM and methods seem to fail to predict the correct electronic spectra
396.26 nm for SMD) was assigned as HOMO to LUMO with based on the experimental results shown in Figure 2. Al-
98% contribution. The last peak found at 325.98 nm (for though there is a significant difference between theJournal of Spectroscopy 7
theoretical and experimental peaks (∼61 nm and ∼115 nm), References
in the literature for small organic compounds, the accuracy
between the TDDFT methods results in a 15 nm difference [1] M. Hojjat-Farsangi, “Targeting non-receptor tyrosine kinases
(0.3 eV) [35]. On the other hand, the difference in the using small molecule inhibitors: an overview of recent ad-
vances,” Journal of Drug Targeting, vol. 24, no. 3, pp. 192–211,
electronic spectrum, using the best method (B3LYP) for
2016.
medium-sized molecules (1-naphthol), is estimated as 26 nm [2] Y. Nishizuka, “The role of protein kinase C in cell surface
(0.29 eV) [36]. One can expect that the existence of many signal transduction and tumour promotion,” Nature, vol. 308,
functional groups and the bulkiness of the molecule could no. 5961, pp. 693–698, 1984.
result in a greater difference between the theory and ex- [3] C. M. Lewis, C. Broussard, M. J. Czar, and P. L. Schwartzberg,
periment, giving the fact that the main transition which is “Tec kinases: modulators of lymphocyte signaling and de-
n-π ∗ transition is very sensitive to the environment, such as velopment,” Current Opinion in Immunology, vol. 13, no. 3,
solvent and forces between the functional groups. pp. 317–325, 2001.
The precision of the peak [ibrutinib + H]+ in mass [4] B. J. Druker, “Molecularly targeted therapy: have the flood-
spectrometry reached better precision than 2 ppm, which is gates opened?” The Oncologist, vol. 9, no. 4, pp. 357–360, 2004.
expected from Bruker QTOF II mass spectrometry. The [5] Z. Pan, H. Scheerens, S.-J. Li et al., “Discovery of selective
irreversible inhibitors for Bruton’s tyrosine kinase,” Chem-
isotopic pattern of 1 μM ibrutinib is shown in Figure 4(b)
MedChem, vol. 2, no. 1, pp. 58–61, 2007.
with a resolution of 95000 and S/N is larger than 10000. The [6] M. S. Cohen, C. Zhang, K. M. Shokat et al., “Structural
isotope intensities and values agreed relatively well with the bioinformatics-based design of selective, irreversible kinase
®
estimated ones obtained from ChemDraw software. The
tandem mass spectrum of ibrutinib (Figure 5) shows two
inhibitors,” Science, vol. 308, no. 5726, pp. 1318–1321, 2005.
[7] D. W. Fry, A. J. Bridges, W. A. Denny et al., “Specific, irre-
main fragments at m/z � 304.1178 and m/z � 138.1123 versible inactivation of the epidermal growth factor receptor
formed from the breaking of the N-C bond between the and erbB2, by a new class of tyrosine kinase inhibitor,”
pyrazole and the piperidine, which agreed with the previous Proceedings of the National Academy of Sciences, vol. 95,
studies of LC-MS of ibrutinib [37–39]. no. 20, pp. 12022–12027, 1998.
[8] Y. Zou, J. Xiao, Z. Tu et al., “Structure-based discovery of
novel 4,5,6-trisubstituted pyrimidines as potent covalent
5. Conclusion Bruton’s tyrosine kinase inhibitors,” Bioorganic & Medicinal
Chemistry Letters, vol. 26, no. 13, pp. 3052–3059, 2016.
This study is the first to investigate the UV-Vis and infrared [9] J. J. M. Rood, S. van Hoppe, A. H. Schinkel, J. H. M. Schellens,
spectra for ibrutinib. High resolution with isotopic patterned J. H. Beijnen, and R. W. Sparidans, “Liquid chromatography-
mass spectrum is also reported with a direct infusion of ESI- tandem mass spectrometric assay for the simultaneous de-
MS from methanol solution. DFT with a high level of theory, termination of the irreversible BTK inhibitor ibrutinib and its
B3LYP, and basis sets, 6-311G++(d,p), is used to determine dihydrodiol-metabolite in plasma and its application in
the optimized geometry of ibrutinib and compare the mouse pharmacokinetic studies,” Journal of Pharmaceutical
and Biomedical Analysis, vol. 118, pp. 123–131, 2016.
electronic transitions and vibrational frequencies.
[10] X. Zhao, M. Xin, Y. Wang et al., “Discovery of thieno[3,2- c ]
pyridin-4-amines as novel Bruton’s tyrosine kinase (BTK)
Data Availability inhibitors,” Bioorganic and Medicinal Chemistry, vol. 23,
no. 17, pp. 6059–6068, 2015.
Data are available on request by contacting the author [11] I. Sagiv-Barfi, H. E. K. Kohrt, D. K. Czerwinski, P. P. Ng,
aeyesmaeel@kau.edu.sa or pchem.ismail@gmail.com. B. Y. Chang, and R. Levy, “Therapeutic antitumor immunity
by checkpoint blockade is enhanced by ibrutinib, an inhibitor
of both BTK and ITK,” Proceedings of the National Academy
Conflicts of Interest of Sciences, vol. 112, no. 9, pp. E966–E972, 2015.
[12] S. O’Brien, R. R. Furman, S. E. Coutre et al., “Ibrutinib as
The author declares no conflicts of interest. initial therapy for elderly patients with chronic lymphocytic
leukaemia or small lymphocytic lymphoma: an open-label,
multicentre, phase 1b/2 trial,” The Lancet Oncology, vol. 15,
Acknowledgments no. 1, pp. 48–58, 2014.
This project was funded by the Deanship of Scientific Re- [13] M. L. Wang, S. Rule, P. Martin et al., “Targeting BTK with
ibrutinib in relapsed or refractory mantle-cell lymphoma,”
search (DSR) at King Abdulaziz University, Jeddah, under
New England Journal of Medicine, vol. 369, no. 6, pp. 507–516,
grant number G-384-662–1439. The author, therefore, ac- 2013.
knowledges with thanks DSR for technical and financial [14] J. C. Byrd, R. R. Furman, S. E. Coutre et al., “Targeting BTK
support. with ibrutinib in relapsed chronic lymphocytic leukemia,”
New England Journal of Medicine, vol. 369, no. 1, pp. 32–42,
2013.
Supplementary Materials [15] R. H. Advani, J. J. Buggy, J. P. Sharman et al., “Bruton tyrosine
kinase inhibitor ibrutinib (PCI-32765) has significant activity
Table S1: bond lengths, bond angles, and torsion angles of
in patients with relapsed/refractory B-cell malignancies,”
ibrutinib determined for the optimized molecule by density Journal of Clinical Oncology, vol. 31, no. 1, pp. 88–94, 2013.
functional theory study. (Supplementary Materials)8 Journal of Spectroscopy
[16] A. Aalipour and R. H. Advani, “Bruton tyrosine kinase in- theory,” Spectrochimica Acta Part A: Molecular and Biomo-
hibitors: a promising novel targeted treatment for B cell lecular Spectroscopy, vol. 83, no. 1, pp. 250–258, 2011.
lymphomas,” British Journal of Haematology, vol. 163, no. 4, [34] H. Do and N. A. Besley, “Calculation of the vibrational fre-
pp. 436–443, 2013. quencies of carbon clusters and fullerenes with empirical
[17] J. Singh, R. C. Petter, T. A. Baillie, and A. Whitty, “The re- potentials,” Physical Chemistry Chemical Physics, vol. 17,
surgence of covalent drugs,” Nature Reviews Drug Discovery, no. 5, pp. 3898–3908, 2015.
vol. 10, no. 4, pp. 307–317, 2011. [35] M. Schreiber, M. R. Silva-Junior, S. P. A. Sauer, and W. Thiel,
[18] P. Cohen, “The development and therapeutic potential of “Benchmarks for electronically excited states: CASPT2, CC2,
protein kinase inhibitors,” Current Opinion in Chemical Bi- CCSD, and CC3,” The Journal of Chemical Physics, vol. 128,
ology, vol. 3, no. 4, pp. 459–465, 1999. no. 13, Article ID 134110, 2008.
[19] J. J. Wu, M. Z. Zhang, and D. L. Liu, “Acalabrutinib (ACP- [36] J. Wang and B. Durbeej, “How accurate are TD-DFT excited-
196): a selective second-generation BTK inhibitor,” Journal of state geometries compared to DFT ground-state geometries?”
Hematology and Oncology, vol. 9, p. 4, 2016. Journal of Computational Chemistry, vol. 41, no. 18,
[20] J. A. Burger, A. Tedeschi, P. M. Barr et al., “Ibrutinib as initial pp. 1718–1729, 2020.
therapy for patients with chronic lymphocytic leukemia,” New [37] J. J. M. Rood, P. J. A. Dormans, M. J. van Haren,
England Journal of Medicine, vol. 373, no. 25, pp. 2425–2437, J. H. M. Schellens, J. H. Beijnen, and R. W. Sparidans,
2015. “Bioanalysis of ibrutinib, and its dihydrodiol- and glutathione
[21] J. R. Brown, J. C. Barrientos, P. M. Barr et al., “The Bruton cycle metabolites by liquid chromatography-tandem mass
tyrosine kinase inhibitor ibrutinib with chemo- spectrometry,” Journal of Chromatography B, vol. 1090,
immunotherapy in patients with chronic lymphocytic leu- pp. 14–21, 2018.
kemia,” Blood, vol. 125, no. 19, pp. 2915–2922, 2015. [38] R. de Vries, M. Huang, N. Bode et al., “Bioanalysis of ibrutinib
[22] L. A. M. Griner, R. Guha, P. Shinn et al., “High-throughput and its active metabolite in human plasma: selectivity issue,
combinatorial screening identifies drugs that cooperate with impact assessment and resolution,” Bioanalysis, vol. 7, no. 20,
ibrutinib to kill activated B-cell-like diffuse large B-cell pp. 2713–2724, 2015.
lymphoma cells,” Proceedings of the National Academy of [39] J. Dong, S. Li, and G. Liu, “In vitro metabolism of ibrutinib in
Sciences of the United States of America, vol. 111, no. 6, rat, dog and human hepatocytes using liquid chromatography
pp. 2349–2354, 2014. combined with diode-array detection and Q-Exactive Orbi-
[23] F. Cameron and M. Sanford, “Ibrutinib: first global approval,” trap tandem mass spectrometry,” Rapid Communications in
Drugs, vol. 74, no. 2, pp. 263–271, 2014. Mass Spectrometry, vol. 33, no. 23, pp. 1804–1815, 2019.
[24] J. C. Byrd, J. R. Brown, S. O’Brien et al., “Ibrutinib versus
ofatumumab in previously treated chronic lymphoid leuke-
mia,” New England Journal of Medicine, vol. 371, no. 3,
pp. 213–223, 2014.
[25] Administration, U. F. a. D., IMBRUVICATM (Ibrutinib)
Capsules, FDA, Silver Spring, MA, USA, 2013.
[26] V. Zvonı́ček, E. Skořepová, M. Dušek et al., “First crystal
structures of pharmaceutical ibrutinib: systematic solvate
screening and characterization,” Crystal Growth and Design,
vol. 17, no. 6, pp. 3116–3127, 2017.
[27] M. J. Frisch, G. W. Trucks, H. B. Schlegel et al., Gaussian 09,
Revision B.01, Wallingford, CT, USA, 2009.
[28] M. H. Jamroz, Vibrational Energy Distribution Analysis VEDA
4, Warsaw, Poland, 2004-2010.
[29] M. P. Andersson and P. Uvdal, “New scale factors for har-
monic vibrational frequencies using the B3LYP density
functional method with the triple-ζ basis set 6-311+G (d,p),”
The Journal of Physical Chemistry A, vol. 109, no. 12,
pp. 2937–2941, 2005.
[30] N. M. O’Boyle, A. L. Tenderholt, and K. M. Langner, “cclib: a
library for package-independent computational chemistry
algorithms,” Journal of Computational Chemistry, vol. 29,
no. 5, pp. 839–845, 2008.
[31] A. J. Barnes, K. Szczpeaniak, and W. J. Orville-Thomas, “Study
of intermolecular interactions by matrix isolation vibrational
spectroscopy,” Journal of Molecular Structure, vol. 59,
pp. 39–53, 1980.
[32] M. Kara, M. Evecen, and T. Özdogan, “Theoretical investi-
gations on the structural, spectroscopic, electronic and
thermodynamic properties of (3-Oxo-3H-benzo[f]chromen-
1yl) methyl N,N-dimethylcarbamodithioate-1ex,” Materials
Science-Poland, vol. 35, no. 3, pp. 560–575, 2017.
[33] A. Atac, M. Karabacak, E. Kose, and C. Karaca, “Spectroscopic
(NMR, UV, FT-IR and FT-Raman) analysis and theoretical
investigation of nicotinamide N-oxide with density functionalYou can also read