Exposure to airborne bacteria depends upon vertical stratification and vegetation complexity - Nature
←
→
Page content transcription
If your browser does not render page correctly, please read the page content below
www.nature.com/scientificreports
OPEN Exposure to airborne bacteria
depends upon vertical stratification
and vegetation complexity
Jake M. Robinson1,2,3,4*, Christian Cando‑Dumancela3,4, Rachael E. Antwis5, Ross Cameron1,
Craig Liddicoat3,4,6, Ravin Poudel7, Philip Weinstein4,6 & Martin F. Breed3,4
Exposure to biodiverse aerobiomes supports human health, but it is unclear which ecological factors
influence exposure. Few studies have investigated near-surface green space aerobiome dynamics, and
no studies have reported aerobiome vertical stratification in different urban green spaces. We used
columnar sampling and next generation sequencing of the bacterial 16S rRNA gene, combined with
geospatial and network analyses to investigate urban green space aerobiome spatio-compositional
dynamics. We show a strong effect of habitat on bacterial diversity and network complexity. We
observed aerobiome vertical stratification and network complexity that was contingent on habitat
type. Tree density, closer proximity, and canopy coverage associated with greater aerobiome alpha
diversity. Grassland aerobiomes exhibited greater proportions of putative pathogens compared to
scrub, and also stratified vertically. We provide novel insights into the urban ecosystem with potential
importance for public health, whereby the possibility of differential aerobiome exposures appears
to depend on habitat type and height in the airspace. This has important implications for managing
urban landscapes for the regulation of aerobiome exposure.
Exposure to biodiverse environmental microbiomes—the diverse consortium microorganisms in a given envi-
ronment—plays an important role in human health1–5. From an early age, a complex network of environmental
microorganisms supports the development and regulation of immunity6. Indeed, exposure to a wide range of
microorganisms is thought to strengthen our response to noxious stimuli (e.g., pathogens) and reduce the likeli-
hood that our immune systems will be oversensitive to innocuous agents, such as dust particles, pollen, and our
own cells—the latter manifesting as autoimmunity7–9.
Urbanisation and loss of macro-biodiversity are linked to loss of microbial diversity, which could nega-
tively impact the health-supporting microbial communities residing in and on human bodies—the human
microbiome10,11. This loss of microbial diversity underpins the biodiversity hypothesis, which draws a link between
concurrent global megatrends of biodiversity loss (including microorganisms)12 and rapid increases in noncom-
municable diseases (NCDs)13. A recent study empirically tested this hypothesis and found that exposure to plant
diversity and associated microbial communities significantly correlated with reduced risk of acute lymphoblastic
leukemia by promoting immune m aturation14.
Furthermore, biodiverse environments could supplement human microbiomes with functionally important
microorganisms. Short chain fatty acids (SCFAs) are produced by certain bacteria as metabolic by-products
and are known to play important roles in supporting human health. For example, the SCFA butyrate is linked
to the inhibition of intestinal t umours15 and a therosclerosis16, as well as supporting bone f ormation17 and pro-
moting epithelial integrity18. Such microorganisms may be transferred through aerobiomes. For example, in
a randomised controlled mouse study, a putative soil-associated butyrate-producing bacteria was found to be
supplemented in mice gut microbiota following trace-level airborne soil dust exposures and subsequently linked
to reduced anxiety-like b ehaviour5.
The aerobiome––the collection of microorganisms in a given airspace––is an important source of environ-
mental microorganisms19–21. Despite this importance, only limited studies have investigated the dynamics of
1
Department of Landscape Architecture, The University of Sheffield, Sheffield S10 2TN, UK. 2inVIVO Planetary
Health of the Worldwide Universities Network, NJ 10704, USA. 3College of Science and Engineering, Flinders
University, Bedford Park, SA 5042, Australia. 4The Healthy Urban Microbiome Initiative (HUMI), Adelaide,
Australia. 5School of Science, Engineering and Environment, University of Salford, Salford M5 4WX, UK. 6School
of Public Health and the Environment Institute, University of Adelaide, Adelaide, SA 5005, Australia. 7Department
of Microbiology and Cell Science, University of Florida, Gainesville, FL 32603, USA. *email: jmrobinson3@
sheffield.ac.uk
Scientific Reports | (2021) 11:9516 | https://doi.org/10.1038/s41598-021-89065-y 1
Vol.:(0123456789)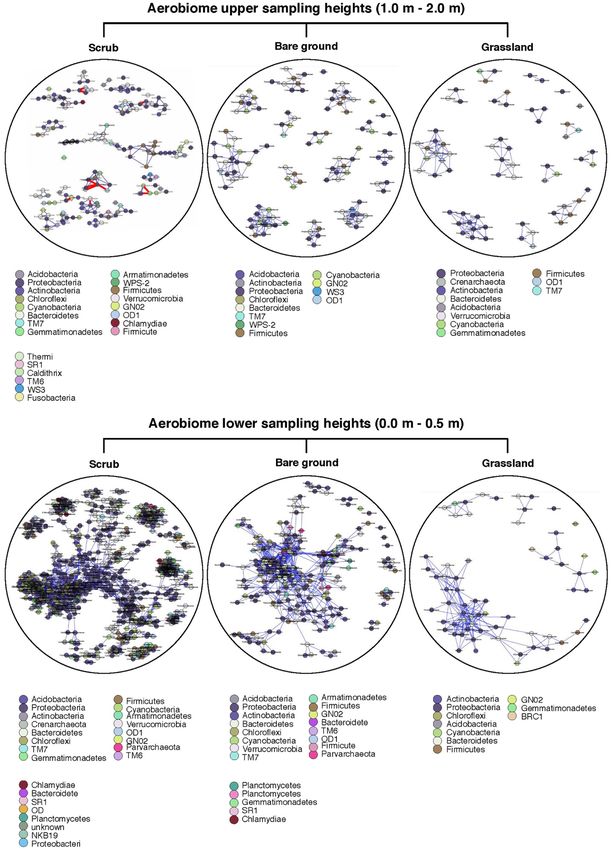
www.nature.com/scientificreports/
Figure 1. Box/violin plots of Shannon alpha diversity scores for each habitat; bare ground, grassland, and
scrub. Panel (a) shows inter-habitat bacterial alpha diversity for soil samples, and panel (b) shows inter-habitat
bacterial alpha diversity for aerobiome samples. Plots also display mean and median values, interquartile range
and kernel density estimation indicated by the shape of the violin (Shannon alpha diversity values for each
habitat, divided into days and sites, are in Supplementary Materials, Appendix C, Table S1). We also tested for
mean alpha diversity differences between dates and sites, showing that sampling dates and individual sites were
generally not a factor in alpha diversity variation with nearly 90% of comparisons showing non-significant
results (Appendix C, Table S2).
near-surface aerobiomes in urban green spaces. Mhuireach et al.22 showed that aerobiomes in urban green and
grey spaces had distinct compositions. Subsequent studies have shown vegetation type has a potential modulat-
ing effect on aerobiome diversity and composition23,24. Stewart et al.25found that aerobiomes varied in composi-
tion and function between urban and suburban sites. Mhuireach et al. (2019) identified localised influences on
aerobiomes, including weather and land m anagement22,26. Our recent work has also demonstrated aerobiome
vertical stratification between ground level and 2 m heights in an urban green s pace27. Together, these studies
suggest that individuals may be exposed to different aerobiomes depending on the type of habitat visited and
human-scale height-based variation in environmental aerobiomes. Consequently, understanding the effects of
habitat and height––and their interactions—on aerobiomes could have important implications for public health.
There is growing recognition that urban green spaces are important for human health and wellbeing through
provision of psychosocial and biological b enefits28–32. Gaining a deeper understanding of urban green space aero-
biome exposure potential could inform public health and environmental management strategies in the future.
In this study, we used an innovative columnar sampling method to sample aerobiome bacterial communities in
three urban green space habitat types in the Adelaide Parklands, South Australia. These habitats included amen-
ity grasslands, woodland/scrub (dominated by native Eucalyptus spp. trees and shrubs; henceforth referred to
as ‘scrub’), and bare ground habitat; each is a typical urban green space habitat. We conducted next generation
sequencing of the bacterial 16S rRNA gene to characterise the diversity, composition and network complexity
of aerobiomes. We also applied geospatial analytical methods to explore the potential influence of trees on the
micro-biodiversity of aerobiomes. Our primary objectives were to: (a) assess aerobiome composition and micro-
biodiversity differences between the three habitats; (b) compare aerobiome vertical stratification between the
different habitats; (c) assess whether tree density, distance to trees, and tree canopy coverage influenced bacte-
rial alpha diversity; and, (d) to assess any differences in known pathogenic bacterial taxa between habitats and
sampling heights.
Results
Bacterial communities were dominated by three key phyla in all three habitats: Proteobacteria, Bacteroidetes,
and Actinobacteria, however, abundance differed depending on height (Fig. S1) (full description of sequencing
reads in Supplementary Materials, Appendix B). We now present the results in order of the objectives (a–d) set
out in the Introduction.
Comparison of bacterial alpha diversity between habitats. We found that bacterial alpha diversity
of the soil differed significantly between habitats (ANOVA F = 3.95, df = 1, p = 0.03) (Fig. 1). The soil microbiome
from the scrub habitat was significantly more biodiverse than the grassland habitat (Tukey multiple comparison
Scientific Reports | (2021) 11:9516 | https://doi.org/10.1038/s41598-021-89065-y 2
Vol:.(1234567890)
www.nature.com/scientificreports/
Figure 2. Upper panels show air samples only, whereby (a) is a boxplot of dispersion (spread); (b) ordination
of bacterial communities for all habitats (BG bare ground, GR grassland, SC scrub), ellipses represent Euclidian
distance from the centre—with the radius equal to the confidence level (0.95); and (c) ordination of dispersion
by Aitchison Distance. Lower panels show soil samples only, whereby (d) is a boxplot of dispersion; (e)
ordination of bacterial communities for all habitats, ellipses represent Euclidian distance from the centre; and (f)
shows an ordination of dispersion by Aitchison Distance.
of means test; scrub x̅ = 5.78; grassland x̅ = 5.46; adjusted p = 0.02). We also found that bacterial alpha diversity
of the air differed significantly between bare ground and scrub habitats (Chi-squared = 11.3, df = 1, p ≤ 0.01),
with the scrub aerobiome being more biodiverse than the bare ground. Aerobiome alpha diversity of scrub and
grassland were also significantly different (Chi-squared = 24.8, df = 1, p ≤ 0.01), and the scrub aerobiome was the
most biodiverse. No significant difference was observed in alpha diversity between bare ground and grassland
habitats (Chi-squared = 0.46, df = 1, p ≤ 0.49).
Comparison of bacterial beta diversity between habitats. We observed clear differences in aero-
biome compositions (beta diversity) (PERMANOVA, df = 2, F = 3.7, R 2 = 0.07, p ≤ 0.01, permutations = 999) and
soil samples (PERMANOVA, df = 2, F = 6.8, R2 = 0.36, p ≤ 0.01, permutations = 999 among habitats (Fig. 2). For
air samples, all habitats displayed significantly distinct bacterial communities, where habitat type explained 7%
of the variation in bacterial community composition. However, there was significant heterogeneity in dispersion
(PERMDISP, F = 13, p ≤ 0.01). For soil only, habitat type explained 36% of the variation in bacterial community
composition, however, this increased significantly to 75% and 74% when comparing scrub to grassland and
scrub to bare ground, respectively (PERMANOVA, df = 5, F = 7, R 2 = 0.75 and 0.74, p ≤ 0.01). There was no sig-
nificant heterogeneity in dispersion (PERMDISP, F = 2, p = 0.07). We carried out PERMANOVA analysis for the
beta diversity/community composition (using the centre log ratio transformation) for each site and date prior
to running the broader compositional analysis. This step showed that there was no statistically significant varia-
tion in bacterial community composition between either dates or sites (Supplementary Materials, Appendix C,
Table S2).
Vertical stratification: alpha diversity. For the bare ground habitat, we observed a strong negative cor-
relation between alpha diversity (air and soil for all sites/dates) and sampling height from ground level to 2 m
(Pearson’s r = -0.75, df = 39, p ≤ 0.01) (Fig. 3a). Alpha diversity (Shannon scores) ranged from 1.2 to 5.93 and was
highest at soil level, followed by lower air sampling levels (0.0–0.5 m) and upper sampling levels (1.0–2.0 m),
respectively. Analysis of air-only samples also showed a significant negative correlation between height and
bacterial alpha diversity, demonstrating vertical stratification in this bare ground habitat (Pearson’s r = − 0.60,
df = 30 p ≤ 0.01).
For the grassland aerobiome, the correlation was weak and not significant, indicating that vertical stratifica-
tion was not detected in this habitat (Pearson’s r = 0.03, df = 34, p = 0.86). When analysing air and soil (for all
sites/dates) together, we observed a significant negative correlation between alpha diversity and sampling height
Scientific Reports | (2021) 11:9516 | https://doi.org/10.1038/s41598-021-89065-y 3
Vol.:(0123456789)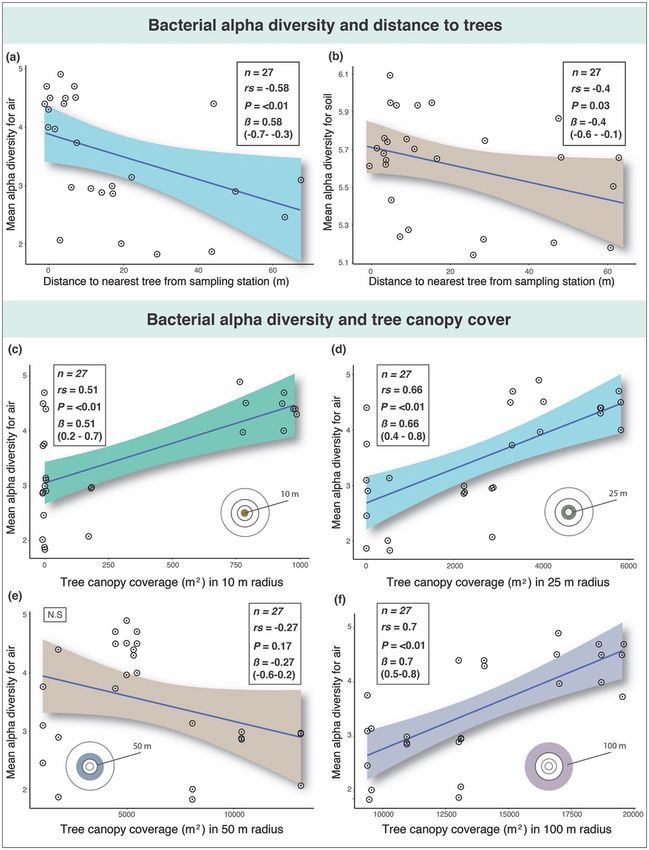
www.nature.com/scientificreports/
Figure 3. Box/violin plots of Shannon alpha diversity scores for each sampling height including soil and for
each habitat: (a) bare ground; (b) grassland; and (c) scrub. Plots also display mean values, interquartile range
and kernel density estimation, and silhouettes of humans for perspective.
from ground level to 2 m (Pearson’s r = − 0.38, df = 43, p = 0.01) (Fig. 3b). Alpha diversity ranged from 1.2 to 5.9
and was highest at soil level.
In the scrub aerobiome, we observed a significant negative correlation between alpha diversity (air and soil
for all sites/dates) and sampling height from ground level to 2 m (Pearson’s r = − 0.59, df = 39, p ≤ 0.01) (Fig. 3c).
Bacterial alpha diversity in the scrub habitat ranged from 1 to 6 (Shannon score) and was highest at soil level,
followed by lower air sampling levels (0.0–0.5 m) and upper sampling levels (1.0–2.0 m), respectively. Analysis
of air-only samples showed a significant negative correlation between height and bacterial alpha diversity, dem-
onstrating vertical stratification in this scrub habitat (Pearson’s r = − 0.38, df = 30, p = 0.03). See Supplementary
Materials, Appendix B, Table S3 for a statistical comparison of data between individual dates and sites (90% were
non-significant relationships, indicating low inter-date and site variation).
Vertical stratification: beta diversity. Sampling heights in the bare ground habitat displayed dispa-
rate bacterial compositions. Sampling height explained 29% of the variation in bacterial community composi-
tion when all air sampling heights were included (PERMANOVA df = 4, F = 3.67, R2 = 0.29, p ≤ 0.01, permuta-
tions = 999). Analysis of air samples for the bare ground habitat in isolation showed that sampling height still
explained 25% of the variation in bacterial community composition (df = 3, F = 3.06, R 2 = 0.25, p ≤ 0.01, permuta-
tions = 999).
Air sampling heights in the grassland habitat displayed disparate bacterial communities to the soil. Sampling
height explained 24% of the variation in bacterial community composition when all air sampling heights were
included (PERMANOVA df = 4, F = 3.17, R2 = 0.24, p ≤ 0.01, permutations = 999). However, analysis of grassland
air samples in isolation showed that sampling height only explained 9% of the variation in bacterial community
2 = 0.09, p = 0.24, permutations = 999).
composition and was not statistically significant (df = 3, F = 1.06, R
Sampling heights in the scrub habitat displayed disparate bacterial communities. Sampling height explained
22% of the variation in bacterial community composition when all air sampling heights and soil were included
(PERMANOVA df = 4, F = 2.9, R2 = 0.22, p ≤ 0.01, permutations = 999). Analysis of air samples in isolation showed
that sampling height still explained 11% of the variation in bacterial community composition (df = 3, F = 1.30,
Scientific Reports | (2021) 11:9516 | https://doi.org/10.1038/s41598-021-89065-y 4
Vol:.(1234567890)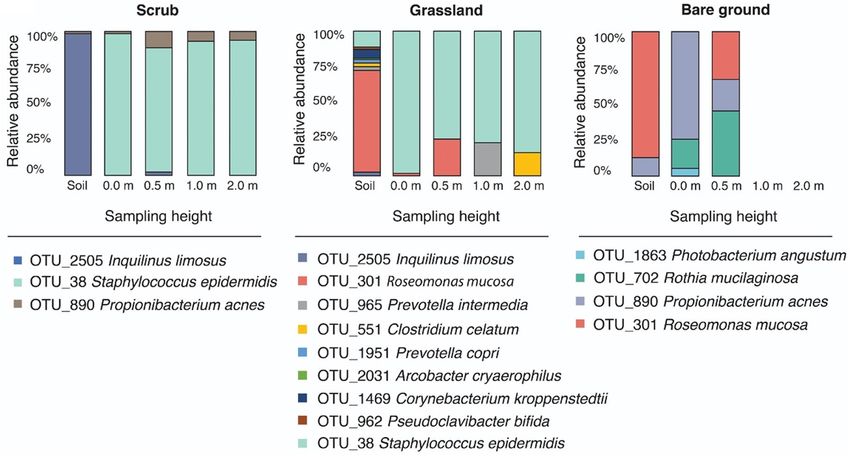
www.nature.com/scientificreports/
R2 = 0.11, p = 0.03, permutations = 999). See Supplementary Materials, Appendix C, Fig. S2 and Tables S4–S6 for
more information.
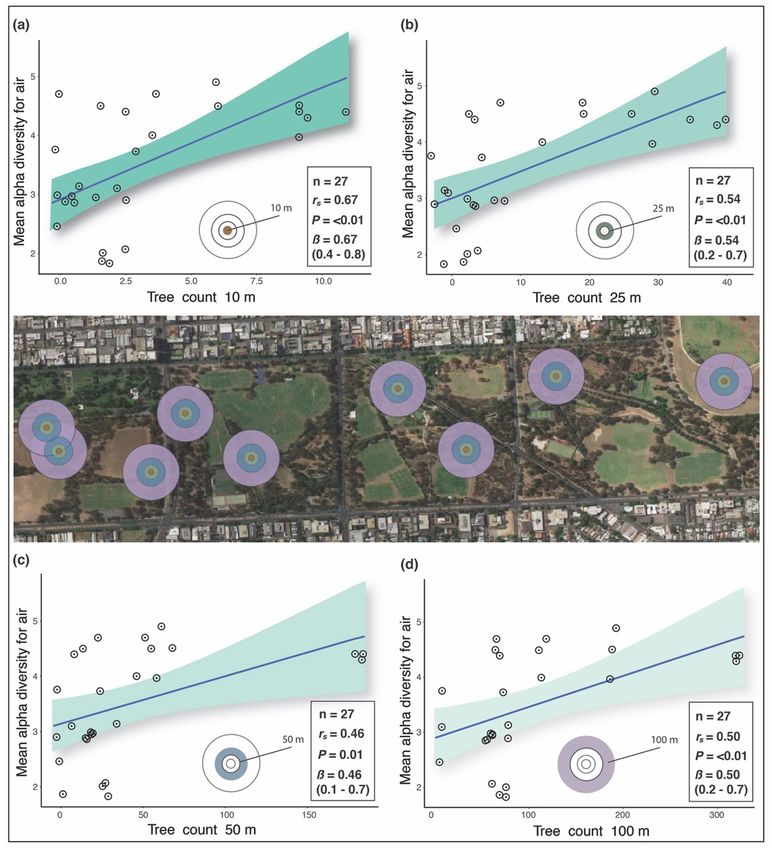
Vertical stratification: aerobiome network analysis. In spite of differences in bacterial community
composition and alpha diversity among the three study sites, network analyses showed an increase in the com-
munity complexity and interactions, defined by node degree and network size, at lower heights as compared to
higher heights (Fig. 4). Bacterial operational taxonomic units (OTUs) in the scrub habitat at 0–0.5 m heights had
the highest node degree, while the OTUs in the grassland habitat 1–2 m had the lowest node degree. At lower
heights, the average association of any OTU in the grassland was less (node degree = 2.7) than the average asso-
ciation of OTUs for scrub (node degree = 4.9) and bare ground (node degree = 4.7) habitats. At upper heights,
node degree for OTUs was highest for bare ground (2.7) followed by scrub (1.8) and grassland (1.7). Evalua-
tion of link type, either positive or negative links, suggested a positive association among most OTUs, except
for scrub 1–2 m which only had a small number of negative associations (Fig. 4). Comparisons of modularity
between heights across the study sites suggested an increase in the network modularity at higher heights, despite
the decrease in network connectance and node degree. Percentage of change in the modularity between heights
was highest in the grassland (~ 50%), although there were fewer nodes per module.
The relationship between tree metrics and bacterial alpha diversity. In the air samples, we found
strong positive correlations between tree density (based on count of trees in a given radius) and bacterial alpha
diversity in the 10 m radius (Spearman’s rs = 0.67, β = 0.67 (0.4–0.8), p ≤ 0.01) and 25 m radius (rs = 0.54, β = 0.54
(0.2–0.7), p ≤ 0.01) (Fig. 5a,b). We also found significant moderate positive correlations between tree density and
bacterial alpha diversity in the 50 m (Spearman’s rs = 0.46, β = 0.46 (0.1–0.7), p = 0.00) and 100 m radii (Spear-
man’s rs = 0.50, β = 0.50 (0.2–0.7), p ≤ 0.01) (Fig. 5c,d). Relationships between tree density and bacterial alpha
diversity in soil were not statistically significant (Spearman’s rs = 0.33, p = 0.38).
We found significant moderate negative correlations between distance to nearest trees (from sampling sta-
tions) and aerobiome alpha diversity (Spearman’s rs = − 0.58, β = − 0.58 (− 0.7 to − 0.3), p ≤ 0.01), and soil bacterial
alpha diversity (Spearman’s rs = − 0.40, β = − 0.40 (− 0.6 to − 0.1), p = 0.03) (Fig. 6a,b, respectively). Moreover, we
found significant moderate positive correlations between tree canopy coverage and bacterial alpha diversity of
the air in the 10 m (Spearman’s rs = 0.51, β = 0.51 (0.2–0.7), p ≤ 0.01), 25 m (Spearman’s rs = 0.66, β = 0.66 (0.4–0.8),
p ≤ 0.01), and 100 m radii (Spearman’s rs = 0.7, β = 0.7 (0.5–0.8), p ≤ 0.01) (Fig. 6c,d,f, respectively). There was a
negative correlation between canopy cover and bacterial alpha diversity in the 50 m radius that was not statisti-
cally significant (Spearman’s rs = − 0.27, β = − 0.27 (− 0.6 to 0.2), p = 0.17) (Fig. 6e).
Differentially abundant and notable taxa. There were 53 differentially abundant genera across habitat
types (based on log‐twofold‐change with adjusted p ≤ 0.05). The top three, for example, in the scrub habitat were:
Gillisia, Sphingobium, and Kutzneria; in grassland: Parvibaculum, BSV43, and Pseudomonas; and in bare ground:
Rudanella, Bacteroides, and Actinomyces. We also observed vertical stratification of differentially abundant taxa
and at the putative species level. After unclassified taxa were removed, we confirmed identity (100% match) via
Basic Local Alignment Search Tool (BLAST) against the NCBI database33. In the bare ground habitat, we found
30 differentially abundant taxa assigned at the putative species level. Sixteen of these significantly decreased in
relative abundance with sampling height and 14 significantly increased (p ≤ 0.01). In the grassland habitat, we
found 40 differentially abundant taxa assigned at the putative species level. Thirty-two of these significantly
decreased with sampling height and 8 significantly increased (p ≤ 0.01). In the scrub habitat, we found 16 dif-
ferentially abundant taxa assigned at the putative species level. Ten of these significantly increased with sampling
height and 6 significantly decreased (p ≤ 0.01). Using BLAST and a literature search, we found putative differ-
entially abundant human pathogens in each habitat (Fig. 7). A 2-sample test for equality of proportions with
continuity correction showed a significant difference in proportions of identifiable pathogenic species between
grassland and scrub (Chi-squared = 5.57, df = 1, p ≤ 0.02) but not between other habitats, where grassland sam-
ples exhibited significantly greater proportions of identifiable pathogenic species compared to scrub. Moreover,
87% of these significantly decreased with sampling height based on log‐twofold‐change differential analysis
(p ≤ 0.01). These taxa contain bacteria that have been associated with a number of diseases, including infective
endocarditis (Rothia mucilaginosa)34 and gut mucosal damage (Prevotella copri)35. More information on these
diseases can be found in Supplementary Materials, Appendix D, Fig. S3.
Environmental metadata. In terms of the environmental metadata, there was only one significant asso-
ciation with bacterial alpha diversity; aerobiome alpha diversity decreased significantly in scrub habitat as wind-
speed increased (Spearman’s rs = − 0.88, β = − 0.88 (− 0.98 to − 0.5), p ≤ 0.01) (full details in Supplementary
Materials, Appendix C, Table S7).
Discussion
Here we show that aerobiome alpha and beta diversity (community composition) differed significantly between
urban green space habitat type, and that aerobiome diversity, composition and network complexity also strati-
fied vertically. The level to which this occurred was dependent on habitat type. Therefore, potential bacterial
exposure levels and transfer loads to humans will likely differ depending on habitat type as well a person’s height
and behaviour. We also confirmed low variation in bacterial alpha and beta diversity between sampling dates
and sites (Appendix C). Our results confirmed that more trees, closer proximity to trees, and greater canopy
coverage associate with higher aerobiome diversity, which could have important implications for landscape
management and public health as growing emphasis is placed on designing and managing green spaces for
Scientific Reports | (2021) 11:9516 | https://doi.org/10.1038/s41598-021-89065-y 5
Vol.:(0123456789)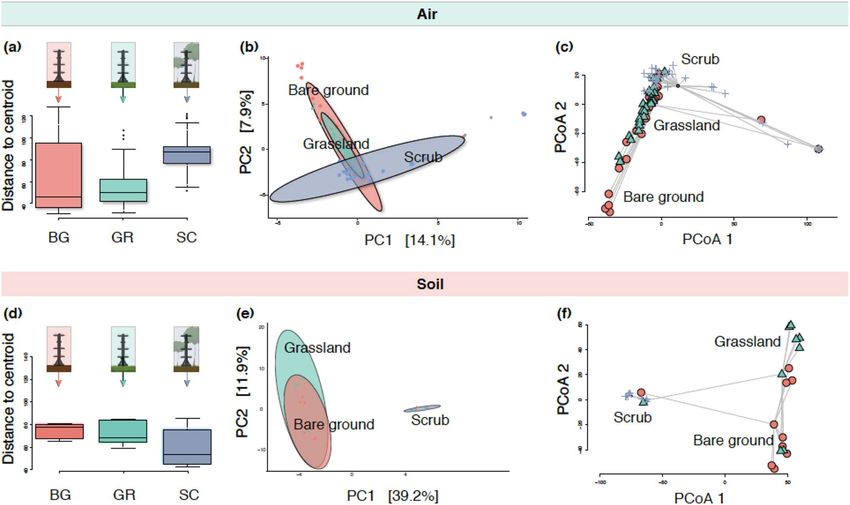
www.nature.com/scientificreports/

                                            Figure 4.  Association networks of bacterial OTUs for two vertical stratifications: 1.0–2.0 m (top panel) and
                                            0.0–0.5 m (bottom panel). Node colour represents phylum, and node are labelled at the family level. Blue links
                                            represent positive associations, and red links represent negative associations.

          Scientific Reports |   (2021) 11:9516 |               https://doi.org/10.1038/s41598-021-89065-y                                                   6

Vol:.(1234567890)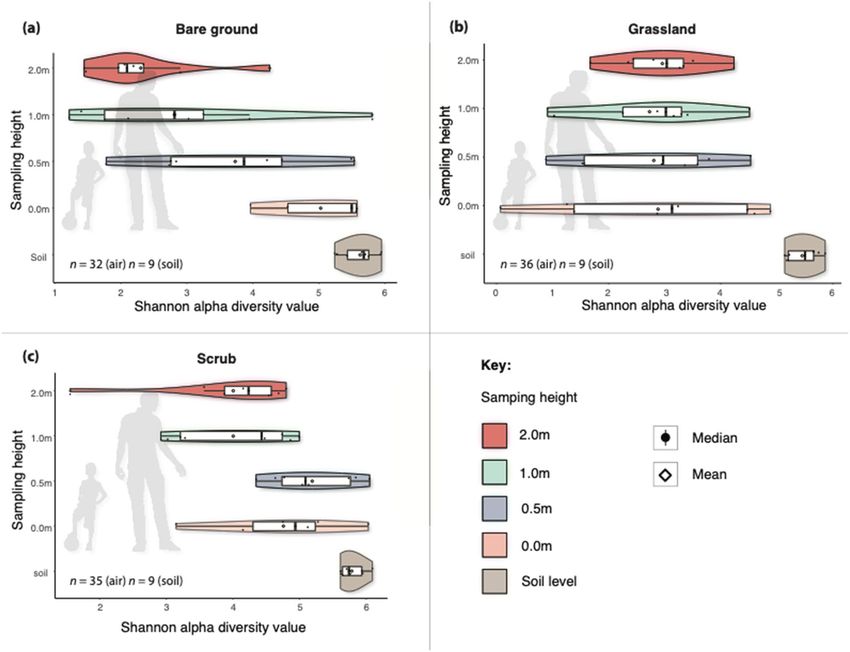
www.nature.com/scientificreports/
Figure 5. Scatterplots of Spearman’s correlations (rs) between bacterial alpha diversity (for all habitats and
air-only samples) and tree count within each buffer radius: (a) 10 m radius from sampling points, (b) 25 m
radius, (c) 50 m radius, and (d) 100 m radius. X-axis shows count of trees within buffer radii. Y-axis shows
bacterial alpha diversity of air-only samples using the Shannon diversity index (H). Green shading indicates
the 95% confidence intervals for each linear regression. The buffer radii are in the central aerial image and the
corresponding spatial rings are in the plots. Inset also shows bootstrap results (β) with 2.5% and 97.5% slopes.
wellbeing36. We also found that grassland samples exhibited significantly greater proportions of identifiable
pathogenic bacteria compared to scrub, and their abundance decreased significantly with sampling height. Our
study was conducted only in the Adelaide Parklands, South Australia and therefore may not be representative
of urban green spaces and climatic zones in other areas. Future work should explore these trends in additional
geographical, socioeconomic, cultural areas to understand both generalisability and opportunities to optimise
green space exposure for health benefits.
Scientific Reports | (2021) 11:9516 | https://doi.org/10.1038/s41598-021-89065-y 7
Vol.:(0123456789)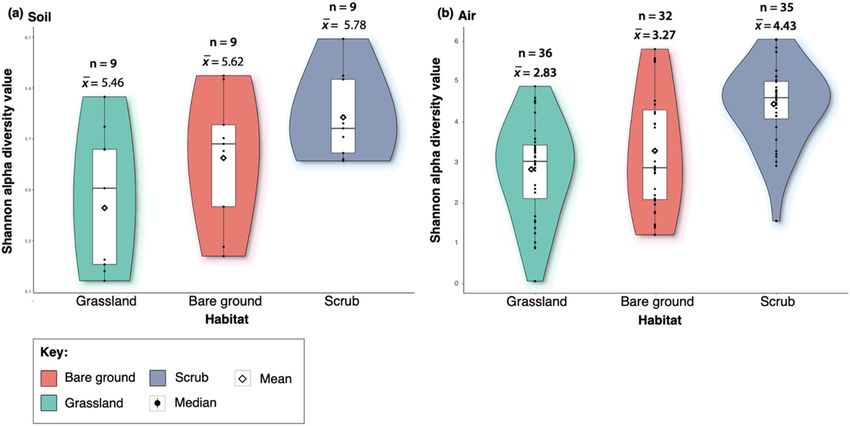
www.nature.com/scientificreports/
Figure 6. The upper panels show scatterplots of Spearman’s correlations (rs) between bacterial alpha
diversity (for all habitats) and distance to nearest trees: (a) air-only samples, and (b) soil-only samples. X-axis
shows distance (m) to nearest trees from sampling points. The lower panels show scatterplots of Spearman’s
correlations between bacterial alpha diversity (for all habitats) and tree canopy coverage within the sampling
point radii: (c) 10 m, (d) 25 m, (e) 50 m, and (f) 100 m. These relate to air-only samples. X-axis shows tree
canopy coverage ( m2). Y-axis for both upper and lower panels shows bacterial alpha diversity of samples
according to the Shannon diversity index (H). Coloured shading indicates the 95% confidence intervals for each
linear regression. Inset also shows bootstrap results (β) with 2.5% and 97.5% slopes. N.S (not significant).
Scientific Reports | (2021) 11:9516 | https://doi.org/10.1038/s41598-021-89065-y 8
Vol:.(1234567890)www.nature.com/scientificreports/
Figure 7. Potentially pathogenic and differentially abundant species for each habitat and their relative
abundance for each sampling height. More details on the diseases these pathogens may cause are in
Supplementary Materials, Appendix D, Fig. S3.
Aerobiome compositional differences between habitats. The scrub habitat exhibited the most bio-
diverse aerobiome in our study. This corroborates other studies that suggest that environmental microbiomes
are more biodiverse in urban habitats with more complex vegetation c ommunities37,38. Growing evidence sug-
gests that exposure to biodiverse environmental microbiomes could have important implications for human
health5,14,39. For example, environmental microbiomes are essential in the development and regulation of
immunity1,6, and soil-derived butyrate-producing bacteria may supplement gut bacteria and have anxiety-reduc-
ing effects5. Importantly, urban green space exposure can result in transmission of environmentally-derived
bacteria to the skin and a irways21. Furthermore, a recent study showed that transfer of bacteria from biodiverse
environments enhanced immunoregulatory pathways in children40. Consequently, environments with different
levels of bacterial diversity may affect the potentiality of bacterial exposure levels and transfer loads, warrant-
ing further research. We found differentially abundant putative pathogenic taxa and showed significant differ-
ences in proportions between grassland and scrub habitat samples. In other words, amenity grassland seemed to
exhibit a significantly greater proportion of (identifiable) pathogenic species compared to scrub samples. How-
ever, considerably more research is needed to fully explore the validity and generalisability of these results. As
with many microbial ecology studies, only identifiable bacterial taxa were used in the differential abundance and
analyses that identified the pathogenic taxa (i.e., unclassified taxa were removed). This could result in recording
bias with implications for validity.
Our results suggest that tree density, distance to nearest trees, and tree canopy cover could have a considerable
influence on aerobiome alpha diversity. This corroborates reports of trees acting as stationary vectors, spreading
bacterial cells in the a ir41. Complex plant detritus (leaf litter) and organic matter at the base of trees, and cor-
responding soil-microbe systems, may also contribute to tree-associated aerobiomes. The number of trees and
amount of canopy coverage within a given radius correlated strongly with alpha diversity. Furthermore, negative
correlations were shown between distance to nearest trees and bacterial alpha diversity for air and soil. This sup-
ports the results of the tree density associations and suggests that closeness to trees could be important. These
results could have important implications for landscape management and public health. Indeed, there have been
widespread calls to improve urban ecosystem services by augmenting tree coverage (e.g., to help reduce urban
heat island e ffects42, support w ildlife43,44, improve s leep45,46, and capture precipitation to reduce flood r isk47).
There is also a need to restore complex vegetation communities and host-microbiota interactions that provide
multifunctional roles in urban ecosystems37,48,49. An important limitation in our study was that tree species and
structural diversity metrics were not used. These additional measures could have enriched the quality of analysis
and implications of our results and further research that takes these factors into account is needed. However,
our findings suggest additional co-benefits from increasing urban tree coverage due to its potential to mediate
aerobiome alpha diversity. Our results also corroborate other studies showing microbial alpha diversity increas-
ing along densely-urban to semi-natural environmental g radients50,51.
Our results suggest that aerobiome beta diversity (compositional differences) differs between habitats. The
results imply that microbial communities in the soil of the scrub habitat are significantly different to bare ground
Scientific Reports | (2021) 11:9516 | https://doi.org/10.1038/s41598-021-89065-y 9
Vol.:(0123456789)www.nature.com/scientificreports/
and grassland, which are more compositionally aligned. It is possible that bacterial homogeneity between grass-
land and bare ground is attributed to homogeneity of vegetation c omplexity52. In other words, phyllosphere (total
above-ground portion of plants) and rhizosphere (soil root zone) presence and complexity create conditions for
different microbial relationships and thus compositional disparity with less botanically-complex or depauper-
ate habitats38,39. Taken together with the alpha diversity results, significantly more bacterial species and unique
communities exists in scrub habitat samples compared to grassland and bare ground samples. This could mean
that humans are exposed to a greater diversity of bacteria in the scrub habitat. Future studies should focus on the
functional relevance of these findings. Moreover, combining samples from across consecutive days has limita-
tions in that uncertainty increases. Although our PERMANOVA tests showed significantly low variation across
dates and sites, future work should increase inter-date sample sizes and apply uncertainty-reducing methods
such as mixed effect models.
Aerobiome vertical stratification. In our study, vertical stratification in bacterial alpha and beta diver-
sity occurred in the bare ground and scrub habitat. However, for the grassland aerobiome, both alpha and beta
diversity were relatively stable as height increased. This is the first study to demonstrate that aerobiome vertical
stratification is contingent on habitat type, which is important for potential human exposure. As mentioned,
urban green space exposure can result in transfer of environmental bacteria to the skin and respiratory t ract21,
and our study shows that the composition and diversity of aerobiome bacteria may differ between heights (from
ground level to 2 m). Consequently, there could be different bacterial exposure levels and transfer loads depend-
ing on a person’s height and activity27, however, further confirmatory research is needed. Our results suggest that
this may not be the case in amenity grassland where bacterial alpha and beta diversity exhibited high levels of
homogeneity among heights. Further research is required to determine the reasons for the lack of vertical strati-
fication in grassland. However, we hypothesise that lower baseline diversity, bacterial resources, openness and
airflow in this habitat may be contributing factors. Our study also provides some evidence that different urban
green space habitats and heights may not only affect exposure levels and transfer loads of bacterial diversity, but
also the presence of notable and potentially pathogenic species for humans. The relative abundance of pathogens
identified in the grassland habitat decreased significantly with sampling height. It is possible that a number of
these potential pathogens may originate from larger air-sheds (consistent with increasing relative abundance
with height), however grasslands may have lesser capacity, compared to scrub or bare ground, to present barriers
to this broader airflow or contribute to a more locally distinctive aerobiome. These findings highlight the need
for further empirical studies focusing on functional interactions in the environment-aerobiome-health axis.
Future studies should also try to control for factors such as human presence/movement through the study sites.
Our network analyses also provided evidence to support aerobiome vertical stratification. We saw a decrease
in bacterial interactions and network complexities with increased network modularity at higher heights compared
to lower heights across habitats, which might be attributed to reduced bacterial diversity with sampling height.
This pattern might be due to increasing influence, with increasing height, of diluted and somewhat homogenised
aerobiomes from larger airsheds, representing the physical mixing of air (and therefore aerobiomes) from mul-
tiple different and distant ecological sources. Increased modularity with reduced network size and interactions
may also indicate the existence of relatively simplified, yet modular bacterial communities at higher heights.
This could be the function of sparse food resources, especially if associations in the networks reflect niche-based
interactions. Increased modularity indicates the presence of dense connections between bacteria within modules
but sparse connections between bacteria in different modules, whereas reduced connectance means reduced
probability of interactions between any pair of bacteria. Increased modularity with reduced connectance often
indicates ecological s tability53. Moreover, presence of mostly positive associations might also suggest coopera-
tion for resources or lack of competition among the interacting OTUs in the community. While association-
based networks allow a depiction of potential interactions among OTUs and portray community structure,
they do not separate niche-based and biological interactions. Experiments with cultures are recommended if
future researchers wish to dissociate interaction types and understand the biological mechanisms behind such
interactions and network complexity. This action could be important to gain a greater ecological understanding
of aerobiome assembly (including vertical stratification), dynamics, and the potentiality of bacterial exposure.
Our results provide strong evidence that vertical stratification is a key factor not only in aerobiome diversity and
composition, but also in aerobiome interactions, community structure and complexity.
In conclusion, our study provides evidence that bacterial alpha and beta diversity differed significantly
between habitats, with scrub habitat providing the most biodiverse aerobiomes. We provide evidence supporting
the presence of aerobiome vertical stratification in bacterial community diversity, composition and complexity,
which also differed in a habitat-dependent manner. Our results confirmed that more trees, closer proximity to
trees, and greater canopy coverage associated with higher alpha diversity of the aerobiome. Finally, we found
that grassland samples exhibited significantly greater proportions of identifiable putative pathogenic bacteria
compared to scrub, and their richness decreased significantly with sampling height. As discussed, there is grow-
ing evidence to suggest that exposure to biodiverse aerobiomes may contribute towards the development and
regulation of immunity and support mental h ealth1,4–6. Gaining a greater understanding of bacterial transmis-
sion routes, exposure levels, transfer loads, and downstream health implications is required. This aerobiome
characterisation study provides novel insights into the urban ecosystem to help encourage further empirical
investigations. Future research should focus on the functional interactions between humans and the aerobiome.
Although additional research is required, our findings also support calls to increase urban tree cover. Exploring
the mediatory roles of trees in aerobiome compositional and functional diversity could have important implica-
tions for landscape management and public health.
Scientific Reports | (2021) 11:9516 | https://doi.org/10.1038/s41598-021-89065-y 10
Vol:.(1234567890)www.nature.com/scientificreports/
Materials and methods
Site selection. Our study was undertaken in the southern Adelaide Parklands (Kaurna Warra Pintyanthi),
South Australia, which comprised nine vegetated plots that spanned approx. 18 ha (central geographic coordi-
nates: latitude − 34.937866, longitude 138.60747). The nine plots included three amenity grasslands, three scrub,
and three bare ground (exposed soil) habitats.
There were several justifications for selecting this site: (1) the southern Parklands occur within the Upper
Outwash Plain soil boundary (coalescing alluvial soil, draining the Eden Fault Block), which provided broad
consistency in soil geochemistry; (2) a single section of the Parklands provided control over potential micro-
geographic variation effects on the aerobiome (e.g., distance to coast, elevation, orientation, aspect, and dominant
vegetation communities); (3) the Parkland habitats are representative of the types of green spaces that urban
residents are regularly exposed to when commuting or recreating; and, (4) the City of Adelaide provided guid-
ance in the selection process, identifying accessible (and inaccessible) plots.
We defined the boundaries of the nine plots (as polygons) in QGIS 3 (v3.0.2) in conjunction with the City
of Adelaide. Using spatial shapefiles for the plot boundaries, we generated random point algorithms to provide
random sampling points within each of the nine study plots (Fig. 8a). We recorded geographic coordinates for
each sampling point and programmed them into a handheld global positioning system (GPS) receiver. We oper-
ated the GPS receiver in the field, allowing us to pinpoint the locations for the sampling stations.
Sampling equipment. Sampling stations (Fig. 8b–e) were constructed using timber
(42 mm × 28 mm × 2.7 m), steel brackets, hooks and guy-lines27. We secured lab-grade clear plastic petri dishes
(bases and lids) to the sampling stations, which were used to sample the aerobiome via passive s ampling22.
On‑site setup. We installed the sampling stations on site between 0600 and 0800 h on the 4th, 5th and 6th
November 2019. At 0800 h, sampling stations were decontaminated using a 5% Decon 90 solution. We then
installed the petri dishes for passive sampling. The data loggers were also decontaminated. In the scrub habitat
(defined as vegetation dominated by locally native shrubs, usually ≤ 5 m tall, with scattered trees)54, the near-
est trees and shrubs were between 2 and 5 m from the sampling stations, and all trees were < 10 m height and
20–50 cm in diameter at breast height25.
Sampling protocol. We installed temperature and relative humidity data loggers at each sampling s tation27.
We programmed each logger to record data at 8-s intervals for the entire sampling period. At the start of each
sampling day, we calibrated the dataloggers using a mercury thermometer (Gerotherm) and a sling psychrom-
eter (Sper Scientific 736700). We collected other metadata including windspeed and soil pH (Alotpower digital
meter). We inserted the pH meter into the soil for a period of 1-min before taking a reading (manufacturer’s
instructions). We obtained data for windspeed and direction from Adelaide’s meteorological weather station at
Ngayirdapira (West Terrace): Lat: − 34.93, Lon: 138.58, Height: 29.32 m. We also used a handheld anemometer
(Digitech QM-1644) to record these parameters hourly at each sampling s ite22.
Soil samples. We used a small, decontaminated shovel to collect topsoil samples and stored these in sterile
50 mL falcon tubes. We collected five topsoil samples (approx. 0–5 cm depth) at equidistant sampling points,
20–30 cm from the stem of each sampling s tation55. We pooled and homogenised the soil samples, passed them
through a decontaminated 1 mm pore sieve, and placed them in new sterile and labelled 50 mL Falcon tubes. We
included field controls for the soil by opening sterile falcon tubes for 60 s in the equipment box at each s ite56. We
placed all soil and field control samples immediately into an ice box, and stored the samples in the lab at – 80 °C
prior to further processing57. In total, we collected 45 soil subsamples per sampling day across nine sampling
stations with three temporal replicates (on three consecutive days). We pooled and homogenised subsamples by
sampling station and day, which gave a total of 27 homogenised samples (nine per sampling station) plus 9 field
controls.
Aerobiome samples. To collect aerobiome samples, we used a passive sampling technique, following
established protocols22,26. We installed petri dishes (100 mm × 15 mm) with Velcro tabs on the sampling sta-
tions at four sampling heights: ground level (i.e., 0.0 m), 0.5 m, 1 m, and 2 m. As with soil samples, aerobiome
samples were collected on three consecutive days. The total height of the sampling station was 2 m from ground
level (95% of typical adult male heights lie within 2 SD at 1.93 m, and 1.78 m for females based on a study across
Europe, North America, Australia and East-Asia)58. Various human characteristics informed the height selection
(e.g., representation of adults vs. children, and different activities such as sitting, crawling, walking)27,59,60. We
decontaminated the steel plates supporting the petri dishes with 5% Decon 90 solution.
We secured the petri dishes to the sampling stations (Fig. 8), leaving them open for 6–8 h22, and closing them
at the end of the sampling period. To reduce contamination, new disposable laboratory gloves were worn for
each vertical sampling point. Once sampling was complete, we sealed the petri dishes using Parafilm, labelled
and transported them to the laboratory (on ice) for storage at – 80 °C26. We collected field control samples by
leaving unused petri dishes for 60 s in the equipment box and sealing them at each site.
DNA extraction, amplification and sequencing. We extracted DNA from soil and air samples at the
facilities of the Evolutionary Biology Unit, South Australian Museum. Using a digital number randomiser, we
processed samples on a randomised basis. We processed the low biomass air samples prior to the higher biomass
soil samples to minimise cross-contamination.
Scientific Reports | (2021) 11:9516 | https://doi.org/10.1038/s41598-021-89065-y 11
Vol.:(0123456789)www.nature.com/scientificreports/
Figure 8. (a) Location of study sites, showing the different habitat types and randomly selected sampling
locations. (b–e) Vertical stratification sampling station and methods used to collect (passively) air and (actively)
soilborne bacteria. We installed the stations in three different habitat types in the Adelaide Parklands.
To extract DNA, we swabbed the petri dishes in the lab using nylon-flocked swabs (FLOQSwabs Cat. No.
501CS01, Copan Diagnostics Inc.)5,26,27,61. All swabbing was carried out in a laminar flow cabinet type 1 (License
no. 926207) and each sample was swabbed for 30 s. Samples from the base and lids of each petri dish for each
height were pooled (intra-height pooling only). We cut the swabs directly into Eppendorf tubes (2 mL). We
used Qiagen QIAamp DNA Blood Mini Kits to extract DNA from the swabs and extraction blank controls.
For extraction blank controls, we used sterile water and reagents instead of a sample and all DNA extraction
Scientific Reports | (2021) 11:9516 | https://doi.org/10.1038/s41598-021-89065-y 12
Vol:.(1234567890)www.nature.com/scientificreports/
steps were performed as if they were normal samples. To extract DNA from the soil samples (and extraction
blank controls), we used Qiagen DNAeasy PowerLyzer Soil Kits and followed the manufacturer’s instructions.
PCR amplification was conducted in triplicate using the 341F/806R primer targeting the V3-V4 region of the
16S rRNA gene (5′-CCTAYGGGRBGCASCAG- 3′/5′-GGACTACNNGGGTATCTAAT-3′). The 300 bp paired
end run was sequenced on an Illumina MiSeq platform at the Australian Genome Research Facility using two
flowcells (ID 000000000-CW9V6 and 000000000-CVPGT). We conducted image analysis in real-time by the
MiSeq Control Software (v2.6.2.1) and Real Time Analysis (v1.18.54). We used the Illumina bcl2fastq (2.20.0.422)
pipeline to generate sequence data.
Bioinformatics and statistical analysis. Raw 16S rRNA gene sequences processing, OTU picking, taxo-
nomic assignments, and decontamination were as per Robinson et al. (2020) (described in detail in Supplemen-
tary Materials, Appendix A). To estimate OTU alpha diversity we derived Shannon Index values5 in phyloseq62 in
R. Prior to analysis of compositional data, we used centre log-ratio (clr) t ransformations63. Information acquired
from this approach is directly relatable to the e nvironment64. We generated violin plots with g gplot265 to visualise
the distribution of the alpha diversity scores for each habitat and height. Bacterial beta diversity was visualised
using ordination plots of Aitchison distances based on clr-transformations of OTU abundances. Ordination
plots show low-dimensional ordination space in which similar samples are plotted close together, and dissimilar
samples are plotted far apart.
We used permutational multivariate analysis of variance (PERMANOVA) to test for compositional differences
between different sites, habitats and sampling heights, and permutation tests for homogeneity of multivariate
dispersions using vegan66 in R. Pearson’s product-moment and Spearman’s rank correlation tests were used to
examine correlations between habitat, sampling height and alpha diversity scores. Using phyloseq, we calculated
OTU relative abundances to examine the distribution of taxa that may have potential implications for public
health. We used DESeq267 in R to conduct differential abundance analysis for all air samples based on log‐two-
fold‐change. To compare presence and proportions of taxa we used 2-sample tests for equality of proportions
with continuity corrections. We also applied bootstrap resampling to assign a measure of accuracy to sample
estimates for the Spearman’s correlations, using a minimum of 1000 iterations. This was carried out with the
psych68 and boot69 packages in R.
In order to understand the effect of vertical stratification on bacterial interactions and community structures,
we evaluated association-networks of bacterial OTUs. We combined the OTU database from 0 to 0.5 m and 1
to 2 m for each site, and constructed two networks per site (i.e., lower and upper height), such that in total six
networks were evaluated across the three habitats. In the evaluated network, nodes represent OTUs and links
exists between a pair of OTUs if their frequencies are significantly associated (absolute abundance > 0.7, p ≤ 0.01).
The type of association, whether positive or negative, was represented with blue and red links, respectively. To
account for compositional bias associated with OTU data, we used SparCC70 to define associations, and only
OTUs with sequence counts > 10 were included. Randomly permuted (n = 100) data were used to estimate signifi-
cance of associations, and i graph71 was used to visualize and evaluate the plots. We also ran Spearman’s correlation
tests with bootstrap resampling to determine whether environmental metadata (pH, temperature, windspeed)
associated with bacterial alpha diversity. Outliers were considered as data points more than 1.5× above the third
quartile or below the first quartile.
Geospatial analyses. We investigated possible relationships between aerobiome samples and surrounding
vegetation properties using spatial buffer zones. For the buffer analysis, we used vector geoprocessing tools in
QGIS 3. Buffer sizes of 10 m, 25 m, 50 m, and 100 m were considered appropriate for the study scale. Similar dis-
tances have been used in previous green space and epidemiology s tudies31,72–74. A 100 m maximum buffer radius
was chosen; at greater distances, effects would no longer be local to the sampling points (i.e., they would overlap
with other sampling points). To determine tree canopy cover within each buffer radii, ESRI shapefiles were
imported into i-Tree Canopy75. This enabled random sampling points (between 50 and 250 points per buffer)
and selection of land cover classification and associated metrics overlaid with Landsat 8 satellite imagery75–77.
Tree count and distance measures were acquired using geometry tools in QGIS 3. We explored the potential rela-
tionship between tree metrics and mean bacterial alpha diversity values of combined air-only sampling heights
(n = 27 samples).
Data availability
All data and code used in this study are available on the UK Data Service ReShare. Data collection ID: 854551.
Received: 6 January 2021; Accepted: 20 April 2021
References
1. Rook, G. A., Martinelli, R. & Brunet, L. R. Innate immune responses to mycobacteria and the downregulation of atopic responses.
Curr. Opin. Allergy Clin. Immunol. 3, 337–342 (2003).
2. Dannemiller, K. C. et al. Next-generation DNA sequencing reveals that low fungal diversity in house dust is associated with child-
hood asthma development. Indoor Air 24, 236–247 (2014).
3. Stein, M. M. et al. Innate immunity and asthma risk in Amish and Hutterite farm children. N. Engl. J. Med. 375, 411–421 (2016).
4. Arleevskaya, M. I., Aminov, R., Brooks, W. H., Manukyan, G. & Renaudineau, Y. Shaping of human immune system and metabolic
processes by viruses and microorganisms. Front Microbiol. 10, 816 (2019).
5. Liddicoat, C. et al. Naturally-diverse airborne environmental microbial exposures modulate the gut microbiome and may provide
anxiolytic benefits in mice. Sci. Total Environ. 701, 134684 (2020).
Scientific Reports | (2021) 11:9516 | https://doi.org/10.1038/s41598-021-89065-y 13
Vol.:(0123456789)www.nature.com/scientificreports/
6. Rook, G. A., Raison, C. L. & Lowry, C. A. Microbiota, immunoregulatory old friends and psychiatric disorders. In Microbial
Endocrinology: The Microbiota-Gut-Brain Axis in Health and Disease 2014 319–356 (Springer, 2014).
7. Rook, G. A. Regulation of the immune system by biodiversity from the natural environment: An ecosystem service essential to
health. Proc. Natl. Acad. Sci. 110, 18360–18367 (2013).
8. Schwinge, D. & Schramm, C. Sex-related factors in autoimmune liver diseases. In Seminars in Immunopathology, Voxl 41, No 2
165–175 (Springer, 2019).
9. Prescott, S. L. A butterfly flaps its wings: Extinction of biological experience and the origins of allergy. Ann. Allergy Asthma Immu-
nol. 20, 20 (2020).
10. Prescott, S. L. et al. The skin microbiome: Impact of modern environments on skin ecology, barrier integrity, and systemic immune
programming. World Allergy Organ. J. 10, 29 (2017).
11. Austvoll, C. T., Gallo, V. & Montag, D. Health impact of the Anthropocene: The complex relationship between gut microbiota,
epigenetics, and human health, using obesity as an example. Glob. Health Epidemiol. Genom. 5, 20 (2020).
12. Haahtela, T. A biodiversity hypothesis. Allergy 74, 1445–1456 (2019).
13. Haahtela, T. et al. The biodiversity hypothesis and allergic disease: World allergy organization position statement. World Allergy
Organ. J. 6, 1–8 (2013).
14. Donovan, G., Gatziolis, D., Mannetje, A. T., Weinkove, R., Fyfe, C., & Douwes, J. An empirical test of the biodiversity hypothesis:
Exposure to plant diversity is associated with a reduced risk of childhood acute lymphoblastic leukemia. Available at SSRN 3559635
(2020).
15. Chen, D. et al. Clostridium butyricum, a butyrate-producing probiotic, inhibits intestinal tumor development through modulating
Wnt signalling and gut microbiota. Cancer Lett. 469, 456–467 (2020).
16. Du, Y. et al. Butyrate protects against high-fat diet-induced atherosclerosis via up-regulating ABCA1 expression in apolipoprotein
E-deficiency mice. Br. J. Pharmacol. 177, 1754–1772 (2020).
17. Li, J. Y. et al. Microbiota dependent production of butyrate is required for the bone anabolic activity of PTH. J. Clin. Invest. 20, 20
(2020).
18. Geirnaert, A. et al. Butyrate-producing bacteria supplemented in vitro to Crohn’s disease patient microbiota increased butyrate
production and enhanced intestinal epithelial barrier integrity. Sci. Rep. 7, 1–4 (2017).
19. Uetake, J. et al. Seasonal changes of airborne bacterial communities over Tokyo and influence of local meteorology. Front Microbiol.
10, 1572 (2019).
20. Flies, E. J., Clarke, L. J., Brook, B. W. & Jones, P. Urban airborne microbial communities are less abundant and less diverse than
rural counterparts-but what does that mean for our health? A systematic review. Sci. Total Environ. 20, 140337 (2020).
21. Selway, C. A. et al. Transfer of environmental microbes to the skin and respiratory tract of humans after urban green space exposure.
Environ. Int. 145, 106084 (2020).
22. Mhuireach, G. et al. Urban greenness influences airborne bacterial community composition. Sci. Total Environ. 571, 680–687
(2016).
23. Lymperopoulou, D. S., Adams, R. I. & Lindow, S. E. Contribution of vegetation to the microbial composition of nearby outdoor
air. Appl. Environ. Microbiol. 82, 3822–3833 (2016).
24. Abdelfattah, A. et al. Revealing cues for fungal interplay in the plant–air interface in vineyards. Front Plant Sci. 10, 922 (2019).
25. Stewart, J. et al. Variation of near surface atmosphere microbial communities at an urban and a suburban site in Philadelphia, PA,
USA. Sci. Total Environ. 1, 138353 (2020).
26. Mhuireach, G. Á., Betancourt-Román, C. M., Green, J. L. & Johnson, B. R. Spatiotemporal controls on the urban aerobiome. Front
Ecol. Evol. 7, 43 (2019).
27. Robinson, J. M. et al. Vertical stratification in urban green space aerobiomes. Environ. Health Perspect. 128, 1–12 (2020).
28. Robinson, J. M. & Breed, M. F. Green prescriptions and their co-benefits: Integrative strategies for public and environmental health.
Challenges 10, 9 (2019).
29. Callaghan, A. et al. The impact of green spaces on mental health in urban settings: A scoping review. J. Ment. Health 18, 1–5 (2020).
30. Cameron, R. W. et al. Where the wild things are! Do urban green spaces with greater avian biodiversity promote more positive
emotions in humans?. Urban Ecosyst. 23, 301–317 (2020).
31. Robinson, J. M., Jorgensen, A., Cameron, R. & Brindley, P. Let nature be thy medicine: A socioecological exploration of green
prescribing in the UK. Int. J. Environ. Res. Public Health 17, 3460 (2020).
32. Yeh, C. T., Cheng, Y. Y. & Liu, T. Y. Spatial characteristics of urban green spaces and human health: An exploratory analysis of
canonical correlation. Int. J. Environ. Res. Public Health 17, 3227 (2020).
33. Altschul, S. F., Gish, W., Miller, W., Myers, E. W. & Lipman, D. J. Basic local alignment search tool. J. Mol. Biol 215, 403–410 (1990).
34. Franconieri, F. et al. Rothia spp. infective endocarditis: A systematic literature review. Méd. Maladies Infect. 35, 1–8 (2020).
35. Iljazovic, A. et al. Perturbation of the gut microbiome by Prevotella spp. enhances host susceptibility to mucosal inflammation.
Mucosal Immunol. 14, 1–12 (2020).
36. Robinson, J. M. & Jorgensen, A. Rekindling old friendships in new landscapes: The environment–microbiome–health axis in the
realms of landscape research. People Nat. 2, 339–349 (2020).
37. Baruch, Z. et al. Characterising the soil fungal microbiome in metropolitan green spaces across a vegetation biodiversity gradient.
Fungal Ecol. 47, 100939 (2020).
38. Mills, J. G. et al. Revegetation of urban green space rewilds soil microbiotas with implications for human health and urban design.
Restor. Ecol. 20, 20 (2020).
39. Honeker, L. K. et al. Gut microbiota from amish but not hutterite children protect germ-free mice from experimental asthma. In
D92. The Microbiome and Lung Disease A7022–A7022 (American Thoracic Society, 2019).
40. Roslund, M. I. et al. Biodiversity intervention enhances immune regulation and health-associated commensal microbiota among
daycare children. Sci. Adv. 6, 2578 (2020).
41. Laforest-Lapointe, I., Messier, C. & Kembel, S. W. Tree leaf bacterial community structure and diversity differ along a gradient of
urban intensity. MSystems 2, 6 (2017).
42. Chen, J., Jin, S. & Du, P. Roles of horizontal and vertical tree canopy structure in mitigating daytime and night-time urban heat
island effects. Int. J. Appl. Earth Obs. Geoinf. 89, 102060 (2020).
43. Straka, T. M., Wolf, M., Gras, P., Buchholz, S. & Voigt, C. C. Tree cover mediates the effect of artificial light on urban bats. Front
Ecol. Evol. 7, 91 (2019).
44. Wood, E. M. & Esaian, S. The importance of street trees to urban avifauna. Ecol. Appl. 20, 20 (2020).
45. Astell-Burt, T. & Feng, X. Does sleep grow on trees? A longitudinal study to investigate potential prevention of insufficient sleep
with different types of urban green space. SSM Popul. Health 10, 100497 (2020).
46. Woo, J. & Lee, C. J. Sleep-enhancing effects of phytoncide via behavioral, electrophysiological, and molecular modeling approaches.
Exp. Neurobiol. 29, 120 (2020).
47. Ross, S. et al. i-Tree eco analysis of landscape vegetation on remediated areas of oak ridge national laboratory. Open J. Forest. 10,
412 (2020).
48. Robinson, J. M., Mills, J. G. & Breed, M. F. Walking ecosystems in microbiome-inspired green infrastructure: An ecological per-
spective on enhancing personal and planetary health. Challenges 9, 40 (2018).
Scientific Reports | (2021) 11:9516 | https://doi.org/10.1038/s41598-021-89065-y 14
Vol:.(1234567890)You can also read