Fast food diet with CCl4 micro-dose induced hepatic-fibrosis -a novel animal model
←
→
Page content transcription
If your browser does not render page correctly, please read the page content below
Chheda et al. BMC Gastroenterology 2014, 14:89
http://www.biomedcentral.com/1471-230X/14/89

 RESEARCH ARTICLE                                                                                                                                 Open Access

Fast food diet with CCl4 micro-dose induced
hepatic-fibrosis –a novel animal model
Tarak K Chheda1, Pratibha Shivakumar1, Satish Kumar Sadasivan1, Harish Chanderasekharan1,
Yogananda Moolemath1, Anup M Oommen2, Jagannath R Madanahalli3 and Venkataranganna V Marikunte1*

  Abstract
  Background: Non-alcoholic fatty liver disease (NAFLD) is defined as a spectrum of conditions ranging from
  hepatocellular steatosis to steatohepatitis and fibrosis, progressing to cirrhosis, which occur in the absence of
  excessive alcohol use. Several animal models capture aspects of NAFLD but are limited either in their representation
  of the disease stages or use for development of therapeutics due to the extended periods of time required to
  develop full histological features.
  Methods: Here, we report the development of a novel rat model for NAFLD that addresses some of these
  limitations. We used a fast food diet (FFD) and a CCl4 micro dose (0.5 ml/kg B.wt) for 8 weeks in Wistar rats.
  Serological analyses, gene expression profiling and liver histology studies were conducted to investigate the
  development of steatosis, steatohepatitis and fibrosis in the FFD-CCl4 model when compared to the individual
  effects of a FFD or a micro dose of CCl4 in rats.
  Results: The serum biochemical profile of the FFD-CCl4 model showed an increase in liver injury and fibrosis.
  This was also accompanied by a significant increase in liver triglycerides (TG), inflammation and oxidative stress.
  Importantly, we observed extensive fibrosis confirmed by: i) increased gene expression of fibrosis markers and,
  ii) moderate to severe collagen deposition seen as perisinusoidal and bridging fibrosis using H&E, Trichome and
  Sirius Red staining.
  Conclusions: In summary, we find that the FFD-CCl4 rat model developed NAFLD histological features including,
  steatosis, inflammation and fibrosis in 8 weeks showing promise as a model that can be used to develop NAFLD
  therapeutics and liver anti-fibrotics.

Background                                                                             been developed involving genetic and diet manipulation,
Non-alcoholic fatty liver disease (NAFLD) is defined by a                              treatment with toxins as well as combination models [6-19].
spectrum of conditions that occur in the absence of                                    Genetic models of NAFLD include AOX null mice [6,7],
excessive alcohol use and range from hepatocellular                                    MAT1A null mice [8], liver-specific NRF1 knockouts [9],
steatosis to steatohepatitis (NASH) and fibrosis, progressing                          liver-specific PTEN knockouts [10] and leptin-deficient
to cirrhosis [1,2]. The current prevalence of NAFLD in the                             obese mice [11,12], which develop NAFLD due to a
western world is ~20–30% of the population [3,4] and is                                disruption in the antioxidant mechanism, fatty acid
expected to increase to >40% by 2030 [5], indicating the                               metabolism or triglyceride synthesis/secretion. Diet
growing risk for individuals leading a sedentary lifestyle on                          modulations leading to NAFLD include the methionine
a high-fat, high-carbohydrate, calorie-rich diet.                                      and choline deficient diet-fed mice [13] and high fat diet
  Research efforts in NAFLD have been aimed at                                         (HFD) mice [14,15] wherein, NAFLD severity varies with
understanding disease development, progression and                                     diet composition, duration of feeding, species, strain, and
pathophysiology simultaneously facilitating drug discovery.                            gender of animals. Well-known chemical-induced models
To this end, various animal models of NAFLD have                                       of NAFLD include carbon tetrachloride (CCl4) and
                                                                                       thioacetamide-treated mice [16,17]. The main advantages
* Correspondence: m.v.venkataranganna@connexios.com                                    of the well-established CCl4 model include convenience
1
 Preclinical Development, Connexios Life Sciences Pvt Ltd., Bangalore, India
Full list of author information is available at the end of the article                 and establishment of both mouse and rat models with

                                         © 2014 Chheda et al.; licensee BioMed Central Ltd. This is an Open Access article distributed under the terms of the Creative
                                         Commons Attribution License (http://creativecommons.org/licenses/by/2.0), which permits unrestricted use, distribution, and
                                         reproduction in any medium, provided the original work is properly credited. The Creative Commons Public Domain
                                         Dedication waiver (http://creativecommons.org/publicdomain/zero/1.0/) applies to the data made available in this article,
                                         unless otherwise stated.
Chheda et al. BMC Gastroenterology 2014, 14:89                                                                   Page 2 of 9
http://www.biomedcentral.com/1471-230X/14/89

evidence of fibrosis/cirrhosis across routes of CCl4             10 animals/group per sex. Group G1 comprised of animals
administration. However, multiple reports have revealed          on chow diet, G2 animals were fed a chow diet and
considerable disadvantages in the intraperitoneal, subcuta-      received a CCl4 micro dose of 0.5 ml/kg B.wt, G3 animals
neous, inhalation and oral routes of CCl4 administration,        were fed a FFD alone and G4 animals were fed a FFD and
including chronic peritonitis, necrosis at injection site with   received a CCl4 micro dose of 0.5 ml/kg B.wt. The FFD
inconsistent fibrosis, respiratory arrest and higher mortality   consisted of 2 g cholesterol and 0.5 g cholic acid mixed
with inconsistent fibrosis, respectively [19].                   with normal chow diet made up to 100 g to increase calorie
  Recently, Charlton et al. reported the development of a        content in comparison to the chow diet. Corn oil (5 ml/kg
fast food diet mouse model (FFD) of NASH recapitulating          b.wt) was administered through oral gavage once daily to
features of the metabolic syndrome and NASH with                 all animals in G3 and G4 whereas G1 and G2 animals were
progressive fibrosis [20]. The FFD comprised of high             given drinking water. Further, 15 g fructose was mixed in
saturated fats, cholesterol and fructose, and mimicked the       100 ml drinking water for all G3 and G4 animals. Group
metabolic profile in NAFLD including obesity and insulin         G2 and G4 were administered CCl4 (assay purity: >98%) at
resistance, along with features of NASH such as increased        0.5 ml/kg B.wt by oral gavage after dissolving in corn oil
inflammation, fibrosis, ER stress and lipoapoptosis.             once weekly for the first two weeks and then on alternate
The model showed significant physiological similarity            weeks thereafter (i.e., 4th, 6th and 8th week). Food
to human NASH but took 24 weeks to develop all                   consumption and body weight were measured weekly for
the histological features [20].                                  all animals during the experimental period.
  Here, we report the development of a novel combination            The experimental period was 8 weeks and the last
rat model for NAFLD established by modifying the FFD             CCl4 dose was administered 48 h prior to sacrificing the
[20] and administering a micro dose (0.5 ml/kg bwt) of           animals. All animals were fasted overnight and body weight
CCl4 recapitulating steatosis, steatohepatitis and fibrosis in   was measured. Blood was collected from the orbital sinus
an accelerated manner (8 weeks). The serum biochemical           under isoflurane anesthesia; serum was separated and
profile of the FFD-CCl4 model showed an increase in liver        subjected for clinical chemistry studies. Animals were
injury and fibrosis when compared to FFD alone,                  sacrificed and necropsied, the liver was excised immedi-
CCl4 alone or the chow diet control animals along                ately, weighed and taken to estimate liver triglyceride
with significant increase in liver TG, inflammation and          (TG), glutathione (GSH) and thiobarbituric acid reactive
oxidative stress in the FFD-CCl4 model. Importantly, gene        substances (TBARS) and gene expression profile using
expression markers of fibrosis were significantly elevated       RT-PCR. The rest was preserved, for histology, in 10%
in the FFD-CCl4 model when compared to FFD or CCl4               phosphate-buffered formalin.
alone or the chow diet control animals, which was further
confirmed by histological staining using H&E as well as          Clinical chemistry and biomarker analysis
assessment of collagen deposition using Trichome and             Serum levels of Aspartate transaminase (AST), Alanine
Sirius red techniques. In summary, we find that the              transaminase (ALT), Alkaline phosphatase (ALP), trigly-
FFD-CCl4 rat model, in 8 weeks, developed NAFLD                  ceride (TG), total bilirubin, Gamma-glutamyl transpepti-
histological features including, steatosis, inflammation         dase (GGT) were measured in automated bio- analyzer
and fibrosis.                                                    EM360 (Transasia Bio-medicals Ltd) using ERBA
                                                                 Mannheim kits (Transasia Bio-medicals Ltd, India).
Methods                                                          Serum procollagen type III levels were measured as per
Compliance with ethical requirements                             manufacturer's instructions using the PIIINP ELISA kit
The study protocol, animal maintenance, and experimental         manufactured by USCN Life Science Inc.
procedures were approved by the Institutional Animal
Ethics Committee (IAEC) of Connexios Life Sciences. All          Assessment of liver triglyceride, glutathione and TBARS
institutional and national guidelines for the care and use       100 mg of liver sample was collected in 1 ml PBS
of laboratory animals were followed. This article does not       (pH 7.4) and lysed using a tissue lyser (25 Hz for 5 min).
contain any studies with human subjects.                         Liver TG was extracted as per Folch’s method. Briefly,
                                                                 0.3 ml of 10% liver homogenate was extracted in 1.5 ml
Development of animal model                                      of chloroform: methanol (2:1) and the organic layer was
Ten week old Wistar rats (Charles River Labs, USA)               dried in a vacuum dryer. The residue was re-suspended in
were used. Animals were housed in groups of three                absolute isopropyl alcohol and TG levels were esti-
in polypropylene cages and maintained at 23 ± 1°C at             mated using DiaSys Diagnostic Systems GmbH kit.
60 ± 10% humidity and 12 hour cycles of light and                Levels of total glutathione and TBARS in the liver,
dark with free access to feed and water (ad libitum).            known indicators of oxidative stress, were measured
Animals were randomly assigned to four groups, consisting        as described earlier [21,22].
Chheda et al. BMC Gastroenterology 2014, 14:89 Page 3 of 9
http://www.biomedcentral.com/1471-230X/14/89
Assessment of gene expression profile in liver significant differences between groups, p < 0.05 was
Real-time PCR was used to evaluate expression of COL1A1, considered significant.
TIMP1, ACTA2, and TGFβ as markers of liver fibrosis,
TNFa and osteopontin were studied for inflammation and Results
FABP4 for fatty acid trafficking. All primers were procured Animals on FFD with a micro dose of CCl4 (0.5 ml/Kg B.
from Integrated DNA Technologies, Germany. Total RNA wt, po) showed liver injury and fibrosis in 8 weeks
was extracted from liver using Trizol (Sigma, St. Louis, Livers from all animals on FFD with/without CCl4
MO, USA) followed by chloroform extraction and isopropyl appeared pale, enlarged and showed a significant increase
alcohol precipitation. cDNA was synthesized by reverse in liver weight (p < 0.001) (Table 2). There were no
transcription (ABI, CA, USA) and amplified using changes in liver weight and gross morphology in animals
MESA Green PCR Master Mix (Eurogenetic, Belgium). that were administered CCl4 on chow diet. Across all
The Primers sequence for assessment of gene expression groups, animals did not show any signs of toxicity or
profiles are mentioned in Table 1. overt behavioral changes. All animals on the FFD
with/ without CCl4 animals gained >10% weight compared
Pathology, staging of fibrosis to the chow diet-fed animals without any change in
Formalin-fixed liver samples were paraffin-embedded, weekly food consumption (Additional file 3: Table S3 and
sectioned at 5 μm and stained using hematoxylin and Additional file 4: Table S4).
eosin (H&E) to examine morphology. Masson’s Trichome To estimate liver injury, we compared the serum bio-
and Sirius Red staining techniques were used to assess chemical profiles of the FFD-CCl4 animals to the FFD,
fibrosis. All slides were examined under light microscopy CCl4 and chow diet controls. ALT, AST, GGT and ALP
at low (X10), high (X40) magnification and also at X20. (known serum markers of liver injury) and procollagen
Histological staging were conducted by modification of type III (known serum marker of fibrosis) were significantly
earlier methods [23,24]. Grading and scoring for fatty elevated in the FFD-CCl4 animals compared to the chow
change, hepatocellular ballooning and inflammation was diet controls (Table 3). Serum triglyceride levels were re-
conducted, by a pathologist, Dr. Harish Chandrasekharan, duced significantly in FFD with/ without CCl4. Apart from
who carried out blind-fold evaluation to the study, as the increase in serum triglycerides, animals on a chow diet
described in (Additional file 1: Table S1 and Additional administered a CCl4 micro dose did not show a significant
file 2: Table S2). change in the serum biochemical profile when com-
pared to the chow diet controls. However, we did not
Statistics observe any changes in blood glucose levels under
Data are presented as mean ± SEM. Comparisons among both fasting and fed condition across all the groups
groups were performed with one-way ANOVA followed (data not shown). Taken together, these data indicate
by Dunnett's multiple comparison post-hoc test to identify that the FFD-CCL4 rats show an increase in markers
of liver injury and fibrosis.
Table 1 Primers sequence for assessment of gene In agreement with the liver injury reflected in the serum
expression profiles biochemical profile, liver TG content was significantly
Gene Sequence elevated in FFD and FFD-CCl4 animals (Table 2). Reactive
TGFb1 Forward- TGTGTCCAGGCTCCAAATGT
oxygen species (ROS)-mediated oxidative stress markers
were measured to access liver damage. We observed a
Reverse- AAGGACCTCGGTTGGAAGTG
significant (p < 0.01) depletion in liver glutathione levels in
COL1A1 Forward-TCTCAAGATGGTGGCCGTTA FFD-CCL4 animals compared to FFD and chow diet
Reverse-ATCTGCTGGCTCAGGCTCTT controls. In line with this, liver TBARS was elevated in both
TIMP1 Forward-GGCTCTGAGAAGGGCTACCA FFD and FFD-CCl4 animals (Table 2). Animals on the chow
Reverse-TCGAGACCCCAAGGTATTGC diet did not show a significant change in oxidative stress
Acta2 Forward- GTCCCAGTTGGTGATGATGC
markers with/without CCl4. Thus, along with an increase in
liver injury, the FFD-CCl4 animals also showed an overall
Reverse- GGGCCAAAAGGACAGCTATG
increase in liver steatosis and oxidative stress.
TNFa Forward- GAAACACACGAGACGCTGAA
Reverse- CAGTCTGGGAAGCTCTGAGG Pro-fibrotic and pro-inflammatory pathways are activated
Osteopontin Forward-CCTGACCCATCTCAGAAGCA in the FFD-CCl4 animals
Reverse-GTGGTCATGGCTTTCATTGG To follow up on elevated liver injury and fibrosis
FABP4 Forward-GGCTTCGCCACCAGGAAAG
markers observed in the FFD-CCl4 sera, we studied gene
expression of key genes in inflammation, fibrosis and
Reverse-TTCCACGCCCAGTTTGAAGGA
fatty acid trafficking known to be involved in NAFLD.Chheda et al. BMC Gastroenterology 2014, 14:89 Page 4 of 9
http://www.biomedcentral.com/1471-230X/14/89
Table 2 Effect on liver oxidative stress markers and liver triglyceride levels
Parameters Chow diet control 0.5 ml/Kg B.wt CCl4 FFD FFD + 0.5 ml/kg B.wt CCl4
Liver TG (mg/g tissue) 6.32 ± 0.79 8.73 ± 1.27 17.17 ± 0.96*** 15.49 ± 1.51***
Liver GSH (μg/mg protein) 7.36 ± 0.62 6.81 ± 0.42 6.95 ± 0.45 2.58 ± 1.10**
Liver TBARS (μM/mg protein) 0.56 ± 0.06 0.60 ± 0.064 3.73 ± 0.67*** 2.10 ± 0.29**
Relative Liver weight (g) 2.49 ± 0.04 2.86 ± 0.08 4.77 ± 0.15*** 4.85 ± 0.16***
Data are expressed as mean ± SEM. Statistical significance was determined using one-way ANOVA followed by Dunnett’s multiple comparison post test, **p < 0.01
and ***p < 0.001.
The gene expression levels of FABP4 (protein associated The FFD-CCl4 mice show an increase in steatosis,
with fatty acid uptake, transport and metabolism, impli- hepatocellular ballooning and fibrosis
cated in development of NASH) were significantly Histological examination of liver sections from FFD-CCl4
increased in the FFD-CCl4 animals compared to the animals showed a statistically significant increase in
FFD, CCl4 and chow diet controls (Table 2). Similarly, micro vesicular and macro vesicular steatosis, hepatocellu-
osteopontin, a marker for immune cell activation was lar ballooning and fibrosis compared to the FFD, CCl4
significantly increased in the FFD and FFD-CCl4 animals and chow diet controls (Table 5 and Figure 1). As per
compared to the control animals. In agreement with the scoring system shown in (Additional file 2: Table S2),
this, TGFβ, a well-established marker of fibrosis and we observed moderate infiltration of mononuclear
inflammation, was expressed at significantly higher levels inflammatory cells with predominance of macrophages
in FFD-CCl4 animals compared to the FFD, CCl4 and in both the FFD and FFD-CCl4 animals along with both
chow diet controls. Other markers of extracellular periportal and perivenular steatosis and hepatocellular
matrix (ECM) deposition including COL1A1 and TIMP1 ballooning which are features of steatohepatitis (Figure 2).
also showed a significant increase in the FFD-CCl4 ani- To evaluate collagen distribution, Masson trichome
mals compared to the FFD and chow diet controls and picrosirius red staining were carried out (Table 5
(Table 4). ACTA2 (ECM deposition marker smooth and Figure 1). However, liver sections from FFD and
muscle actin) did not show significant gene expression FFD-CCl4 animals showed increased collagen depos-
changes in FFD, CCl4 or the FFD-CCl4 animals (Table 4). ition with the latter showing moderate-severe collagen
TNFα (proinflammatory cytokine implicated in fibrogenesis) deposition detectable as perisinusoidal fibrosis and
increased both in the FFD and FFD-CCl4 animals. bridging fibrosis (Figure 1). Importantly, this was true
Animals that were administered a CCl4 micro dose for all the animals on the FFD-CCl4 regime. Animals
on the chow diet did not show a significant change on a chow diet with/without CCl4 did not show a sig-
in the expression of key genes in inflammation, fibrosis nificant increase in macro vesicular steatosis, hepato-
and fatty acid trafficking when compared to the chow cellular ballooning and infiltration of inflammatory
diet controls. Similarly, except for the increase in cells (Figure 2).
TNFα, the FFD animals also did not show a change Hepatocellular ballooning, which has been challen-
in the gene expression profile when compared to the ging to establish in animal models of NAFLD, was
chow diet controls. observed in the FFD-CCl4 and the FFD animals but
Together, these data show that the FFD-CCl4 animals not the CCl4-treated animals (Figure 2). Together
show pro-fibrotic and pro-inflammatory changes in these data indicate that the FFD-CCL4 model recapitulates
gene expression which are not shown by FFD or the the steatosis, inflammatory and fibrotic lesions associated
CCl4-treated animals. with NAFLD.
Table 3 Serum biochemical profile
Parameters Chow diet control 0.5 ml/Kg B.wt CCl4 FFD only FFD + 0.5 ml/kg B.wt CCl4
AST (IU/L) 118.0 ± 6.93 126.3 ± 2.85 138.4 ± 6.91* 146.7 ± 6.91**
ALT (IU/L) 54.92 ± 1.25 59.17 ± 0.95 62.73 ± 7.72 69.60 ± 4.15*
ALP (IU/L) 87.67 ± 6.86 102.4 ± 7.44 228.8 ± 38.44*** 227.8 ± 31.62***
GGT (IUL) 0.09 ± 0.04 0.06 ± 0.06 0.00 ± 0.00 3.30 ± 1.17***
Procollagen type III (ng/ml) 5.61 ± 0.61 5.65 ± 0.65 8.29 ± 0.58 14.96 ± 2.19***
Triglycerides (mg/dL) 145.3 ± 14.28 96.72 ± 8.54* 77.17 ± 7.90** 75.43 ± 4.30**
Effect on serum clinical chemistry markers; data are expressed as mean ± SEM. Statistical significance was determined using one-way ANOVA followed by
Dunnett’s multiple comparison post test, *p < 0.05, **p < 0.01 and ***p < 0.001.Chheda et al. BMC Gastroenterology 2014, 14:89 Page 5 of 9
http://www.biomedcentral.com/1471-230X/14/89
Table 4 Gene expression profiles for Fibrosis, inflammation and fatty acid trafficking
Gene Gene expression profile
Chow diet 0.5 ml/Kg B.wt CCl4 FFD FFD + 0.5 ml/kg B.wt CCl4
Fibrosis
TGFβ1 1.02 ± 0.09 1.00 ± 0.05 1.22 ± 0.17 1.69 ± 0.14*
COL1A1 1.08 ± 0.17 1.56 ± 0.21 2.25 ± 0.32 13.05 ± 1.88***
TIMP1 1.00 ± 0.05 0.81 ± 0.04 1.74 ± 0.15 2.41 ± 0.42**
ACTA2 1.08 ± 0.08 1.00 ± 0.05 1.01 ± 0.12 0.87 ± 0.12
Inflammation
TNFα 1.05 ± 0.13 0.62 ± 0.04 3.59 ± 0.75** 1.30 ± 0.23*
Osetopontin 1.10 ± 0.34 0.86 ± 0.21 5.43 ± 1.14 9.79 ± 2.43**
Fatty acid trafficking
FABP4 1.05 ± 0.15 1.59 ± 0.28 5.63 ± 0.57 45.46 ± 8.64***
Gene expression TGFB1, COlA1, TIMP1, Acta2, TNFa, FABP4 levels in liver; all data are expressed as mean ± SEM. The data measured by quantitative real-time
RT-PCR was statistically analyzed for significant using one-way ANOVA followed by Dunnett’s multiple comparison post test, *p < 0.05, **p < 0.01 and ***p < 0.001.
Discussion steatosis, inflammation and fibrosis stages of NAFLD.
NAFLD is a spectrum of disorders ranging from fatty We used CCl4 micro dosing to induce oxidative stress
liver (steatosis), NASH and fibrosis resulting in cirrhosis and inflammation without causing overt hepatotoxic
[25,26]. Several animal models have been developed to effects. In course of our studies, we had tested a micro
study NAFLD pathogenesis and screen for therapeutics. dose of 1 ml/kg bwt CCl4 (unpublished data). However,
These animal models vary by way of nature of pathology this resulted in mortality leading us to reduce the dose
and evolution of fibrosis [6-19]. Animal models commonly to 0.5 ml/kg bwt. In this study, we modified the published
used to study NAFLD include the high fat diet-induced, FFD composition [20] by increasing the amount of
FFD mouse and CCl4-induced liver injury models fructose used in drinking water to mimic a metabolic
[16,17,27-29]. The FFD mouse model develops features of overload [32-34] and accelerate disease progression. As
human NAFLD. However, it takes about 6 months to expected, all FFD-CCl4 animals showed an increase in
establish histological features [20]. Acute/ chronic exposure liver injury, fibrosis and oxidative stress confirmed by
to CCl4 has shown elevated serum liver enzymes, steatosis, changes in serum AST, ALT, GGT, ALP; Procollagen III,
centrilobular necrosis, increased liver weight and fibrosis/ and liver GSH and TBARS [35-37], respectively. This was
cirrhosis. However the CCL4-induced fibrosis model is very consistent with previous models of CCl4-induced fibrosis
severe and associated with peritonitis, necrosis and and the FFD mouse model [20,31,38,39].
lack of consistent development of fibrosis [19]. Chronic Serum triglyceride levels were reduced significantly in
CCl4 treatment (>2 weeks), on the other hand, is known FFD with/ without CCl4. This decrease is a distinctive
to invoke adaptive mechanisms, reducing vulnerability feature of CCl4 which rapidly increases the triglyceride
to oxidative stress and hepatocellular damage with accumulation in the liver due to a failure in their
restorative macrophages showing potential to reverse secretory mechanisms [31,39] and also increased uptake
fibrosis upon CCl4 withdrawal [28,30,31]. of triglycerides into the liver. We observed, in 8 weeks, an
In the current study, we present a rat model of increase in liver TG, fatty acid trafficking, inflammation
NAFLD developed over 8 weeks on a modified FFD with and fibrosis, which was in consistence with earlier
a CCL4 micro dose (0.5 ml CCl4/kg bwt) that captures findings where the increase in gene expression of FABP4
Table 5 Scores of liver from chow diet, FFD and FFD-CCl4
Histological scores Chow diet control 0.5 ml/Kg B.wt CCl4 FFD FFD + 0.5 ml/kg B.wt CCl4
Fibrosis 00 ± 00 00 ± 00 0.92 ± 0.12*** 2.30 ± 0.21***
Steatosis – micro vesicular 0.33 ± 0.14 0.75 ± 0.13 2.00 ± 0.21*** 2.60 ± 0.16***
Steatosis – macro vesicular 00 ± 00 00 ± 00 1.92 ± 0.19*** 2.50 ± 0.17***
Hepatocellular ballooning 00 ± 00 0.25 ± 0.13 1.00 ± 0.17*** 1.50 ± 0.17***
Inflammation 0.75 ± 0.22 1.00 ± 0.25 1.75 ± 0.22** 2.00 ± 0.26**
All data are expressed as mean ± SEM. The data was statistically analyzed for significant using one-way ANOVA followed by Dunnett’s multiple comparison post
test, **p < 0.01 and ***p < 0.001.Chheda et al. BMC Gastroenterology 2014, 14:89 Page 6 of 9 http://www.biomedcentral.com/1471-230X/14/89 Figure 1 Hematoxylin-Eosin (H&E, 1st and 2nd rows), Masson’s trichrome (3rd and 4th rows) and Sirius red (5th and 6th rows) – stained sections of liver tissues from chow diet, chow diet + 0.5 ml/Kg B.wt CCl4, fast food diet (FFD), FFD + 0.5 ml/Kg B.wt CCl4 fed animals on 8th week. There was no steatosis, hepatocellular ballooning or fibrosis in animals fed with chow diet. Mild micro-vesicular fatty changes and mild hepatocellular ballooning, without fibrosis observed in animals fed with chow diet + 0.5 ml/Kg B.wt CCl4. Fast food fed animals without CCl4 showing moderate micro-vesicular and macro-vesicular fatty changes, hepatocellular ballooning and minimal perisinusoidal fibrosis. FFD + 0.5 ml/Kg B.wt CCl4 fed animals showing severe micro-vesicular and macro-vesicular fatty changes with significant hepatocellular ballooning and prominent perisinusoidal, pericellular region with extensive distribution and bridging fibrosis. All liver sections were evaluated at X10 (low-magnification) and X40 (high-magnification).
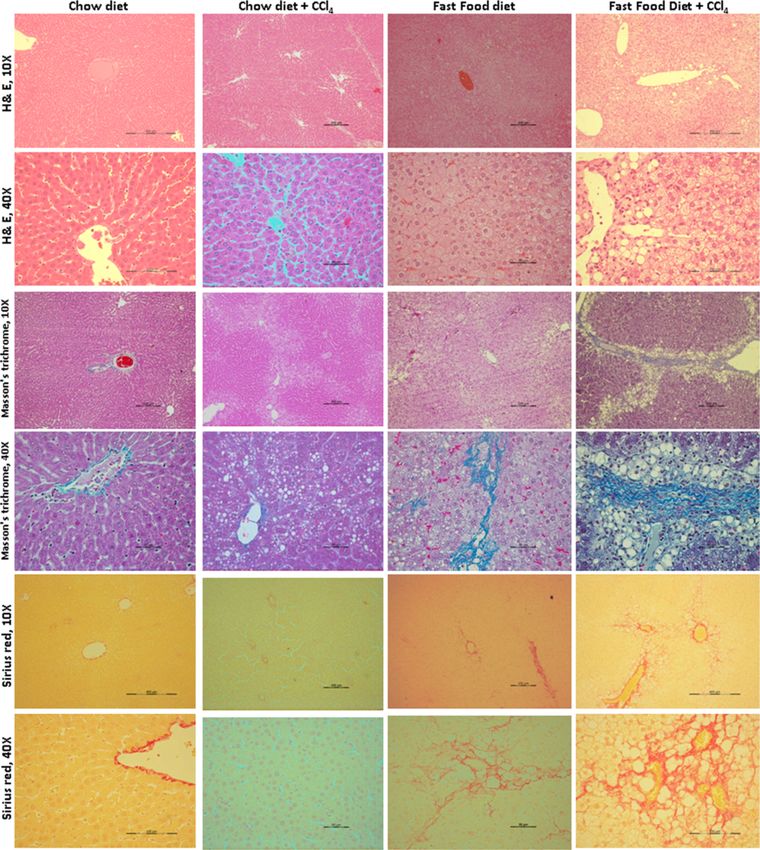
Chheda et al. BMC Gastroenterology 2014, 14:89                                                                                           Page 7 of 9
http://www.biomedcentral.com/1471-230X/14/89

 Figure 2 Row1: Hematoxylin-Eosin (H&E) stained sections of liver tissues from chow diet, chow diet + 0.5 ml/Kg B.wt CCl4, fast food diet
 (FFD), FFD + 0.5 ml/Kg B.wt CCl4 fed animals on 8th week. Liver section showing moderate infiltration of inflammatory cells (shown by black
 arrows) in fast food fed animals with and without CCl4 along with moderate micro-vesicular and macro-vesicular fatty changes and hepatocellular
 ballooning. Mild inflammation was observed in animals fed with chow diet + 0.5 ml/Kg B.wt CCl4. Row2: Hematoxylin-Eosin (H&E) stained sections
 of liver tissues. Liver sections showing increased hepatocellular ballooning in fast food fed animals with and without CCl4 along with moderate
 micro-vesicular and macro-vesicular fatty changes. All liver sections are represented at X40 (high-magnification).

(marker of fatty acid trafficking), osteopontin (marker of                  a variety of stimuli, thus animals fed a high-fat diet for
inflammation), COL1A1 and TIMP1 (markers of fibrosis)                       more than 24 weeks are associated with their susceptibility
[40,41], which have been reported and duration for                          to diet-induced obesity that develop steatohepatitis. In the
appearance of liver fibrosis was 24 weeks. In the current                   current model, FFD along with micro dose CCl4 provoke
study, the liver histological lesions showed all the fea-                   an array of responses that results in hepatocellular balloon-
tures of NAFLD in animals treated with FFD-CCl4.                            ing, inflammation, and fibrosis. Hepatocellular ballooning
Development of steatosis is largely due to increased                        has been difficult to establish but was shown recently in
rate of import or synthesis of fatty acids by hepatocytes                   the FFD mouse by Charlton et al. [20]. In our study,
that exceeds the rate of export or catabolism [42-44].                      Masson trichome and picrosirius red staining techniques
Steatosis thus developed has an inflammatory response                       revealed increased collagen deposition in the form of
which may be precipitated by a variety of stimuli such as                   pericellular and bridging fibrosis. The necroinflammatory
oxidative stress and pro-inflammatory cytokine mediated                     foci showed mononuclear infiltration with predominance
hepatocyte injury progressing to NASH [43-46].                              of macrophages. Further, expression levels of pro-fibrotic
  Considering how this model is distinct from previous                      and pro-inflammatory gene, TGFβ1 increased along
models of NAFLD is important and we find that the                           with COL1A1 mRNA levels. Curiously, ACTA2 (ECM
FFD-CCl4 rat model recreates in 8 weeks most histological                   deposition marker smooth muscle actin) did not show
lesions seen in the FFD mouse [20,47,48] with the excep-                    significant gene expression changes in FFD, CCl4 or the
tion of a change in serum glycemic/lipid profiles. This                     FFD-CCl4 animals and needs to be further assessed for
model has not shown features of metabolic syndrome thus                     changes in protein expression.
this model does not exactly mimic human NAFLD. The                            Interestingly, during model development, we observed
FFD mouse established by Charlton et al. [20], showed                       a gender bias for NAFLD development with females being
features of metabolic syndrome with hepatocellular                          more susceptible than males. Further studies will be re-
ballooning and progressive fibrosis which makes it a good                   quired to understand the mechanistic reasons for this sus-
model that mimics human NAFLD but it takes more than                        ceptibility seen in females and also to precisely understand
6 months. In the FFD-CCl4 model, although we were                           the rate of progression of NAFLD in this model. For
unable to detect insulin resistance or hyprinsulinemia, we                  example, assessing steatosis, inflammation and fibrosis
observed steatosis, inflammation and fibrosis associated                    across 8 weeks at regular intervals will allow for a
with NAFLD in 8 weeks.                                                      more accurate interpretation of when these histological
  A significant aspect of this model is that it is able to                  lesions develop. This could then be potentially used to
replicate hepatocellular ballooning and fibrosis in 8 weeks.                identify candidate biomarkers for progression of disease
Developing a rapid fibrosis model in short duration require                 from steatosis to steatohepatitis to fibrosis.
Chheda et al. BMC Gastroenterology 2014, 14:89                                                                                                             Page 8 of 9
http://www.biomedcentral.com/1471-230X/14/89

Conclusions                                                                              remodeling in high-carbohydrate, high-fat diet-fed rats. J Nutr 2011,
In summary, we present a fatty liver-induced model of                                    141(6):1062–1069.
                                                                                   6.    Fan CY, Pan J, Chu R, Lee D, Kluckman KD, Usuda N: Hepatocellular and
hepatic fibrosis, which captures steatosis, inflammation                                 hepatic peroxisomal alterations in mice with a disrupted peroxisomal
and fibrosis seen in NAFLD. This model holds promise                                     fatty acyl-coenzyme A oxidase gene. J Biol Chem 1996, 271:24698–24710.
as a tool for screening for NAFLD therapeutics including                           7.    Cook WS, Jain S, Jia Y, Cao WQ, Yeldandi AV, Reddy JK: Peroxisome
                                                                                         proliferator-activated receptor alpharesponsive genes induced in the
liver anti-fibrotics.                                                                    newborn but not prenatal liver of peroxisomal fatty acyl-CoA oxidase
                                                                                         null mice. Exp Cell Res 2001, 268:70–76.
Additional files                                                                   8.    Lu SC, Alvarez L, Huang ZZ, Chen L, An W, Corrales FJ: Methionine
                                                                                         adenosyltransferase 1A knockout mice are predisposed to liver injury
                                                                                         and exhibit increased expression of genes involved in proliferation.
 Additional file 1: Table S1. Scheme used for histological staging of                    Proc Natl Acad Sci U S A 2001, 98:5560–5565.
 fibrosis modified from Kleiner et al., [23].                                      9.    Xu Z, Chen L, Leung L, Yen TS, Lee C, Chan JY: Liver specific inactivation
 Additional file 2: Table S2. Scheme used for histological scoring,                      of the Nrf1 gene in adult mouse leads to nonalcoholic steatohepatitis
 modified Kleiner et al., [23] and Kawasaki T et al., [24].                              and hepatic neoplasia. Proc Natl Acad Sci U S A 2005, 102:4120–4125.
 Additional file 3: Table S3. Body weight data of chow diet, CCL4, FFD             10.   Sato W, Horie Y, Kataoka E, Ohshima S, Dohmen T, Iizuka M: Hepatic gene
 and FFD-CCl4. All data are expressed as mean ± SEM. The data was                        expression in hepatocyte-specific Pten deficient mice showing steatohepatitis
 statistically analyzed for significant using one-way ANOVA followed by                  without ethanol challenge. Hepatol Res 2006, 34:256–265.
 Dunnett’s multiple comparison post test.                                          11.   Brix AE, Elgavish A, Nagy TR, Gower BA, Rhead WJ, Wood PA: Evaluation of
                                                                                         liver fatty acid oxidation in the leptin-deficient obese mouse. Mol Genet
 Additional file 4: Table S4. Feed consumption data of chow diet,                        Metab 2002, 75:219–226.
 CCL4, FFD and FFD-CCl4.                                                           12.   Wortham M, He L, Gyamfi M, Copple BL, Wan YJ: The transition from fatty
                                                                                         liver to NASH associates with SAMe depletion in db/db mice fed a
Abbreviations                                                                            methionine choline-deficient diet. Dig Dis Sci 2008, 53:2761–2774.
ACTA2: Alpha-actin-2; ALP: Alkaline phosphatase; ALT: Alanine transaminase;        13.   Dela Pena A, Leclercq I, Field J, George J, Jones B, Farrell G: NF-kappaB
AST: Aspartate transaminase; AOX: Acyl-CoA oxidase; CCl4: Carbon                         activation, rather than TNF, mediates hepatic inflammation in a murine
Tetrachloride; COL1A1: Collagen, type I, alpha 1; ECM: Extracellular matrix;             dietary model of steatohepatitis. Gastroenterology 2005, 129:1663–1674.
FABP4: Fatty acid binding protein 4; FFD: fast food diet; GGT:                     14.   Deng QG, She H, Cheng JH, French SW, Koop DR, Xiong S: Steatohepatitis
Gamma-glutamyl transpeptidase; MAT1A: Methionine adenosyltransferase                     induced by intragastric overfeeding in mice. Hepatology 2005,
1A; NAFLD: Non-alcoholic fatty liver disease; PIIINP: Procollagen III N-Terminal         42:905–914.
Propeptide; PTEN: Phosphatase and tensin homolog; SEM: Standard error              15.   Zou Y, Li J, Lu C, Wang J, Ge J, Huang Y, Zhang L, Wang Y: High fat
mean; TBARS: Thiobarbituric acid reactive substances; TG: Triglyceride;                  emulsion-induced rat model of nonalcoholic steatohepatitis. Life Sci 2006,
TGFβ: Transforming growth factor beta; TIMP1: Tissue inhibitor of                        79:1100–1107.
metalloproteinase 1; TNFα: Tumor necrosis factor alpha.                            16.   Fujii T, Fuchs BC, Yamada S, Lauwers GY, Kulu Y, Goodwin JM, Lanuti M,
                                                                                         Tanabe KK: Mouse model of carbon tetrachloride induced liver fibrosis:
Competing interests                                                                      Histopathological changes and expression of CD133 and epidermal
Tarak K Chheda, Pratibha Shivakumar, Satish Kumar Sadasivan, Vijayragav                  growth factor. BMC Gastroenterol 2010, 10:79.
Dasarahalli Nagaraju, Harish Chanderasekharan, Yogananda Moolemath,                17.   Hunter AL, Holscher MA, Neal RA: Thioacetamide-induced hepatic
Anup Mammen Oommen, Jagannath R Madanahalli, Venkataranganna V                           necrosis. I. Involvement of the mixed-function oxidase enzyme system.
Marikunte declare that they have no conflict of interest.                                J Pharmacol Exp Ther 1977, 200(2):439–448.
                                                                                   18.   Tetri LH, Basaranoglu M, Brunt EM, Yerian LM, Neuschwander-Tetri BA:
Authors’ contributions                                                                   Severe NAFLD with hepatic necroinflammatory changes in mice fed
YM, AMO, VVM designed the research; TKC, PS, SKS, HC, performed the                      trans fats and a high-fructose corn syrup equivalent. Am J Physiol
research; YM, VVM, JRM wrote the paper.                                                  Gastrointest Liver Physiol 2008, 295(5):G987–95.
                                                                                   19.   Starkel P, Leclercq IA: Animal models for the study of hepatic fibrosis.
Acknowledgements                                                                         Best Pract Res Clin Gastroenterol 2011, 25(2):319–333.
We would like to extend our gratitude to Roopesh Marulasiddeshwara, Usha           20.   Charlton M, Krishnan A, Viker K, Sanderson S, Cazanave S, McConico A, Masuoko
Narayanan, and Geeta Nirody for their contribution towards the manuscript                H, Gores G: Fast food diet mouse: novel small animal model of NASH with
preparation.                                                                             ballooning, progressive fibrosis, and high physiological fidelity to the human
                                                                                         condition. Am J Physiol Gastrointest Liver Physiol 2011, 301(5):G825–G834.
Author details                                                                     21.   Akerboom TP, Sies H: Assay of glutathione, glutathione disulfide, and
1                                                                                        glutathione mixed disulfides in biological samples. Methods Enzymol
 Preclinical Development, Connexios Life Sciences Pvt Ltd., Bangalore, India.
2                                                                                        1981, 77:373–382.
 Systems Biology Group, Connexios Life Sciences Pvt Ltd., Bangalore, India.
3                                                                                  22.   Ohkawa H, Ohishi N, Yagi K: Assay for lipid peroxides in animal tissues by
 Drug Discovery Group, Connexios Life Sciences Pvt Ltd., Bangalore, India.
                                                                                         thiobarbituric acid reaction. Anal Biochem 1979, 95:351–358.
Received: 6 November 2013 Accepted: 6 May 2014                                     23.   Kleiner DE, Brunt EM, Van Natta M, Behling C, Contos MJ, Cummings OW,
Published: 10 May 2014                                                                   Ferrell LD, Liu YC, Torbenson MS, Unalp-Arida A, Yeh M, McCullough AJ,
                                                                                         Sanyal AJ: Design and validation of a histological scoring system for
References                                                                               nonalcoholic fatty liver disease. Hepatology 2005, 41:1313–1321.
1. Kim CH, Younossi ZM: Nonalcoholic fatty liver disease: a manifestation of       24.   Kawasaki T, Igarashi K, Koeda T, Sugimoto K, Nakagawa K, Hayashi S, Yamaji R,
    the metabolic syndrome. Cleve Clin J Med 2008, 75(10):721–728.                       Inui H, Fukusato T, Yamanouchi T: Rats fed fructose-enriched diets have
2. Sass DA, Chang P, Chopra KB: Nonalcoholic fatty liver disease: a clinical             characteristics of nonalcoholic hepatic steatosis. J Nutr 2009, 139(11):2067–71.
    review. Dig Dis Sci 2005, 50(1):171–180.                                       25.   Farrell GC, Larter CZ: Nonalcoholic fatty liver disease: from steatosis to
3. Bellentani S, Scaglioni F, Marino M, Bedogni G: Epidemiology of                       cirrhosis. Hepatology 2006, 43(2 Suppl 1):S99–S112.
    non-alcoholic fatty liver disease. Dig Dis 2010, 28:155–161.                   26.   Paschos P, Paletas K: Non alcoholic fatty liver disease and metabolic
4. Milić S, Štimac D: Nonalcoholic fatty liver disease/steatohepatitis:                  syndrome. Hippokratia 2009, 13(1):9–19.
    epidemiology, pathogenesis. Clinical presentation and treatment. Dig Dis       27.   Ramachandran P, Pellicoro A, Vernon MA, Boulter L, Aucott RL, Ali A, Hartland
    2012, 30:158–162.                                                                    SN, Snowdon VK, Cappon A, Gordon-Walker TT, Williams MJ, Dunbar DR,
5. Panchal SK, Poudyal H, Arumugam TV, Brown L: Rutin attenuates                         Manning JR, Van Rooijen N, Fallowfield JA, Forbes SJ, Iredale JP: Differential
    metabolic changes, nonalcoholic steatohepatitis, and cardiovascular                  Ly-6C expression identifies the recruited macrophage phenotype, which
Chheda et al. BMC Gastroenterology 2014, 14:89 Page 9 of 9
http://www.biomedcentral.com/1471-230X/14/89
orchestrates the regression of murine liver fibrosis. Proc Natl Acad Sci U S A
2012, 109(46):E3186–E3195.
28. Tsukamoto H, Matsuoka M, French SW: Experimental models of hepatic
fibrosis: a review. Semin Liver Dis 1990, 10:56–65.
29. Constandinou C, Henderson N, Iredale JP: Modeling liver fibrosis in
rodents. Methods Mol Med 2005, 117:237–250.
30. Radice S, Marabini L, Gervasoni M, Ferraris M, Chiesara E: Adaptation to
oxidative stress: effects of vinclozolin and iprodione on the HepG2 cell
line. Toxicology 1998, 129:183–191.
31. Shi J, Aisaki K, Ikawa Y, Wake K: Evidence of hepatocyte apoptosis in rat
liver after the administration of carbon tetrachloride. Am J Pathol 1998,
153(2):515–525.
32. Abdelmalek MF, Suzuki A, Guy C, Unalp-Arida A, Colvin R, Johnson RJ, Diehl
AM: Increased fructose consumption is associated with fibrosis severity in
patients with nonalcoholic fatty liver disease. Hepatology 2010,
51:1961–1971.
33. Ouyang X, Cirillo P, Sautin Y, McCall S, Bruchette JL, Diehl AM, Johnson RJ,
Abdelmalek MF: Fructose consumption as a risk factor for non-alcoholic
fatty liver disease. J Hepatol 2008, 48:993–999.
34. Williams CD, Stengel J, Asike MI, Torres DM, Shaw J, Contreras M, Landt CL,
Harrison SA: Prevalence of nonalcoholic fatty liver disease and
nonalcoholic steatohepatitis among a largely middle aged population
utilizing ultrasound and liver biopsy: a prospective study.
Gastroenterology 2011, 140:124–131.
35. Han D, Hanawa N, Saberi B, Kaplowitz N: Mechanisms of liver injury. III
Role of glutathione redox status in liver injury. Am J Physiol Gastrointest
Liver Physiol 2006, 291(1):G1–G7.
36. Fraga CG, Leibovitz BE, Tappel AL: Lipid peroxidation measured as
thiobarbituric acid-reactive substances in tissue slices: characterization
and comparison with homogenates and microsomes. Free Radic Biol Med
1988, 4(3):155–161.
37. Bezerra FJ, Rezende AA, Rodrigues SJ: Almeida Md: Thiobarbituric acid
reactive substances as an index of lipid peroxidation in sevoflurane-treated
rats. Rev Bras Anestesiol 2004, 54(5):640–649.
38. Hu Bscher SG: Histological assessment of non-alcoholic fatty liver disease.
Histopathology 2006, 49:450–465.
39. Hamdy N, El-Demerdash E: New therapeutic aspect for carvedilol: antifibrotic
effects of carvedilol in chronic carbon tetrachloride-induced liver damage.
Toxicol Appl Pharmacol 2012, 261(3):292–299.
40. Greco D, Kotronen A, Westerbacka J, Puig O, Arkkila P, Kiviluoto T, Laitinen S,
Kolak M, Fisher RM, Hamsten A, Auvinen P, Yki-Järvinen H: Gene expression
in human NAFLD. Am J Physiol Gastrointest Liver Physiol 2008,
294(5):G1281–G1287.
41. Sahai A, Malladi P, Melin-Aldana H, Green RM, Whitington PF: Upregulation of
osteopontin expression is involved in the development of nonalcoholic
steatohepatitis in a dietary murine model. Am J Physiol Gastrointest Liver
Physiol 2004, 287(1):G264–G273.
42. Plaa GL: Chlorinated methanes and liver injury: highlights of the past
50 years. Annu Rev Pharmacol Toxicol 2000, 40:42–65.
43. Weber LW, Boll M, Stampfl A: Hepatotoxicity and mechanism of action of
haloalkanes: carbon tetrachloride as a toxicological model. Crit Rev
Toxicol 2003, 33:105–136.
44. Koteish A, Diehl AM: Animal models of steatosis. Semin Liver Dis 2001,
21:89–104.
45. Bradbury MW, Berk PD: Lipid metabolism in hepatic steatosis. Clin Liver Dis
2004, 8:639–671.
46. Anstee QM, Goldin RD: Mouse models in non-alcoholic fatty liver disease
and steatohepatitis research. Int J Exp Pathol 2006, 87:1–16.
47. Day CP, Saksena S: Non-alcoholic steatohepatitis: definitions and Submit your next manuscript to BioMed Central
pathogenesis. J Gastroenterol Hepatol 2002, 17(Suppl 3):S377–S384. and take full advantage of:
48. Marra F, Gastaldelli A, Svegliati Baroni G, Tell G, Tiribelli C: Molecular basis
and mechanisms of progression of nonalcoholic steatohepatitis. • Convenient online submission
Trends Mol Med 2008, 14:72–81.
• Thorough peer review
doi:10.1186/1471-230X-14-89 • No space constraints or color figure charges
Cite this article as: Chheda et al.: Fast food diet with CCl4 micro-dose • Immediate publication on acceptance
induced hepatic-fibrosis –a novel animal model. BMC Gastroenterology
2014 14:89. • Inclusion in PubMed, CAS, Scopus and Google Scholar
• Research which is freely available for redistribution
Submit your manuscript at
www.biomedcentral.com/submitYou can also read