Feasibility Study Central Texas Food Hub - for a - AustinTexas.gov
←
→
Page content transcription
If your browser does not render page correctly, please read the page content below
Feasibility Study
         for a
Central Texas Food Hub
Project Team
    Andrea Abel, Executive Director                             Judith McGeary, Esquire
    Farmshare Austin                                            Farm and Ranch Freedom Alliance
    Sue Beckwith, Executive Director                            Mike Morris, Southwest Director
    Texas Center for Local Food                                 National Center for Appropriate Technology
    Joy Casnovsky, MPAff, Deputy Director                       Carolina Mueller, Food Access Manager
    Sustainable Food Center                                     Farmshare Austin
    Rebekka Dudensing, PhD.                                     Curt Nelson, Co-Founder
    Texas A&M AgriLife Extension                                Austin Foodshed Investors
    Adrienne Haschke, MS, RD, Farm Direct Director              Robin O’Neil, Development and Grants Manager
    Sustainable Food Center                                     Sustainable Food Center
    Annelies Lottman, Lead of Central Texas Office              Sarah Prager, MPH, Farm Direct Projects Manager
    Texas Rural Cooperative Center                              Sustainable Food Center
    Robert Maggiani, Sustainable Ag Specialist                  Thomas Schroeder, Conservation Ranching Program Manager
    National Center for Appropriate Technology                  National Audubon Society
    Edwin Marty, Food Policy Manager                            (formerly with the National Center for Appropriate Technology)
    City of Austin                                              Danika Trierweiler, RD, Midwest Sustainability Coordinator
                                                                Greener Fields Together, ProACT
                                                                (formerly with Sustainable Food Center)

                                                    Prepared by the
                                                Sustainable Food Center
                                               sustainablefoodcenter.org
                                                      January 2019

                                                  Acknowledgments
    Ava Cameron, Texas Center for Local Food                    Mary Lightsey, Lightsey Farm
    Alex Canepa, Sustainable Food Center                        Vernon Lockridge, Farmer
    Skip Connett, Green Gate Farms                              Amanda Rohlich, City of Austin, Office of Sustainability
    Evan Driscoll, Austin Foodshed Investors                    Gail Rothe, Confluence Consulting, LLC
    Carol Fraser, UT School of Architecture                     Pedro Schambon, My Father’s Farm
    Jamey Gage, B5 Farms                                        Chris Schreck, Capital Area Council of Governments
    Ron Hagelman, Texas State, Dept of Geography                Elliott Smith, Go Austin/Vamos Austin
    Lorig Hawkins, Middle Ground Farm                           (previously with Travis County)
                                                                Billy Wright, Wright Ranch Enterprises

Funding for Feasibility for a Central Texas Food Hub was made possible by the U.S. Department of Agriculture’s (USDA)
Agricultural Marketing Service through grant AM170100XXXXG089. Its contents are solely the responsibility of the
authors and do not necessarily represent the official views of the USDA.

                                                     SUSTAINABLE FOOD CENTER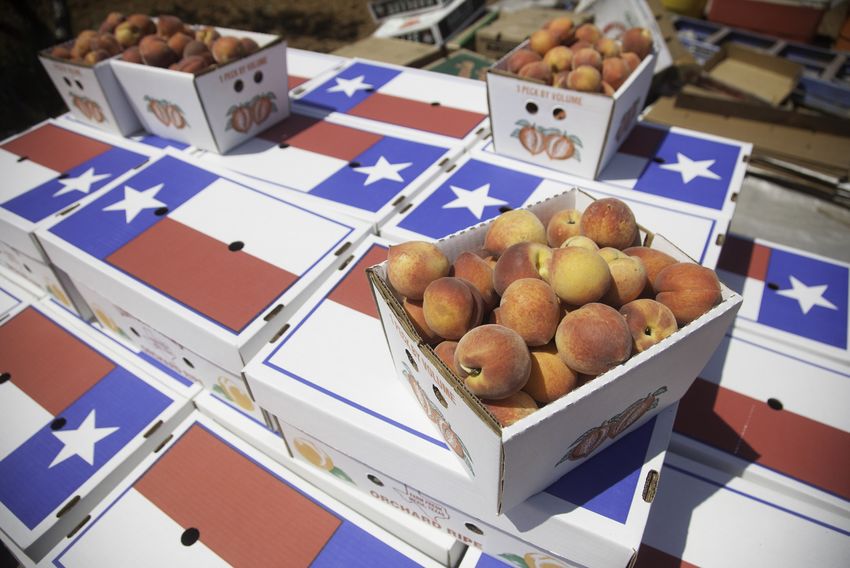
Table of Contents
Executive Summary....................................................... 1                       External Environment...................................................... 29
                                                                                                    National Policies and Initiatives.................................... 29
Introduction................................................................... 3
                                                                                                    Statewide Policies and Initiatives.................................. 30
   Scope................................................................................. 4
                                                                                                    City and County Initiatives............................................ 31
   Background........................................................................ 5
                                                                                                    Opportunities and Threats........................................... 33
      Texas, a State of Agriculture........................................... 5
                                                                                                    Farmshare Austin Micro-Hub Pilot Program–
      Regional Demographics.................................................. 6
                                                                                                    Lessons Learned .......................................................... 35
      National Food Hub Scene............................................... 8
                                                                                                 Discussion.........................................................................37

Supply and Demand Analysis........................................ 10
                                                                                              Conclusions and Recommendations.............................. 39
   Methodology................................................................... 10             Recommendations........................................................... 40
      Supply Analysis............................................................. 10         Bibliography................................................................ 44
      Demand Analysis.......................................................... 11            Appendices.......................................................................... 46
   Findings............................................................................ 12       Appendix A: Glossary....................................................... 46
      Producers..................................................................... 12          Appendix B: Producer Survey........................................... 48
      Buyers...........................................................................13        Appendix C: Focus Group Questions................................ 50
      Crops............................................................................ 15       Appendix D: LFPP Buyer Survey....................................... 51
      Production Volume....................................................... 16                Appendix E: Grocery Supply Survey................................. 53
      Market Size....................................................................17          Appendix F: Seasonality Assessment............................... 55
      Producer Certifications and Buyer Requirements......... 18                                 Appendix G: Central Texas Markets Currently Served by
      Additional Findings....................................................... 20                                 Intermediaries............................................. 56

   Discussion........................................................................ 21         Appendix H: USDA Food Hub Operations infographic ..... 57

Landscape Analysis...................................................... 23
   Competitive Analysis........................................................ 23
      Intermediary Characteristics........................................ 24
      Procurement Factors.................................................... 25
      Challenges Working with Local Producers.................... 26
      Strengths and Weaknesses........................................... 27
EXECUTIVE SUMMARY                                                            Central Texas study region
Central Texas is home to a vibrant and growing regional
economy—one with significant market demand for local
and sustainably-grown food. The rapid population growth
driving the economy has also exacerbated pressures on
the local food system, such as the availability of affordable
farmland and the accessibility of fresh food for lower-
income consumers. For example, Travis County, where
Austin is located, loses the equivalent of about six football
fields every single day (eight acres). The entire Central
Texas region (see image to the right; also defined in
Glossary) loses 223 acres of cropland every single day.i
That equates to an area twice the size of New York City
in five years! In addition, of the over 1.1 million residents
living in Travis County, approximately 15.2% experience
food insecurity. It is incumbent upon local food system
stakeholders to develop sustainable market solutions that
benefit producers and consumers alike.

Beginning in October 2017, a team of organizations in Central Texas set out to
determine the feasibility of launching a new brick-and-mortar food hub. The
project team included Sustainable Food Center (SFC), the National Center for
Appropriate Technology (NCAT), Texas Center for Local Food, Farmshare Austin,
and the City of Austin Office of Sustainability. The project team’s goal was to
understand the opportunities and barriers to a physical food hub in Central Texas
that might allow small to mid-sized farms meet larger-volume demand in Austin
and San Antonio, and to build on already existing initiatives to increase healthy
food access for low-income and underserved populations. The study centered on
two key questions: 1) Does Central Texas need something new or additional to
bring more local, sustainably-grown fresh produce into the marketplace? 2) If yes,
then what does that something new or additional look like? The team employed a
three-pronged study design made up of a supply analysis, a demand analysis, and
a landscape analysis to answer the two key questions.

The findings of both supply and demand analyses proved there was common
ground among producers and buyers: producers are interested in diversifying
to wholesale outlets and buyers are interested in purchasing more locally-
grown, sustainable food. In order to provide reliable volumes and quantity
of fresh produce, growers would likely need to aggregate in order to satisfy
large wholesale orders. However, the project team determined that simply
aggregating product would not be enough to ensure the success of a food hub
in Central Texas. Other services would need to be offered to producers and
buyers, either through the hub or outside service-oriented organizations. For
instance, local small to mid-sized producers need greater access to farmland,
more qualified and reliable labor, and wholesale readiness support to plan
crops and determine prices that can meet large volume buyer needs. Large
volume buyers need to know what is grown regionally and when local produce
is seasonally available, as well as guidance to plan menus for local incorporation
and support to purchase from local-oriented vendors.

The project team then assessed intermediary supply chain players and
the external environment in order to understand strengths, weaknesses,
opportunities and potential threats of starting a food hub. Sales to premium

                                  FEASIBILITY STUDY FOR A CENTRAL TEXAS FOOD HUB                          1
direct-to-consumer markets were recognized as an existing strength, along
    with increasing consumer demand for local and sustainably-grown food.
    However, the intermediary supply chain for local growers continues to face
    obstacles towards achieving scalable success, such as inadequate volume
    to move product into institutional markets and the resource-intense nature
    of planning with multiple local growers. Lastly, where the project team saw
    opportunities to tap into public and private funding for food systems, they also
    saw threats stemming from rising infrastructure costs and other local economic
    pressures.

    CONCLUSION AND RECOMMENDATIONS
    The project team concluded that, in Central Texas, multiple assets need to
    be built and/or strengthened in order to bring more local, sustainably-grown
    fresh produce into the marketplace. Physical aggregation is necessary for
    small to mid-sized producers to be able to enter into larger-volume markets.
    However, the competitive analysis highlights existing intermediaries that could
    move into this space more quickly than endeavoring to build a new “brick-
    and-mortar” facility. The project team then identified persistent barriers at
    the farm level and at the large volume buyer level and ultimately recommends
    the actions listed below to strengthen existing aggregation and distribution
    of local, sustainably-grown produce. These actions represent a coordinated
    and collective strategy towards creating a robust, sophisticated and resilient
    regional food system.

                                    Action                                 Timeframe
                                                                            Immediate
    Provide business management & financial consultations for producers.
                                                                           (2019-2020)
                                                                            Near Term
    Build the Elgin Local Food produce processing center.
                                                                           (2021-2023)
                                                                            Immediate
    Matchmaking between producers and market accounts.                     (2019-2020)
                                                                            Immediate
    Assist producers to become wholesale ready.                            (2019-2020)
                                                                            Immediate
    Establish micro-aggregation nodes.                                     (2019-2020)
                                                                            Near Term
    Facilitate land access for agricultural producers.                     (2021-2023)
                                                                            Near Term
    Develop a group purchasing or equipment share for producers.           (2021-2023)
    Assist producers who are interested in transitioning to regenerative    Near Tem
    agricultural practices.                                                (2021-2023)
                                                                            Long Term
    Research the potential of a food industry cluster.                     (2023-2028)
                                                                            Immediate
    Support and outreach for Federal farm programs.                        (2019-2020)
                                                                            Near Term
    Strengthen farm labor force so producers can hire qualified labor.     (2021-2023)

2     FEASIBILITY STUDY FOR A CENTRAL TEXAS FOOD HUB
INTRODUCTION
              1
Central Texas prides itself on a culture of supporting locally-owned, small
businesses and buying locally made products. This community-based approach
to enhancing regional economic prosperity extends to locally-grown food,
value-added products and food retail establishments. The ethos of supporting
local businesses, paired with population growth that routinely tops national
charts, has built a vibrant regional economy and also given rise to significant
latent market demand for local and sustainably-grown food.
Austin has a vibrant farm direct-to-consumer food supply chain, featuring
17 farmers’ markets, almost a dozen direct delivery services and community
supported agriculture (CSA) options and a multitude of locavore chefs who
source directly from growers. San Antonio also has strong direct marketing
outlets, boasting 22 farmers’ markets, direct delivery services, CSA options,
and a number of restaurants that source directly from area farmers. Although
there has been a proliferation of farm direct sales outlets in the past decade,
                                                                                           A    gricultural producers
                                                                                                are struggling with
                                                                                           increasing costs of land
plateauing sales in the past few years have illuminated a certain degree of
niche market saturation. The next logical step is expansion into larger volume             and greater distances to
markets where most consumers get a majority of their food. In essence, expand              markets, while staggering
farmers’ market values to wholesale scale. Many producers in Central Texas and             amounts of farmland are
throughout the state are expressing an interest in scaling up and diversifying
                                                                                           being lost to development.
their market channels to include wholesale. Concurrently, a growing number of
grocers and institutions are prioritizing values-based purchasing decisions with
a preference for sustainable, Texas-grown produce and animal protein.
In addition to increasing demand, rapid population growth has given rise to a
cascade of unintended consequences impacting producers’ ability to grow food
and consumers’ ability to access food. Agricultural producers are struggling
with increasing costs of land and greater distances to markets, while staggering
amounts of farmland are being lost to development. The county where Austin
is located loses eight acres of cropland are per day, which is equivalent to six
football fields. The county where San Antonio is located loses almost 20 acres
of cropland a day, which is equivalent to 15 football fields.i Mounting regional
pressures on small to mid-size growers begets a sense of urgency to strengthen
their sales, fortify their operations and ultimately ensure their business viability.
On the consumer side, many long-time residents are being priced out of their
homes and displaced to areas with uncertain access to healthy, affordable
food. It is incumbent upon local food system stakeholders to recognize and
address these impacts in order to develop sustainable market solutions. Both a
growing population and stagnating rates of food insecurity demand immediate
attention to reach unmet market needs.
Now is an opportune moment to strengthen regional food system production
and procurement by creating pathways for small to mid-sized producers to
sell to wholesale markets that value their differentiated product. This critical
mass of interest is occurring at a time when national trends in food system
development are also emphasizing value chain infrastructure. The project team
saw an opportunity to support the construction of a sophisticated and resilient
local food economy in Central Texas.

1 Central Texas is defined herein as the 23-county region that includes the Austin Metro
Statistical Area, the San Antonio Metro Statistical Area and surrounding rural counties.

                                        FEASIBILITY STUDY FOR A CENTRAL TEXAS FOOD HUB                              3
Scope
    The project team set out to study the opportunities and barriers Central Texas
    farmers face in scaling up to meet demand for large-volume wholesale markets
    in Austin and San Antonio, and to build on healthy food access initiatives in
    Austin. The proposed hypothesis is that most small to mid-sized farmers in
    Texas need physical aggregation and distribution infrastructure in order to sell
    to larger volume markets. Implied within this hypothesis is the assumption
    that there is an opportunity for more transactions to occur between local food
    system partners (i.e. local buyers purchasing from local producers), and that
    the primary obstacle to these kinds of local transactions is a lack of aggregation
    and distribution infrastructure. Producers were defined as specialty crop
    growers within a 400-mile radius of Austin, with particular attention to small
    and mid-sized family farms. The buyers were defined as Institutions (school
    districts, hospitals, Colleges and Universities, corporate cafeterias), Grocery
    Retailers, Sustainable Food Center’s Farm to Work modified-CSA project and
                       2
    the Fresh for Less markets in Austin.

    The team developed the following three research questions to study this
    hypothesis:
    1. Does Central Texas need something new or additional to bring more local,
       sustainably-grown fresh produce into the marketplace in order to strengthen
       the viability of regional producers and improve consumer access to healthy,
       fresh food?
    2. If yes, then what does that something new or additional look like?
    3. Are the project team’s proposed actions feasible, and under what
       conditions?

    In order to answer these questions, we conducted primary and secondary
    quantitative and qualitative research over the course of eight months. The
    following assessments illuminated findings and recommendations which
    address ways in which latent and future demand for local food can be more
    completely met by local supply.

     •      supply analysis assessed existing and potential production capacity,
           A
           producer interest and readiness to sell into wholesale markets, and barriers
           to entry.
     •      demand analysis assessed the potential demand volume, drivers of
           A
           buyer interest in local fresh produce, procurement needs, and barriers to
           purchasing local produce.
     •      landscape analysis assessed the existing landscape of intermediary
           A
           activities, identified internal strengths and weaknesses along with external
           opportunities and challenges, and discovered critical gaps.

    2 Fresh for Less is a City of Austin sponsored initiative that works with several non-profit
    organizations in Austin. The goal of the initiative is to increase access to fresh, affordable food in
    innovative ways, like community-based farm stands, mobile markets and healthy corner stores.

4        FEASIBILITY STUDY FOR A CENTRAL TEXAS FOOD HUB
Background
Texas, a State of Agriculture
AGRICULTURAL LAND USE
Agricultural trends in Texas continue to mirror national trends towards
increasing concentration of production among the largest farms. Although the
total number of vegetable farms in Texas decreased by 2% between 2007 and
2012, the total number of acres in vegetable production actually increased by
1.6%. In 2012, the top 1% of farms in Texas accounted for 35% of total acres
harvested for vegetables. As illustrated in Figure 2, between 2007 and 2012
all farm size categories less than 100 acres saw a decrease in number of farms
(with the exception of an uptick in number of farms under 1 acre). Orchards saw
a 21.2% decrease in number of farms and a 5.3% decrease in total number of
acres during this same period.i
Figure 2: Percent of total farms by # of acres of vegetables harvested,
2007 & 2012
T here’s a disappearing
middle segment of
producers who are too big
to sell direct to consumer
and too small to compete
with mega farms.
The term “Agriculture of the Middle” was recently coined to address this
bifurcation of the US food system.ii Between small-scale enterprises selling
specialty crops through direct marketing channels and very large farm
operations selling commodities to multi-national firms, there’s a disappearing
middle segment of producers who are too big to sell direct to consumer and too
small to compete with mega farms. This is in part due to the fact that producers
face systematic challenges to scaling, including structural economic barriers
and lack of infrastructure supports. Values-based food chains offer approaches
to bridge this divide by building infrastructure and connecting Agriculture of
the Middle farmers with markets that pay a fair price to cover costs. Some
producers surveyed for this study report concerns similar to Agriculture of the
Middle farmers and express interest in transitioning away from time and labor-
intensive direct marketing to wholesale marketing.
A closer look at the Ag Census reveals pockets of agricultural activity that
indicate a resurgence of family farming. Central Texas is notably right in
the heart of one of these pockets. Between 2007 and in 2012, the region
experienced a 14% increase in number of vegetable farms and a 9% increase
in harvested vegetable acres. (See Table 1.) Orchard acreage declined by
6% from 2007 to 2012. Since 90% of orchard acres in Central Texas are in
pecans, further analysis of orchard acres is not included in this study.i
At the same time as this resurgence of family farming in the region, the threat
of fertile farmland loss looms large. Austin and San Antonio are quickly growing
into peri-urban areas. Intense demand for new housing and commercial
development pressures have led to a precipitous 20% decline in area cropland
FEASIBILITY STUDY FOR A CENTRAL TEXAS FOOD HUB 5between 2007 (2,049,086 acres) and 2012 (1,642,163 acres). The amount of
cropland lost in 5 years is twice the size of New York City, and is the equivalent
of losing 223 acres of cropland every single day.i
Table 1: Vegetable acres and cropland totals in Central Texas
2012 351
Total Vegetable Farms
2007 307
2012 21,523
Total Acres of Harvested Vegetables
2007 19,706
2012 1,642,163
Total Acres of Cropland
2007 2,049,086
AGRICULTURAL ECONOMICS
In 2016, the Capital Area Council of Governments (CAPCOG) researched the
3
question “Just how much of what we actually eat (in the CAPCOG region )
comes from local sources?” The study found that, in 2015, food production
sales in the 10-county region exceeded $2.32 billion, which underscores
agriculture’s economic significance to the region. Further analysis shows that
only 6% ($146.6 million) of those local food production sales were actually sold
within this same region.iv This indicates presumable opportunity to shift more
local food production sales into local markets.
Furthermore, the $146.6 million of In-Region food production sales was only
2.7% of total food retail sales in the region ($5.4 billion). Food retail sales is
inherently greater than food production sales, since food retailers need to
cover additional value-added costs such as labor, real estate and building costs.
However, these numbers provide a sense of scale. Less than 3% of what we
spend on food in the Capital Area is actually produced in the same region. If
that figure doubled to 6%, millions and millions of dollars would be kept in the
local economy.
Also of note, the national farm share of every food dollar recently hit an
all-time low, dipping down to 14.8 in 2017.iii Declining revenue does not bode
well for any farm business, yet is particularly worrisome for small to mid-sized
diversified specialty crop growers who operate on razor thin profit margins and
do not receive government price support. It is becoming more and more urgent
for communities across the country to take action and re-invest in their regional
food economies. Central Texas is well positioned to build a vibrant, regional
food economy that strengthens local food production and makes a greater
percentage of that locally-grown food accessible to all residents.
Regional Demographics
Central Texas is currently home to 4.7 million residents, after experiencing
a period of growth throughout the region.v As of 2017, the top five most
Farm to Work at the populated counties,vi in order, are:
Stephen F. Austin Building
Photo credit: Chris Lifford
1. Bexar County (the county in which San Antonio is located)
2. Travis County (the county in which Austin is located)
3. Williamson County (a.k.a. “North Austin” directly North of Travis County)
4. Hays County (a.k.a. “South Austin” directly South of Travis County)
5. Guadalupe County (Northeast of San Antonio)
3 The 10-county region including and surrounding Austin MSA: Bastrop, Blanco, Burnet,
Caldwell, Fayette, Hays, Lee, Llano, Travis and Williamson Counties
6 FEASIBILITY STUDY FOR A CENTRAL TEXAS FOOD HUBNationally, Hays and Kendall Counties were in the top five counties for
percentage growth (2nd and 3rd respectively) from 2015 to 2016.vii The
population in Central Texas is projected to continue to grow over the next five
years. The CAPCOG region is projected to grow by 14% (300,000 residents)
between 2017 and 2025.v The 13-county Alamo Area Council of Governments
4
(AACOG) region is projected to grow by 11% between 2015 and 2024.viii
As the Central Texas population grows, affordability becomes a challenge within
the most populated areas as well as within rural communities. Between 2009
and 2016, median home values in the Austin Metropolitan Statistical Area (MSA)
rose 28% while incomes only rose 16%. Affordability challenges are projected
to worsen within the Austin city limits and drive many low wage workers into
suburban and rural areas.v According to AACOG’s Economic Strategy 2018-
2023, rural communities are also facing issues of stagnant wages and a need for
I
additional affordable housing. Approximately 18.4% of Bexar County residents t is becoming more
and 16.0% of Travis County residents live below the Federal Poverty Line.ix
and more urgent for
Eleven percent of Bexar County residents experience food insecurity (205,500
residents), which is lower than the national average (12.9%).x Approximately communities across the
15.2% of Travis County residents experience food insecurity (174,000 residents), country to take action and
and an estimated 34% of residents pay more than 30% of their income for re-invest in their regional
housing, which leaves less money for other necessities such as food.xi food economies.
Income inequality exists between and within counties and disproportionately
affects females, people of color and children. While the median family income
(MFI) in Bexar County is just below $60,000, there are zip codes with MFI’s
as low as $15,000. San Antonio ranks near the top of U.S. cities with income
inequality and segregation, and in 2010 the San Antonio-New Braunfels area
was identified as the most income-segregated metropolitan area.ix In Travis
County, a higher proportion of Black/African American and Latino/Hispanic
communities experience poverty than non-Hispanic White populations, as
shown in Figure 3.xii
Figure 3: Poverty by race/ethnicity, Travis County 2011-2016
4 The 13-county region including and surrounding San Antonio MSA: Atascosa, Bandera, Bexar,
Comal, Frio, Gillespie, Guadalupe, Karnes, Kendall, Kerr, McMullen, Medina and Wilson Counties
FEASIBILITY STUDY FOR A CENTRAL TEXAS FOOD HUB 7National Food Hub Scene
STATISTICS
Food hubs are defined as “businesses or organizations that actively manage the
aggregation, distribution, and marketing of source-identified food products
primarily from local and regional producers to strengthen their ability to satisfy
wholesale, retail, and institutional demand.”xiii The number of operating food
hubs in the United States has nearly tripled in the past decade, from 136 in 2007
to 360 in 2017.xiv
This extraordinary proliferation of regional food system assets represents
a nation-wide movement towards strengthening values-based food
economies. In addition to providing core logistics and operations
services, food hubs also attempt to achieve broader social impact and
W
thus usually provide a mix of services for producers, buyers and the
hile it appears that community. Almost all hubs that responded to the 2017 National Food
the formation of Hub Survey said the following four values were related to their mission:
new hubs may be slowing,
1. Improve human health.
the 2017 National Food
Hub Survey discovered 2. Increase small to mid-sized producers’ access to markets.
that existing hubs are 3. Ensure that producers receive a fair price.
demonstrating profitability 4. Promote environmentally sensitive production practices.
and longevity. Recent data indicates a food hub survival rate of approximately 88%,
which is well above the 53% survival rate for all types of new businesses.xiv
While it appears that the formation of new hubs may be slowing, the 2017
National Food Hub Survey discovered that existing hubs are demonstrating
profitability and longevity. However, it is important to recognize the razor
thin profit margins in this industry and therefore approach any new or
differentiated business endeavor with judicious planning and management.
LESSONS LEARNED xiv xv
It is important to understand common hub problems and proactively plan to
manage and mitigate risk. The most essential component of food hub success,
as distilled from reports, conferences, webinars and meetings, is a solid
business plan with a clear financial model. “There is no mission without the
margin.” Along with a strong plan for financial viability, the following themes
also emerged as key success factors.
• realistic business plan with a financial model for profitability.
A
Feldsteiniv and Barhamxiii identified that a strong business plan is key
to food hub success. The business plan is where the core purpose and
defensibly unique value proposition are articulated, operations and services
are outlined and anticipated challenges are addressed.
• trong financial documents with benchmarks.
S
Financial documents are the backbone of any proposed business. They
outline how much money and what type of financing is needed to fund
startup, maintain necessary cash flow and pave a roadmap for growth.
They also set realistic benchmarks: what gets measured gets managed.
• nowledgeable and experienced staff.
K
Staff inexperience can be a death knell for food hubs. Conversely,
experienced and capable staff, especially in upper management,
8 FEASIBILITY STUDY FOR A CENTRAL TEXAS FOOD HUBcan manage day-to-day operations and support growth and be the
make-or-break critical factor for food hub survival. If food hubs do not
invest in professionals with proven industry experience and strong
aptitude for organization, then they risk operational inefficiencies at
best and high rates of staff turnover at worst. This can drain resources,
prevent growth and ultimately lead to food hub business failure.
• now your farmers, know your customers.
K
Balancing supply and demand is one of the top three challenges cited by
food hubs. It is important to understand the target markets’ needs and
purchasing patterns, as well as growing seasons, crops and factors that can
influence production. Relationships with buyers and producers are critically
important; it is recommended to begin with a core group of buyers and
wholesale ready producers and scale operations from that reliable and
R
consistent foundation of business. Start small and savvy, then scale. elationships with
buyers are critically
important.
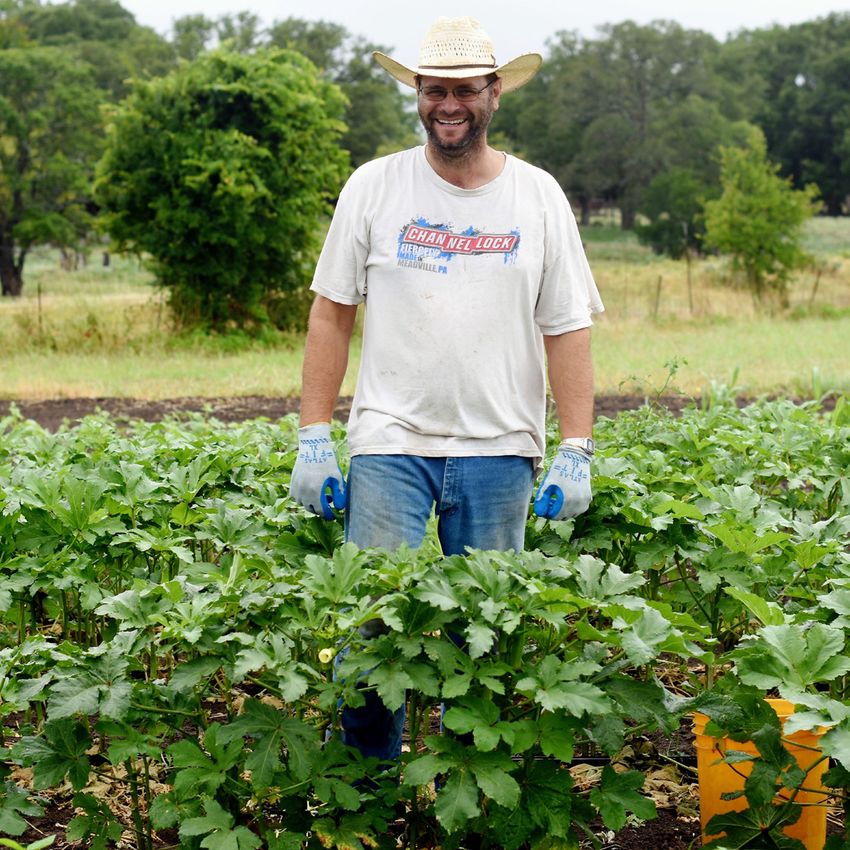
Lightsey Farm peaches
Photo credit: Ha Lam
FEASIBILITY STUDY FOR A CENTRAL TEXAS FOOD HUB 9SUPPLY AND DEMAND ANALYSIS
The supply and demand analysis explores the pivotal points in meeting and
balancing the scale-appropriate needs of small and mid-size producers with the
scale-appropriate needs of larger-volume buyers.
Methodology
Supply Analysis
Fruits and vegetables were the two main product categories selected for
in-depth study. This decision was made as a matter of efficiency: to gather
start-up information for a few focused product categories. Future hub growth
F
could include incorporation of additional product categories, such as meat,
armer involvement dairy and cheese, grains and value-added products.
was essential to this
process. Farmer involvement was essential to this process. As such, we recruited a
Farmer Advisory Team of seven fruit and vegetable growers to 1) review and
provide feedback on the Producer Survey and share the survey amongst their
networks, 2) review and provide feedback on farmer focus group questions
and help bring growers to the table and 3) review and provide feedback on
the feasibility report and recommendations. Input from our initial phone call
with the Farmer Advisory Team in December 2017 helped identify the scope
of the survey—to primarily focus on fruits and vegetables—as well as survey
questions.
PRIMARY RESEARCH
Primary research was conducted via a 24-question online Producer Survey, an
outreach session at the 2018 annual conference of the Texas Organic Farmers
and Gardeners Association (TOFGA), and four Producer Focus Groups.
The Producer Survey (see Appendix B) was open from January 26th to March 30,
2018 and distributed via e-mail to individual producers, producer associations
and agricultural service providers throughout the state, promoted on social
media platforms, linked on project team organizational websites, promoted to
individual farmers at SFC’s two farmers’ markets and announced at the 2018
TOFGA Conference. Sixty-three respondents completed the survey.
The four Producer Focus groups were held between February 25th and April
24th in regions surrounding Austin: North (Waco), East (Brenham) and South
(San Marcos and McAllen). Each two-hour focus group was led by a trained
facilitator and participants were asked questions in four key topic areas: 1)
Selling, 2) Producing, 3) Pricing and 4) Food Hub Model. (See Appendix C.)
Farmers were recruited via direct contact, social media outreach via
collaboration with existing farmer organizations and a total of 28 producers
attended these focus groups. Thirty-seven participants attended the one-hour,
interactive TOFGA Food Hub Feasibility outreach session on February 3rd,
which began with a short presentation on food hubs and spent the rest of the
time aggregating feedback on wholesale benefits and challenges, as well as
interest in a food hub.
SECONDARY RESEARCH
Secondary research on existing regional and statewide production was
gathered from the 2012 USDA Ag Census.
10 FEASIBILITY STUDY FOR A CENTRAL TEXAS FOOD HUBDemand Analysis Figure 4: Location of producer survey respondents
The project team identified and studied four potential
market categories in the greater Austin area and San
Antonio, which are situated approximately 75 miles apart
from downtown to downtown.
1. Institutions – Universities, Hospitals and Healthcare,
School Districts, Corporate Cafeterias and Special Event
Facilities
2. Grocers and Retailers
3. Fresh for Less Markets
4. Farm to Work Community Supported Agriculture (CSA)
PRIMARY RESEARCH
Primary research was conducted March 2018 – July
2018 and consisted of a 28-question online LFPP Buyer
Survey, a 15-question online Grocery Supply Survey and
phone interviews with buyers. The LFPP Buyer Survey
(Appendix D) assessed institutional interest in and barriers
to purchasing locally-grown produce. The survey was
distributed to public school food service directors in Central Texas, as well
as procurement coordinators at Universities, corporate cafeterias, hospitals
and special event facilities. Twenty-four institutional buyers responded to the
survey. The Grocery Supply Survey (Appendix E) assessed retail interest in and
barriers to purchasing locally-grown produce. This survey was distributed to
ten grocery retailers as potential customers of the food hub, of which three
responded to the survey. Some of the survey respondents self-identified as
being interested in having a follow-up interview with the project team. Six of
the institutional buyers were interviewed, either in person on by phone, and all
three of the grocery retail buyers were interviewed.
Table 2: Summary of primary research methods
Supply Analysis
Producer Survey, 24 questions January 26-March 30, 2018 63 completed
Outreach session, TOFGA Conference February 3, 2018 37 participants
Producer Focus Group, Waco February 25, 2018 8 participants
Producer Focus Group, San Marcos March 5, 2018 4 participants
Producer Focus Group, Brenham March 21, 2018 6 participants
Producer Focus Group, McAllen April 24, 2018 10 participants
Demand Analysis
Buyer Survey, 28 questions March 19 – July 31, 2018 24 completed
Grocer Survey, 15 questions March 19 – July 31, 2018 3 completed
Buyer Interviews March 19 – July 31, 2018 9 interviews
SECONDARY RESEARCH
The project team compiled secondary data to assess market potential. New
5
Venture Advisors’ MarketSizer® tool was used to calculate demand for fruits
and vegetables in Central Texas. Quantitative sales data from SFC’s Farm to
Work modified-CSA program were reviewed. Quantitative sales data from the
Fresh for Less Markets were also reviewed.
5 The MarketSizer tool was created by New Venture Advisors to estimate unmet demand for
locally produced food in a chosen geographic area. It can be accessed online at
www.newventureadvisors.net/tools
FEASIBILITY STUDY FOR A CENTRAL TEXAS FOOD HUB 11Findings
Producers
CHARACTERISTICS
All 63 survey respondents provided their location and represented a total of
28 counties. A majority of the respondents (40) were situated in Central Texas
counties (see Figure 3). Seventy percent (45 producers) had been farming or
ranching for 10 years or fewer. Respondents reported total farm size ranging
from 0 to 100 with a mean of 27.5 acres and a median of 14.5 acres; fifty eight
percent of respondents reported total farm sizes of 25 acres or less. Almost
all specialty crop production was reportedly occurring on 15 acres or less.
Almost all orchard acreage was reportedly occurring on 10 acres or less.
Overall, respondents were very interested in serving wholesale markets.
B eginning farmers are On a scale of 0 (not at all interested) to 100 (very interested), the mean was
74.1% and the median was higher at 80.0%. In fact, 20 of the 62 responses
highly receptive to to this question indicated 100% interest in selling to wholesale markets.
wholesaling, and efforts The highest average interest in selling to wholesale markets was among
need to be made to reach farmers who have been farming for 1-5 years (78.4%), and the lowest
out and include this average interest in selling to wholesale markets was among farmers who
demographic in initiatives have been farming for 26 or more years (50.8%) Table 3 provides a summary
of wholesale interest per number of years farming. The discrepancy in
to increase wholesale wholesale interest was not studied further, so any interpretation would be
capacity. mere conjecture. It is worth noting, however, that beginning farmers are
highly receptive to wholesaling, and efforts need to be made to reach out
and include this demographic in initiatives to increase wholesale capacity.
Table 3: Interest in selling wholesale
Years Total Total Additional Average
farming or specialty orchard available wholesale
ranching Responses crop acres acres acres* interest
1-5 24 44 63 80 78.4%
6-10 21 36 5 58 71.4%
11-25 9 62 4 154 74.9%
26 or more 10 60 14 78 50.8%
Totals 64 202 85.68 370
*Additional acres respondents are willing to put into specialty crop production
Respondents indicated selling through a mix of sales channels. The four most
common sales channels are:
1. Direct-to-customer through Farmers Markets and Farmstands: 74% of
respondents (46); accounts for an average 55% of these respondents’ total sales
2. Direct-to-restaurant: 42% of respondents (26); accounts for an average 14%
of these respondents’ total sales
3. Direct-to-consumer through Customer Supported Agriculture (CSA) and
SFC’s Farm to Work project: 40% of respondents (25); accounts for an
average 24% of these respondents’ total sales
4. Wholesale to distributors, brokers and/or grocers: 36% of respondents
(22); accounts for an average 11% of these respondents’ total sales
Only a handful of respondents sell directly to institutional wholesale markets,
such as universities and corporate cafeterias. No respondents sell directly to
school districts.
12 FEASIBILITY STUDY FOR A CENTRAL TEXAS FOOD HUBThese results illustrate the divide between producers’ ability to sell direct-
to-consumer and direct-to-wholesale aggregators, versus the inability to
sell directly to wholesale institutional buyers. The data is telling us there are
compelling barriers beyond price which hinder small to mid-sized producers'
ability to sell directly to wholesale institutional markets. Selling to a distributor
or broker provides additional services, such as marketing and aggregation/
coordination to meet large volume demand. Selling directly to a grocer offers
much more flexibility than selling to institutional buyers; grocers often manage
dozens of vendor accounts and can more readily accommodate seasonal
products.
CHALLENGES FACING PRODUCERS
Growing specialty crops can be unpredictable and present very little room for
error. Producers must navigate around obstacles that can often impact their
ability to provide reliable, consistent product at predictable volume. Common
themes arose in the focus groups, and were corroborated by the project team’s
experience working with Texas growers.
T he data is telling us
there are compelling
barriers beyond price
Categorizing these challenges as internal or external provides a reference point which hinder small to mid-
for where to focus resources and initiatives: at the farm-level or at the wider sized producers' ability to
systems level.
sell directly to wholesale
Buyers institutional markets.
CHARACTERISTICS
Seventy-one percent of responses (17) to the LFPP Buyer Survey were
Independent School Districts (ISD). The other 7 respondents were hospitals (3),
colleges/universities (2), corporate campuses (1) and a special events space (1).
Respondents were located in Austin and San Antonio. Seventy-one percent
of respondents reported that they are self-operated. Upon further inspection,
88% of ISDs (15 out of 17) reported being self-operated, while 71% of non-
Table 4: Challenges facing producers
Internal Challenges External Challenges
• •Difficult to track production costs • •Increasing land costs, especially cost
and determine accurate pricing. of viable farmland.
• •Lack of understanding of • •Shortage of qualified and
requirements and benefits of dependable labor.
Good Agricultural Practices • •Lack of market predictability (e.g.
(GAP) certification and Food rarely have a buyer before planting).
Safety Modernization Act (FSMA)
regulations. • •Increasingly unpredictable weather
events making farming more risky.
• •Difficult to differentiate product
and educate consumers about the
value of their sustainably-grown
and raised, local produce.
• •Difficult to build relationships with
buyers.
• •Costly to make multiple deliveries
per week and either spend a lot of
time in the car or pay employees to
drive all around town.
FEASIBILITY STUDY FOR A CENTRAL TEXAS FOOD HUB 13school respondents (5 out of 7) are managed by a Food Service Management
Company (FSMC). It is important to note that non-school respondents indicated
greater overall flexibility in produce purchasing decisions (71% moderately
flexible) than ISDs (18% very flexible and 35% moderately flexible). This is due
to a variety of reasons: Schools that participate in the National School Lunch
Program (NSLP) must adhere to Federal standards for school meals served.
These standards establish required serving sizes for five food groups (grain,
meat/meat alternate, vegetable, fruit and dairy) and required serving sizes
within vegetable subgroups (red & orange, dark green, beans & peas, starchy
and other). In addition, school districts that participate in the NSLP must
adhere to specific procurement requirements that ensure open and competitive
purchasing practices. Lastly, school districts that participate in the NSLP receive
Federally mandated reimbursements for free and reduced meals served. School
districts are reimbursed a mere $3.31 for every meal they serve to a child at no
T here appears to be
sufficient institutional
interest in local produce
cost (effective July 1, 2018 – June 30, 2019). Meal standard and procurement
requirements combined with maintaining extremely low per unit meal costs
can prevent an ISD from exercising much flexibility in purchasing decisions.
with moderate purchasing An emphasis on purchasing local very much aligns with a majority of
flexibility to further respondents' company missions (58%) and somewhat aligns with 33%
explore these markets as of respondents company missions. Schools overwhelmingly define
local as “grown within the state of Texas,” which mirrors the “Texas-
potential customers of a
grown” definition of local established by the state regulatory agency
food hub. over Child Nutrition Programs (Texas Department of Agriculture). Non-
school institutional buyers most commonly define local as “Product
grown within 200 miles of consumption.” A compelling 75% of buyers (18)
currently buy local produce, yet a small percentage of total produce food
costs (average 10%) go to local purchases. Nine out of 24 respondents
indicated willingness to pay more than 5% above current wholesale prices
for local food. These findings represent great market potential, as well as
allude to the many challenges still associated with local procurement.
Based on these general buyer profiles, there appears to be sufficient
institutional interest in local produce with moderate purchasing flexibility to
further explore these markets as potential customers of a food hub. The next
few sections will illuminate the needs and operational logistics of these buyers
in comparison to grower needs and logistics in order to determine if and how to
create successful selling and buying relationships.
Two of the three Grocery Supply Survey respondents represented large grocers
and one was a local grocer. The grocery buyers do not use advance contracts
to purchase fresh produce. For these buyers, “local” also means produce grown
anywhere in the state. The most commonly purchased local produce items are
watermelons, citrus and sweet onions. All the buyers indicated that purchasing
locally-grown produce was very important to their companies, but none of
them indicated they would pay more than 5% above market price to specifically
target Texas-grown produce. Their biggest barrier to selling more Texas-
grown produce was the difficulty locating reliable sources for the items. The
next biggest barrier was the inconsistent availability of produce, followed by
Braune Farms the barrier of food safety concerns. Only the smallest of the retailers surveyed
Photo credit: Ha Lam would consider purchasing cosmetically imperfect produce in order to get
Texas-grown produce on their shelves. And only this retailer would not require
its grower vendors to be Good Agricultural Practices (GAP) certified.
14 FEASIBILITY STUDY FOR A CENTRAL TEXAS FOOD HUBCHALLENGES FACING BUYERS
Institutional buyers who purchase at wholesale volumes operate under
a defined set of efficiencies. They work with a limited number of fresh
produce vendors—two to three on average, and rarely more than three. They
communicate with their fresh produce providers frequently, often at least
once a week or more. They’re accustomed to managing produce orders with
large distribution companies, and commonly have long-term contracts ranging
anywhere from three months to two years.
Grocery buyers, on the other hand, work with a very large number of Texas
grower vendors. They also communicate with fresh produce providers
frequently, often more than once a week. Since they’re accustomed
to managing produce orders with a broad range of vendors, contracts
are not very common, especially contracts with individual growers.
I
Our research identified the following top three barriers institutions face to nstitutional buyers
purchasing more local produce (in order, with #1 being the greatest barrier):
indicated a need for
1. Inconsistent availability of product. This arises in terms of year-round local produce vendors
supply due to the ebbs and flows of seasonality, week to week variations in
volume and produce sizes that do not meet product specifications.
to provide assistance in
planning seasonal menus,
2. Pricing too high. A majority of LFPP Buyer Survey respondents aren’t
willing to pay more than 5% above wholesale prices for local produce. writing local product
However, nine of the 24 respondents indicated a willingness to specifications and training
pay significantly higher prices than current wholesale prices (>5%). staff on fresh produce
Whether or not this is borne out in practice remains to be seen. preparation.
3. Sourcing / difficult to locate. If local produce is not provided by contracted
vendors, it can be difficult for buyers to find a local produce connection. One
buyer who was interviewed stated that if they were guided towards specific
local growers, they would be more inclined to push for those products to be
made available through their fresh produce distributors.
Another challenge cited by buyers who were interviewed is the limited capacity
to plan for and prepare local produce. They indicated a need for local produce
vendors to provide assistance in planning seasonal menus, writing local product
specifications and training staff on fresh produce preparation.
Table 5 (following page) provides a side-by-side look at where the pain points
are on both sides of the equation. Areas of overlap indicate greater potential
for impact and are excellent starting points to begin building bridges between
local supply and institutional demand. This chart illuminates the importance
of determining accurate and competitive prices; ensuring consistent quantity
of product grown and harvested; and institutional marketing and capacity-
building to plan for, procure and prepare more locally-grown produce.
Crops
Institutional buyers purchase an assortment of fruits and vegetables, many
of which are grown in Texas. (See Appendix F: Seasonality Assessment.) The
most common vegetables purchased are carrots, romaine lettuce, tomatoes,
potatoes, onion, squash (did not specify summer or winter), zucchini, broccoli,
cucumber, celery and bell peppers. The most common fruits purchased are
oranges, apples, bananas, melons and strawberries.
All buyers purchase fresh unprocessed produce, 83% buy fresh minimally
processed produce, and 67% buy processed frozen produce. Of note, 71%
of buyers (17) are willing to buy seconds or cosmetically imperfect produce.
It is important for local food distributors to work closely with buyers in
order to help write detailed and accurate produce specifications.
FEASIBILITY STUDY FOR A CENTRAL TEXAS FOOD HUB 15Table 5: Comparison of challenges facing producers and institutional buyers
Producers Buyers
• •Difficult to track production costs and determine accurate pricing. • •Inconsistent availability of product
• •Increasing land costs, especially the cost of viable farmland. throughout the year.
• •Lack of understanding of GAP certification and FSMA regulation. • •Higher price points.
• •Shortage of qualified and dependable labor. • •Inconsistent volume of product from week
to week.
• •Difficult to differentiate product and educate consumers about the
value of their sustainably-grown and raised, local produce. • •Difficult to source local product from
current vendors and to find new local
• •Difficult to build relationships with buyers. produce vendors.
• •Increasingly unpredictable weather events are making farming • •Limited capacity to plan for and prepare
more risky. menu items that include seasonal produce
• •Lack of market predictability. ingredients.
• •Costly to make multiple deliveries per week.
Production Volume
I t is important to
determine accurate
and competitive prices;
Production volume was addressed from two angles:
1. Current production, as determined by producer survey data and the 2012
USDA Census of Agriculture; and
ensuring consistent 2. Potential production, as determined by producer survey data
quantity of product
CURRENT VOLUME
grown and harvested; and
Over half of the survey respondents (36) indicated a greater than 75% interest
institutional marketing and in selling to wholesale markets. In aggregate, these producers indicated they
capacity-building to plan currently grow specialty crops on a total of 147 acres and have a total of 12
for, procure and prepare acres in orchard. Since the majority of orchard acres in Texas are in native
more locally-grown pecan production, the volume analysis will only consider specialty crop
production. Data from Central Texas are presented to better understand our
produce. regional production. In the 23-county region of Central Texas, there are 351
farms harvesting 21,523 acres of vegetables. Of note, Frio county has the
most vegetable acres (14,746).i This represents $35 million in local produce
production. (See Table 6.)
POTENTIAL VOLUME
The project team also assessed whether regional produce production is capable
of increasing as local fresh produce aggregation and distribution efforts
attempt to reach a greater share of the market. It is worth acknowledging here
that this section focuses purely on volume potential, while other sections will
address the complexities of both scaling an existing operation and onboarding
new wholesale vendors (a.k.a. achieving wholesale readiness).
The Producer Survey asked producers how many additional acres they would
be willing to put into production that is not currently in production if it was
the right financial decision for their farm. Respondents who indicated greater
than 75% interest in selling to wholesale markets have an additional, aggregate
249 acres at their disposal that they are willing to put into production. This
represents a little over $4 million in potential local food production sales, which
is greater than the combined produce budgets for Austin Independent School
District, University of Texas at Austin and Austin Convention Center.
Sustainable Food Center's
farmer's market
16 FEASIBILITY STUDY FOR A CENTRAL TEXAS FOOD HUBMarket Size
Demand is represented herein by the only buyers for which annual produce
budget information was available. The combined annual purchasing power of
Austin Independent School District (AISD), The University of Texas at Austin
(UT) and Austin Convention Center is a grand total of $3,236,676 million spent
on produce. Northeast ISD in San Antonio has an annual produce budget of
$1,757,000. The Fresh for Less markets procure $53,578 of produce annually. The
Farm to Work modified CSA program facilitates $168,000 in annual farm direct
sales to employees at worksites in Austin (36), San Antonio (2) and Houston (3).
Displaying the supply and demand side-by-side illustrates sufficient existing
production to meet demand. It also forecasts adequate land potential on which
to scale production and satisfy a growing appetite for local fresh produce.
Table 6 compares the existing and potential production to the market
opportunity within Central Texas. It provides a sense of how supply and
demand compare to one another in aggregate terms, and brings us one step
closer to understanding whether or not regional supply and demand are right-
A t first glance, it
appears that local
food supply can start
sized economies. At first glance, it appears that local food supply can start to to meet demand.
meet demand. However, supply actually meets demand at price. Producers
need to sell at a price that generates profit and buyers need to buy at a price
However, supply actually
that’s competitive with existing costs. Further study needs to be done to: meets demand at price.
1. determine which, if any, locally-grown specialty crops have a competitive
Producers need to sell at a
pricing advantage; price that generates profit
2. establish accurate farm product pricing and reduce on-farm costs of goods and buyers need to buy at
sold (e.g. through a group purchasing option); and a price that’s competitive
3. reveal pockets of institutional demand where buyers are willing and able to with existing costs.
pay premium prices.
Table 6: Central Texas supply and demand comparison
Supply* Demand**
Austin ISD, UT and Austin
Survey Respondents (147 acres) $2,381,400 $3,236,676
Convention Center combined
Existing Central Texas (21,523 acres) $348,672,600 Northeast ISD (in San Antonio) $1,757,000
Total Existing Supply*** $351,054,000 Fresh for Less Markets $53,578
Survey Respondents (249 acres) $4,033,800 Farm to Work $168,000
Potential
Total Potential Supply $4,033,800 Total $5,215,414
*10,000lbs / acre / year and $1.62 / lb . This calculation is derived from a University of Texas Master of Science in Community and Regional
Planning. thesis.xvi It was approved by a Supervising Committee, however, has not been peer-reviewed for publication. The project team
accepts this approximate yield per acre for Central Texas production.
**Food purchase amounts. Percentage of food purchase that goes to farmer varies.
***Since 66% of survey respondents live in Central Texas, this calculation of total existing supply includes duplication of some farms.
The Austin and San Antonio markets extend well beyond the buyers represented
above and in Table 7 (following page). According to the NVA MarketSizer® Tool,
the estimated market size for fruits and vegetables in Central Texas is nearly
$1,000,000,000, a.k.a. one Billion dollars ($444 million in the Capital Area and
$503 million in the Alamo Area). The key is to find pockets of wholesale demand
where buyers are willing and able to pay a premium for values-differentiated
produce. Table 7 provides a list of Central Texas institutions and grocers. This list
is not exhaustive, and is rather intended to start naming and locating some of
those potential pockets of demand. In addition to this list, the county in which
Austin is located is home to 24 school districts with a total of 166,059 students.
FEASIBILITY STUDY FOR A CENTRAL TEXAS FOOD HUB 17You can also read