The Structure and Dynamics of the Pig Meat Industry - Prepared for: Department of Agriculture, Fisheries and Forestry May 2007
←
→
Page content transcription
If your browser does not render page correctly, please read the page content below
The Structure and Dynamics
                      of the
                Pig Meat Industry

     Prepared for: Department of Agriculture,
             Fisheries and Forestry

                    May 2007

Authors:

                                                1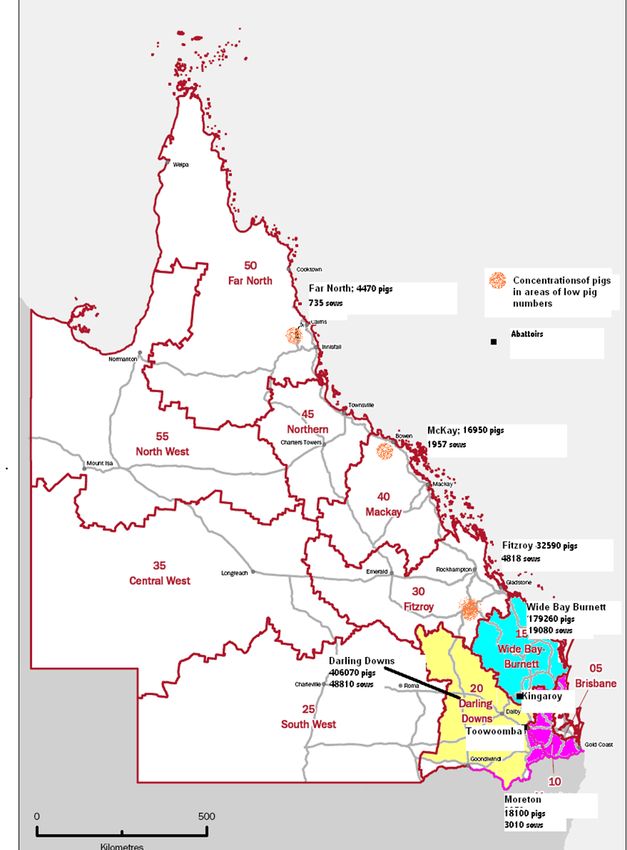
Ross Cutler BVSc PhD       Patricia Holyoake BVSc PhD
Ross Cutler & Associates   University of Sydney
140 The Parade             Faculty of Veterinary Science
Ocean Grove Vic 3226       425 Werombi Rd
                           Camden NSW 2570

                                                           2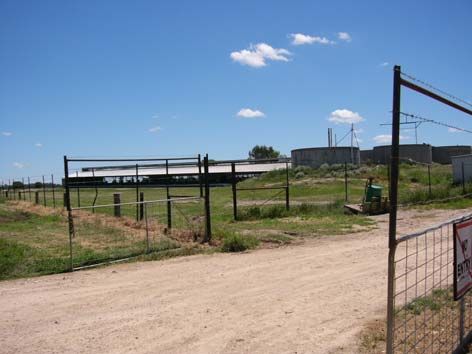
TABLE OF CONTENTS

1    INTRODUCTION .................................................................................................................................5
    1.1   ISSUES ..........................................................................................................................................5
    1.2   TERMS OF REFERENCE.................................................................................................................5
    1.2.1   STRUCTURE OF THE PIG HERD .................................................................................................5
    1.2.2   DYNAMICS WITHIN THE AUSTRALIAN PIG HERD ........................................................................6
    1.3   OUTPUTS ......................................................................................................................................6
2      BACKGROUND.................................................................................................................................7
    2.1        HISTORICAL PERSPECTIVE ...........................................................................................................7
    2.2        INTERNATIONAL COMPETITIVENESS ...........................................................................................14
3      FARM STRUCTURE.......................................................................................................................17
    3.1  INTEGRATION ..............................................................................................................................17
    3.2  FARROW-TO-FINISH ....................................................................................................................18
    3.3  WEANER PRODUCERS ................................................................................................................20
    3.4  FINISHER PRODUCERS ...............................................................................................................21
    3.5 MULTISITE PRODUCTION ...............................................................................................................21
    3.6 CONTRACTING ARRANGEMENTS ...................................................................................................21
    3.7  OUTDOOR FARMS .......................................................................................................................23
4     LOCATION OF PIG FARMS, AI CENTRES AND ABATTOIRS ..............................................24
    4.1    QUEENSLAND STATISTICAL DIVISIONS, FARMS, SEED STOCK PRODUCERS, ABATTOIRS AND AI
    CENTRES ..................................................................................................................................................25
    4.2    NEW SOUTH WALES STATISTICAL DIVISION, FARMS, SEED STOCK PRODUCERS, ABATTOIRS
    AND AI CENTRES ....................................................................................................................................27
    4.3    VICTORIA STATISTICAL DIVISION, FARMS, SEED STOCK PRODUCERS, ABATTOIRS AND AI
    CENTRES .................................................................................................................................................29
    4.4    TASMANIA STATISTICAL DIVISION, FARMS, SEED STOCK PRODUCERS, ABATTOIRS AND AI
    CENTRES .................................................................................................................................................31
    4.5    SOUTH AUSTRALIA STATISTICAL DIVISION, FARMS, SEED STOCK PRODUCERS, ABATTOIRS AND
    AI CENTRES ............................................................................................................................................32
    4.6    WESTERN AUSTRALIA STATISTICAL DIVISION, FARMS, SEED STOCK PRODUCERS, ABATTOIRS
    AND AI CENTRES ....................................................................................................................................34
    4.7    THE NORTHERN TERRITORY: STATISTICAL DIVISIONS, FARMS, SEED STOCK PRODUCERS,
    ABATTOIRS AND AI CENTRES..................................................................................................................36

5     ABATTOIRS ......................................................................................................................................36

6 DAY-TO-DAY OPERATIONS ON A SEMEN CENTRE ..............................................................38

7 PIG FARMS AND OTHER ANIMALS .............................................................................................40

8 BIOSECURITY AND DISEASE RISKS..........................................................................................41
    8.1 DEFINITION OF A BIOSECURITY PROGRAM ....................................................................................42
    8.2 EMERGENCY DISEASE HAZARDS ...................................................................................................43
    8.3 KEY ELEMENTS OF A BIOSECURITY PROGRAM FOR PIG FARMS ....................................................43
    8.3.1 COMPLIANCE WITH REGULATIONS PROHIBITING SWILL FEEDING ...............................................43
    8.3.2 FARM ISOLATION .........................................................................................................................43
    8.3.3 SEPARATION FROM OTHER ANIMALS ...........................................................................................43
    8.3.4 SINGLE SOURCE SUPPLY OF BREEDING STOCK AND RECORDS OF PIG INTRODUCTIONS ..........44
    8.3.5 ISOLATION FACILITY ....................................................................................................................44
    8.3.6 TRANSPORT ................................................................................................................................45
    8.3.7 PEOPLE MOVEMENT AND CONTROLLED ENTRY ..........................................................................45
    8.3.8 EQUIPMENT USED BY VETERINARIANS AND TECHNICIANS ..........................................................46
    8.3.9 VEHICLES ....................................................................................................................................46

                                                                                                                                                              3
8.3.10 RECOGNITION OF SICK ANIMALS, DISPOSAL OF DEAD STOCK AND TRAINING PROGRAMS FOR
    STAFF ABOUT DISEASE CONTROL ...........................................................................................................46
    8.4 THE PIG INDUSTRY BIOSECURITY CODE OF PRACTICE ..................................................................46
    8.5 DIAGNOSING DISEASE ...................................................................................................................46
9     MOVEMENTS OF PIGS AT AGRICULTURAL SHOWS ...........................................................47
    9.1 SURVEY OF ADMINISTRATIVE PERSONNEL AT AGRICULTURAL SHOWS ........................................47
    9.1.1 BIOSECURITY RISKS AT AGRICULTURAL SHOWS ........................................................................50
    9.2 SURVEY OF PIG EXHIBITORS AT AGRICULTURAL SHOWS ............................................................50
    9.2.1 INTRODUCTION ...........................................................................................................................50
    9.2.2 COMPILING A LIST OF ALL PIG EXHIBITORS ................................................................................50
    9.2.3 LOCATIONS OF AGRICULTURAL SHOWS ......................................................................................50
    9.2.4 QUARANTINE AND BIOSECURITY ................................................................................................52
    9.2.5 PIG IDENTIFICATION ....................................................................................................................52
    9.2.6 PIG MOVEMENTS POST-SHOWING...............................................................................................53
    9.2.7 MOVEMENTS OF PIGS AMONG SHOWS .......................................................................................53
    9.2.8 SUMMARY AND CONCLUSIONS ...................................................................................................55
10         LIVE PIG MARKETS IN AUSTRALIA .....................................................................................55
    10.1 NEW SOUTH WALES ...................................................................................................................56
    10.2   VICTORIA ................................................................................................................................57
    10.3   QUEENSLAND .........................................................................................................................57
    10.4   SOUTH AUSTRALIA .................................................................................................................58
    10.5   WESTERN AUSTRALIA ............................................................................................................58
    10.6 TASMANIA ...................................................................................................................................59
11         SURVEY OF PIG MOVEMENTS AT MAJOR SALEYARDS IN AUSTRALIA..................59
    11.1 INTRODUCTION ............................................................................................................................59
    11.2 METHODOLOGY ...........................................................................................................................59
    A ‘SNAPSHOT’ SURVEY WAS UNDERTAKEN AT FOUR MAJOR SALEYARDS IN AUSTRALIA LOCATED AT
    DUBLIN (SOUTH AUSTRALIA), BALLARAT (VICTORIA), FORBES (NEW SOUTH WALES) AND
    TOOWOOMBA (QUEENSLAND) OVER A TWO-MONTH PERIOD. A ‘MINOR’ SALEYARD AT TRURO IN
    SOUTH AUSTRALIA WAS ALSO INCLUDED IN THE STUDY FOR COMPARISON. TABLE 21 OUTLINES THE
    DATES AT WHICH EACH SALEYARD WAS VISITED....................................................................................59
    11.3 RESULTS .....................................................................................................................................60
    11.4 SUMMARY AND CONCLUSIONS .....................................................................................................65
    12.4     ACKNOWLEDGMENTS .............................................................................................................66
13         MOVEMENT DYNAMICS AMONG PIG FARMS ...................................................................66
    13.1    INTRODUCTION .......................................................................................................................66
    13.2 METHODOLOGY ...........................................................................................................................67
    13.3    RESULTS .................................................................................................................................67
    13.3.1 ON-FARM BIOSECURITY ..........................................................................................................68
    13.3.2 MOVEMENT DYNAMICS ...........................................................................................................68
    13.3.2.1 MOVEMENTS ON TO FARMS ................................................................................................68
    13.3.2.2 MOVEMENTS OFF FARMS......................................................................................................69
    13.4 DISCUSSION ................................................................................................................................70
    13.5    SUMMARY ...............................................................................................................................71
EXAMPLES OF SPECIFIC INDIVIDUAL FARM DYNAMICS .........................................................72

APPENDIX ONE: POSTAL SURVEY TO PORK PRODUCERS ....................................................74

REFERENCES.........................................................................................................................................76

                                                                                                                                                      4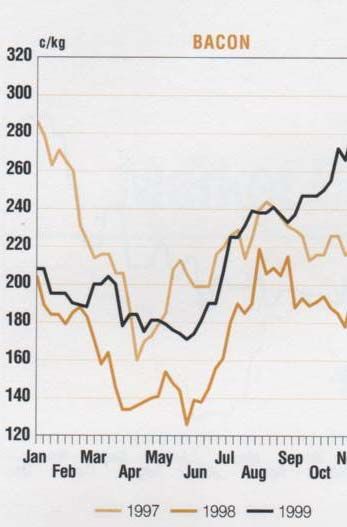
1 Introduction
This project was undertaken in response to terms of reference provided by the Office of the
Chief Veterinary Officer (OCVO) of the Australian Department of Agriculture, Fisheries and
Forestry.

The need for quality information on the structure, husbandry and livestock movement patterns
associated with Australia’s pig herds has been identified as an important research priority for
government and industry. This information can be used in a range of applications, but is
particularly important for understanding and managing potential disease incursions. This project
is the last of five projects covering different livestock industries: sheep, pigs, beef cattle, dairy
and poultry.

The OCVO within the Australian Government — Department of Agriculture, Fisheries and
Forestry (AG–DAFF) is responsible for coordinating emergency animal disease preparedness
and responses. Management of incursions may be complicated by the movement of livestock
throughout Australia because this movement offers the potential for rapid and widespread
dissemination of disease. Successful planning for, and management of, disease incursions
relies on a good understanding of ‘normal movement patterns’, rapid identification and tracing of
animal movements from infected premises and prevention of further animal or animal product
movements capable of spreading disease.

Technologies such as disease modeling can assist in understanding the potential rate and
extent of spread of diseases. Information on the movement of livestock throughout Australia is
essential to the characterization of scenarios for the likely spread of a disease originating at a
certain location and/or within a certain production system at different times of the year. Such
scenarios are valuable in determining the effectiveness of control strategies and the allocation
of resources to control an emergency disease incident. There is a range of factors that influence
livestock movements — production systems, feed availability, market prices — and determining
these would assist in the modeling of likely livestock movements that might occur. An example
of the modeling work conducted by the OCVO has recently been published (Garner & Beckett,
2005).

1.1 Issues
A preliminary study assessing the feasibility of determining cattle movements has been
conducted (Cunningham et al., 2002). That study developed methods for the gathering of
movement data but did not progress to collecting data. Other studies have investigated animal
movements in other countries (e.g. Sanson et al., 1993, Nielen et al., 1996: Ogawa & Matsuda,
2000; Bates et al., 2001). These studies have considered both direct (live animal) and indirect
(animal products, people, vehicles, etc) movements. Although this level of information is useful,
given limited available resources, the focus of this project will be on direct (animal) movements.
In addition to live animal movements, movement of genetic material is of particular relevance to
the pig industry. This study includes information on breeding practices that entail movement of
such material between farms as well.

1.2 Terms of reference
The following terms of reference define the scope of this project:

1.2.1   Structure of the pig herd

Identify and describe all relevant sectors/production systems within the Australian pig meat
industry and detail their standard operating practices.

The geographic location of each identified sector/production system should be identified (and
related to the 12 survey areas used in previous studies and referred to in Section 2 [Issues]
above).

Identify within each sector any practices that significantly affect between-herd interactions.

                                                                                                    5
Detail the nature of breeding systems predominant in each production system (for example,
whether boars or artificial insemination are used) and their source.
Detail the typical size and age structure of herds in each sector and whether other animals are
typically present on the same property.
1.2.2 Dynamics within the Australian pig herd
Detail broad movement and marketing patterns of pigs within and between each production
system identified under A1 above.
Detail movements of animals onto and off ‘typical’ farms within each production system and
region identified under A1 above.
Detail frequency and source/destination of movements of reproductive material (e.g. semen)
onto and off farms within the different sectors.
Identify factors that impact on the nature, timing and direction of pig movements within each
production system.
Identify key factors (meteorological, environmental, sociological, financial etc) that affect when
production units make animal purchases and sales.
Identify key areas of congregation or clustering of pig as a result of movements, for example:
• assembly of animals for live export
• rest stops on transport corridors, travelling stock routes
• agricultural shows
• others.
1.3 Outputs
The major output of the project will be a report that:
• Provides a rational classification of the Australian pig meat industry which takes into
account geographical, production system and marketing factors. This should include
distribution maps that show where the various sectors occur in Australia.
• Describes for pig meat enterprises within these sectors, the number, type and structure
of livestock present on typical (i.e. representative) farms of each sector as well as any
production practices (including breeding practices) that significantly affect between-herd
mixing of animals or reproductive material.
• Identifies and discusses sources of information on pig movements.
• Describes, for each of the sectors, the frequency, timing and direction of pig movements
that occur on and off ‘typical’ farms.
• Identifies factors that may influence that affect the buying and selling of pigs.
• Identifies particular issues or areas associated with the respective sectors that may be
associated with increased clustering and mixing of pig from different sources.
62 Background
2.1 Historical perspective
The Australian pig industry, in common with other intensive animal industries worldwide, has
evolved from being a sideline enterprise to dairy or grain farms to becoming a significant
farming enterprise in its own right and trades pork throughout the world. In the 2004–5 financial
year the Australian pig industry had a gross farm value of about $924 million (Table one).
Table one: Source: Dowling 2006
PS-6008 Gross Value of Australian Farm Production
2002/03 2003/04 2004/05
$ $ $
Million Million Million
LIVESTOCK
SLAUGHTERINGS
Cattle and calves 5,849 6,345 7,331
Cattle exported live 562 314 335
Sheep 446 454 397
Lambs 1,182 1,318 1,258
Sheep exported live 408 266 207
Pigs 911 879 924
Poultry 1,281 1,281 1,440
Total 10,676 10,896 11,930
Source: ABARE cited by the Dowling
2006
Pigs grew well on skim milk, a by-product of a dairy industry that delivered cream to butter
factories, a practice that still operated in the 1970s. In areas close to butter or cheese factories,
whey was delivered or piped to pig farms and this cheap feed source became an important
comparative advantage for those producers. For example, in the Leitchville community of
Victoria, a group of producers piped whey from the then Kraft cheese factory to their farms. At
Kiewa in Victoria the Kiewa butter factory ran a skim milk line to its own nearby pig farm of
several hundred sows.
In common with other grain producing farms all over the world, Australian grain farmers also
raised a few pigs. Again, they were a sideline industry that generated regular cash flow
throughout the year.
As these industries changed, so did the pig industry. Progressive deregulation of the dairy
industry changed where milk was produced. Processing technologies and refrigeration reduced
the availability of skim milk and the quality of whey, putting more emphasis on the efficient use
of feed. Throughout the 1970s the Australian industry started to learn how to produce pigs in
numbers and about the importance of volume. Those that were able to apply new technologies
expanded at the expense of those with poor health status, inadequate facilities or poor feed
efficiency.
In 1960 there were about 50,000 producers (Figure one). The total sow population was about
211,000 sows (Figure two). Average herd size then was 4.3 sows. The number of herds
declined through the 1960s along with changes to the dairying industry and other structural
agricultural changes. Surplus grain production in the late 1960s to the early 1970s led to the
introduction of wheat quotas so some grain farmers, following the practice common in North
America, elected to market grain through pigs. This led to a brief increase in 1972 in both the
number of producers (to 39,000) and the number of sows to 460,000, a number never since
reached (Dowling 2006).
7Figure one.
Source: Dowling 2006
Figure two: Herd size: Australian Pig Industry 1960–2004 Source: Dowling 2006
As a consequence of an outbreak of classical swine fever in NSW in the 1960s, movement
controls were placed on pigs and pork products. This regulatory and disease control action
seriously compromised the capacity of the NSW based Mayfair Hams and Bacon group to
maintain output. The Mayfair group made a strategic decision to establish its own units in
Victoria and NSW to partly offset the effect of any future disease control restrictions.
This group established Australia’s first fully intensive unit at Huntly, near Bendigo, in April 1965
and over the next five years it grew to 2,000 sows. This was the beginning of the intensive pig
industry in Australia. The Mayfair group, through the leadership of Dr Dudley Smith,
demonstrated the feasibility of production on units of this size and hence that of the business
and system model. The Mayfair group established a similar operation at Menangle in NSW in
1971. Proof of the concept also led to the population of the Wonga pig farm in 1968 (approx
1,200 sows) developed by Dr John Holder and from there to the establishment of the then
Fidelity Meat Industries farm at Corowa in 1971. Until that time, disease internationally (largely
classical swine fever in the USA) had constrained farm herd size to about 500 sows but based
on the success of these operations in Australia the nature of the industry changed.
8Through the 1970s, the number of herds decreased rapidly but the number of sows in the
national herd remained the same. For 20 years from 1980–2000 the size of the national sow
herd fell from about 350,000 to 300,000 sows. Despite this fall, annual output increased from
about 200,000 to 370,000 tonnes. This was achieved through improvements in efficiency and
an increase in slaughter weight from the 55–60kg common through the 1980s to 73kg in 2005.
The trend for increasing dressed weight in the 1980s is clear (Figure three). As national output
increased and pork prices eased, unsustainable producers left the industry. Those efficient
producers that remained increased their herd sizes to take advantage of the terms of trade.
The 1980s and early 1990s were years of consolidation. The Australian industry was
underpinned by a strong research effort supported by governments and producers. Smaller
producers were pressed competitively by larger scale producers but, significantly, there were no
importations of frozen pork products.
There was significant investment in large scale greenfield operations or expansion of existing
businesses. Contracting schemes started. In these, the risks were shared. One partner provided
labour and capital and the other the pigs, feed, technical know-how and marketing. In Victoria in
the late 1970s, the then Barastoc stock feed milling company owned by KMM Pty Ltd developed
the first contracting scheme as a way of increasing volume through its feed mills. Multi-site pig
farming systems were developed in the late 1980–1990s. The then Bunge group developed a
multi-site production system where sow farms in Bendigo, Seville and St Arnaud produced
weaner pigs for a growing and finishing complex at Gre Gre near St Arnaud. This system
produced about 6000 pigs per week. Similar systems developed in Queensland although they
were not of the same scale.
The financial pressures on the industry are presented in figure four. Low pig price to grain
ratios are indicative of tighter terms of trade. There were some tighter years during the period
1983–1989 coinciding with a period of a 16% increase in sow numbers and an increase in
slaughter weight from 55 kg to 65kg carcase weight that placed more pork onto the domestic
market (Figure six). The Australian herd lost about 50,000 sows over the period from 1988–
1991 as the industry adjusted to these dynamics.
During the early 1990s, frozen pig meat was imported for the first time. Importation was
vigorously contested by the industry, at first because of the risk of introducing Transmissible
Gastro Enteritis and then later because of the risk of Porcine Reproductive and Respiratory
Syndrome and Postweaning Multi-systemic Wasting Syndrome.
Terms of trade improved during the mid–late 1990s as exports to Japan and Singapore
increased. At this time international pork prices were high. 1996 was a drought year and feed
prices were high. 1998–99 was a particularly bad year for an industry exposed to an
international market. In mid–late 1998 there was surplus of pigs relative to slaughter capacity in
North America and pork prices fell precipitously everywhere North American pigs were traded.
Imports had increased during 1997 and by October and November 1998 they had reached the
then all time high of 1500 tonnes per month. Part of this was in response to demand because
Australia had increased its exports to Japan at this time. The imports put a ceiling on domestic
prices at a time they would normally have been expected to increase. This impacted on the
Australian market in early 1999 but by mid 1999 prices had recovered (Figure eight). During
this time imports of pork were steadily increasing (Figure seven) and changed the dynamics of
the price structure. Bacon and leg prices fell but fresh pork (loin chop) prices increased (Figure
five). The cyclical nature of pork prices is presented in figures eight and nine.
In 1996 an outbreak of Foot and Mouth Disease in Taiwan created a window of opportunity to
supply Japan with additional pork. In 1998, Nipah virus caused the death of an abattoir
slaughterman in Singapore and the deaths of about 105 people in Malaysia. An opportunity to
supply the Singapore market with fresh meat was seized and exports increased over the period
to May 2003, peaking at 70,000 tonnes annually (Figure nine) and with the positive terms of
trade the Australian herd size increased from about 300,000 sows in 2001 to about 350,000
sows in 2003.
9With declining terms of trade associated with dry years, high feed prices and an appreciating
Australian currency value between 2001–2004 (Figure 11) exports fell, imports peaked in 2005
and the national herd size fell. Producers continue to leave the industry but whereas in the past
the sow numbers were quickly made up by those remaining, in 2004 and 2005 the national herd
size dropped to 318,000 sows.
Figure three: Increasing slaughter weight of pigs over the period from 1980–2005
Source: Dowling 2006
80
75
70
65
Kgs
60
55
50
80 81 82 83 84 85 86 87 88 89 90 91 92 93 94 95 96 97 98 99 00 01 02 03 04 05
Average Slaughter Weight 12-Month Moving Average
Figure four: Relative profitability pig/grain price ratio. Base year 1989-90.
Source: Dowling 2006
2.0
1.8
1.6
Pig/Grain Price Ratio
1.4
1.2
1.0
0.8
0.6
0.4
0.2
0.0
72 74 76 78 80 82 84 86 88 90 92 94 96 98 00 02 04
Base Month = 1989/90
10Figure five: Retail price of pork legs, loin chops and bacon, Sydney 1994–2005.
Data source: Dowling 2006
1400
1200
Retail price of Legs:cents
1000 per Kg
800
Cents
Retail price of pork chops/kg
600
Retail price of bacon/kg
400
200
0
94 95 96 97 98 99 00 01 02 03 04 05
1 3 5 7 9 11
Year
Figure six: Increasing production of pork over the period from 1980–2005. Source: Dowling
2006
'000s tonnes '000s tonnes
40 450
35 400
30 350
25 300
20 250
15 200
10 150
80 81 82 83 84 85 86 87 88 89 90 91 92 93 94 95 96 97 98 99 00 01 02 03 04 05
Pigmeat production 12-Month Moving Total
11Figure seven: Source: Dowling 2006
PS-9004 Australian Pork Imports - Volume
90,000 12,000
80,000
10,000
Monthly Imports (tonnes SW)
70,000
MAT Imports (tonnes SW)
8,000
60,000
50,000 6,000
40,000
4,000
30,000
2,000
20,000
10,000 0
Ap 9
9
Ja 9
00
0
Ja 0
Ap 1
1
Ja 1
02
2
Ja 2
Ap 3
3
Ja 3
Ap 4
4
Ja 4
05
5
5
O 9
0
1
2
3
4
5
r-9
l-9
-9
r-0
l-0
-0
r-0
l-0
-0
r-0
l-0
-0
r-0
l-0
-0
r-0
l-0
-0
r-0
l-0
-0
9
0
0
0
n-
n-
n-
n-
n-
n-
n-
ct
ct
ct
ct
ct
ct
ct
Ju
Ju
Ju
Ju
Ju
Ju
Ju
Ap
Ap
Ap
Ja
O
O
O
O
O
O
Monthly Imports MAT Imports
Figure eight: Seasonal fluctuations in Pork prices 1997–99 Source: Meo and Cleary 2000
12Figure nine: Prices 2003–2005 Source: Dowling 2006
Figure 10: Australian pigmeat exports 1999–2005 Source: Dowling 2006
Figure 11: Changes in the value of the Australian dollar. Source: Baker and Barber (2004).
132.2 International competitiveness
In 1992 the average cost of production across a sample of 26 herds was $1.41/kg liveweight
(Ransley and Cleary 1994). Of this, the cost of feed was 80 cents or 56.4%. The non-feed costs
were 61 cents/kg live. In 2005 the average cost of production across a different but similarly
representative group of 16 farms was about $1.93/kg liveweight. The feed cost was $1.05/kg or
54.3%. The non-feed costs were $0.88 (Dowling 2006). The price of feed increased by only
10% over that 13 year period. For comparison, international data are presented in figure 12.
Australia has a cost of production, according to these data sets, somewhat above that of the
USA, Canada, Brazil and Chile. The data in figure 12 were presented at an international
meeting of representatives of the Pig Improvement Company in 2006, an international pig
seedstock business.
Figure 12: Cost of production in different countries (Myer 2006)
14Australian pig industry productivity is acceptable by international standards (Table two) but
output suffers because of a relatively low slaughter weight.
Table two: Overview of Australian breeding herd
performance 2004/05 and PigChamp USA data set 2005
Number of Farms: Australia (73) USA (574)
Parameter Weighted Mean
Gilt pool % 13.11
Sow mortality rate % 10.27 8.94
Sow replacement rate (%) 61.19 51.15
Farrowing rate % 79.69 78.5
Average parity of culled sows 4.11
Total pigs born/litter 11.25 11.93
Pigs born alive/litter 10.32 10.64
Pigs weaned/litter 9.25 9.27
Pre-weaning mortality % 10.32 12.18
Weaning age (days) 21.81 18.49
Litters/mated female/year 2.27
Pigs weaned/mated female/year 21.05 20.63
Weaning to first service interval 7.09
AI % 84.11
Slaughter liveweight 97.11 *120
Number sold per sow 19.37
Liveweight sold per sow 1591 *2401
Sources: Dowling 2006 and PigChamp
* From Figures 13 and 14
The sample of 73 Australian farms produced about 1591 kg (3500 lb) liveweight per sow per
year in 2004–5. This compares with the 2363 kg (5200 lb) per sow produced in US herds
monitored by Agrimetrics (Williams 2006). It accounts for the much lower US cost of production
in figure 12. The output per sow is driven by a sale liveweight of 120 kg in the USA, which is
about 23 kg or 24% more than Australia’s. Other production indices are broadly similar.
Figure 13: Throughput of pigs on US farms (pounds of pork per sow per year) Williams 2006
15Figure 14: Average saleweight of pigs in the United States (pound [lb] liveweight) Williams
2006
As a general rule the long term price of grain is declining at about 3% per year in real terms. In
1980, the price of wheat was about $US176 and in 2005 $US181/tonne (USDA 2006). While
this may be true, the periods of high feed prices associated with drought or difficult seasons
provide short term uncertainty. In 2006, a drought year, the price of feed wheat immediately
after harvest was $US250.00 compared to $US170/tonne the year before. In March 2007 the
price of wheat was $US310/tonne.
In 1992, producers earned about $US220 c/kg (hot standard carcase weight). In 2005 they
earned about $US260c/kg (Figure 15). Allowing for an average rate of inflation of 2% over this
period (Unicef 2006) pig prices have not kept pace with the rate of inflation.
Figure 15: Farm gate price trends.
Farm gate price of bacon pigs in Victoria 1992–2005
(cents per kilogram hot standard carcase weight)
( )
350
300
250
200
150
100
50
0
1
92 932 94
3
954 96
5 6
97 7
98 8
99 9 10 11 12 13 14
00 01 02 03 04 05
(Compiled by the authors from Pigstats 1992–2001 and Dowling 2006)
The pig to grain price ratio (Figure four) demonstrates fluctuations around an average ratio of
about 1.0. From 1990 to 2004 there have been more years of relatively higher profitability than
in the 18 years before. Australian pork prices are presented in figure 15. By comparison, USA
pork prices were about $2.24 (AUD) per kg for carcase weights in excess of 105kg — roughly
the same as Australia’s price for pigs sold into the Japanese market.
163 Farm structure
3.1 Integration
As herd size has increased, farms have historically sought efficiencies through integration.
However, while the Barastoc group used a contracting pig business to increase the volume of
feed through their mills in the early 1980s, the practice did not spread to other milling groups.
Instead, Barastoc (now Ridley Agriproducts) divested itself of its pig farm operations and
acquired other feed milling businesses. Today QAF meat Industries is the only fully integrated
pork company; they own farms, pigs, a feed mill and an abattoir. No other pork business is so
integrated. Swickers (Kingaroy) are involved in production, slaughtering and processing. The
proprietors of Diamond Valley Pork own pig production businesses in South Australia and
Victoria and part of the Big River Pork abattoir in Murray Bridge in South Australia.
Many pig production businesses mix their own feed. For example, about 50% of Queensland
producers mix their own feed. However, the investment decision depends on the interests of the
owners, the availability of skilled staff and the competing returns for the investment dollars.
During the 1980s, some processors also owned pig farms. This included Metro Meats, Mayfair
Hams and Bacon, Castle Bacon and George Westons. As the industry rationalized, farms were
bought and sold, abattoirs decommissioned and new, larger, more efficient abattoirs
constructed.
To find efficiencies in scale, farms became larger. In the case of QAF Meats and the Australian
Pork Farms group in South Australia, much of this has been by acquisition. Other businesses
have increased in size through reinvestment and the many successful family based pork
production businesses have grown in this way from modest enterprises of 250 sows 15 years
ago to over 1,000 or 2,000 sows today.
For the larger farms, increasing scale has meant that special measures need to be taken to
retain operational efficiency but to also comply with environmental guidelines. For example,
large populations of pigs are not well tolerated in many areas so farms have developed
specialized sites: sows on one site, weaners on another and growers and finishing pigs on
another or any combination of these. The movement of pigs between these sites then becomes
systematic so that each week, for example, 100 sows are farrowed and 900 pigs are moved to
the weaner house and similar numbers moved from weaner to grower and so on to slaughter.
No other pigs except the system’s pigs are introduced although periodically pigs from the
(single) seedstock supplier will be introduced to the sow farm. This pig movement is planned for
every week of the year. It is independent of market demand but is affected by season. Over the
November to February period numbers sold are reduced compared with other months because
of the impact of seasonal factors (mostly temperature) on fertility. Producers try to counter this
effect by mating more sows.
These multisite systems are sophisticated in the support services provided. They retain
veterinary, nutritional, genetic, management and training support. They employ biosecurity
measures that exceed the code of practice requirements. They may be high health status herds
but are also equally likely to have ‘conventional’ health status. High health status herds are free
of Mycoplasma hyopneumoniae, swine dysentery, atrophic rhinitis, internal and external
parasites and sometimes Actinobacillus pleuropneumoniae. Conventional health status herds
carry several or all of these diseases. Obviously there is a continuum.
In addition to wholly owned multisite businesses, contracting systems employ similar system
principles.
17Part of the QAF
multisite system at Gre
Gre Victoria
3.2 Farrow-to-finish
This is the conventional structure of intensive pig farms. In this model the farm breeds, farrows,
weans and grows out its own pigs for sale. As herd size has increased some businesses have
been constrained by space or environmental regulation so farms have been divided into breeder
units and grower units.
Day-to-day operations on a farrow-to-finish farm
A farm producing about 200 pigs per week requires a herd size of about 550 sows. It will farrow
about 21 sows per week. To do this, it will mate about 28–30 sows every week depending on
how severe the impact of seasonal infertility is on the herd.
To meet this mating target, it will keep a pool of as many as 80 gilts on hand. These will be
sourced about every 8–12 weeks from an external high health status multiplication herd as
parent gilts. They could also be produced on-farm by a group of maternal line sows comprising
about 10% of the sow herd. Their job within the herd is to supply replacement breeding stock.
The maternal line sows are introduced in small numbers three to four times during the year. The
genetic make up of the replacement gilts is a key element in the long term output and
performance of the herd. The sows will, in most cases, be joined by AI to a terminal sire line
boar but most herds still keep some boars.
If the gilts are sourced externally and the herd is M hyopneumoniae free, they will likely spend
about eight weeks in quarantine to reduce the risk of introducing this pathogen into the herd. If
the herd is infected with M hyopneumoniae then a four week period of quarantine before entry
to the main herd is the norm. About 85% of the national herd is infected with M hyopneumoniae.
Over the last 40 years, the farms that have remained in the pig industry have grown and they
have increased herd efficiency by increasing scale and slaughter weight. Their owners have
progressively renovated growing sheds and turned them into sow housing or built new farrowing
houses and turned the old ones into other housing, usually for sows. In addition they have built
new farrowing houses, weaner houses and growing houses. In the last ten years they have built
straw-based shelters and while they were cheap to build they were expensive in terms of the
cost of bedding so that the overall cost of production was little different to conventional facilities.
They were also more difficult to manage, especially when it came to sorting pigs for sale and
looking after sick pigs.
Many owners have taken advantage of recent profitable trading terms to restock their herds with
high health status breeding stock drawn from one of three or four major suppliers that meet their
health status specification. Alternatively, other producers have eliminated M hyopneumoniae
using the technique of ‘Swiss depopulation’, where the growing herd is depopulated and the
sow herd medicated. This has increased herd feed efficiency and herd output and also reduced
the cost of medications. It has also made these producers more biosecurity conscious.
18Profitability of these farms is driven by feed efficiency, the cost of feed, genetic improvement
and health status. But before any of these elements can be exploited the pigs have to be mated
each week. To mate 28–30 sows each week requires a pool of gilts — about 42–48 a week. For
example, if 21 sows are weaned about seven will be culled for age or performance. That means
14–16 gilts have to be mated. To have that many on heat each week the unit needs 42–48 of
the right age and weight available and cycling. Mate them too young and litter size suffers. To
make sure there are enough coming through the herd needs a further three weeks supply of
gilts. As a general rule a farm needs 12–15% of the sow herd as replacement breeding stock
and it is this demand that fuels the movement of pigs from seedstock herd to commercial farm.
Semen is delivered once or twice a week. It has a life of about five days but fertility is highest for
the first three days. Some farms collect and process their own semen on site twice a week.
The use of AI has significantly reduced the movement of male breeding stock from seed supply
stock to commercial herds. Most herds are using AI matings for about 80–100% of their sows.
Cull sows are sold weekly. Mostly they are sold direct to slaughter but significant numbers are
sold through regional saleyards. Turnover rate is high on Australian farms. The average sow
replacement rate for a sample of 73 farms was 61% per year (Dowling 2006).
The gilt pool drives the overall herd performance. It is the limiting factor for the number of
matings and hence output and profit. Gilt litter size drives long term herd litter size. Gilts are also
the biggest risk to the herd’s health status because they are introduced from another farm. This
can be as often as every month but on high health status farms it is about every eight weeks to
allow for an extended quarantine period. Boars are introduced at the same time as gilts.
In any one week the sows are weaned on Wednesday or Thursday. If they are weaned after a
lactation length of about 28 days they will be on heat about 4–5 days later. If they are weaned
after a lactation of about 21 days they will be on heat 5–6 days later. Hence the sows generally
come into heat on Monday or Tuesday. By Thursday the farm, assuming there have been
enough gilts in the system, should have met its weekly mating budget.
During gestation the sows are fed a ‘dry’ sow diet. They are housed in stalls or pens or both for
gestation and enter the farrowing house on the Thursday or Friday of the week before they are
due to farrow. They are confined almost without exception in some sort of farrowing crate in a
purpose-built farrowing house. This usually includes some form of temperature control system.
With the exception of erysipelas which occurs from time to time, infectious disease in sows
during gestation or in neonatal pigs at term is unusual.
After farrowing, the pigs are processed. On some farms this just means docking their tails and
administering iron injections but on others their teeth are clipped and ears notched as well. On
most farms the pigs are treated prophylactically at 4–5 days of age for coccidiosis with
toltrazuril.
Common infectious diseases in the farrowing house include enterotoxigenic E coli, Glasser’s
disease and Streptococcus suis. The last two usually occur more in the weaner house but they
start in the younger age groups. Coccidial organisms (Isospora suis) are nearly always present
but usually controlled.
Pigs are commonly weaned at 3–4 weeks of age but on some farms they are weaned at two
weeks. Whether they are on a single site farrow-to-finish farm or a multisite farm they are
weaned into a purpose-built weaner house or straw bedded shelter. They are fed a weaner diet,
usually with an antimicrobial to control proliferative enteritis. Alternatively water medication may
be used to control post weaning E coli infections soon after weaning and proliferative enteritis at
about 7–10 weeks of age. On sow farms a live vaccine is often added to water to control
Lawsonia intracellularis. Space allowances are usually set ahead of the welfare code to
optimize growth performance. Group sizes depend on the facility. They range from as many as
1000 to as few as 15–20 pigs per pen. On some farms the pen is the shed or shelter.
19The best performance occurs in facilities that are operated on an all-in all-out basis. This is
because the facilities are easily cleaned and temperature controlled to a range that suits the
needs of all the pigs more than anything to do with disease spread.
The most important diseases after weaning include post weaning enterotoxigenic E coli,
Glasser’s disease, streptococcal septicaemia, proliferative enteritis (Lawsonia intracellularis),
erysipelas, Mycoplasma hyopneumoniae, Actinobacillus pleuropneumoniae and Brachyspira
hyodysenteriae. Internal and external parasites are present on many farms but rarely cause
problems.
By 8–10 weeks of age the pigs move to a grower facility. More space per pig is provided and
the diets change again. Males and females will be usually separated at this stage if they haven’t
already.
Many farms of this size will operate on all-in all-out principles. In high health status herds,
antimicrobial additives will have been removed but water medications for proliferative enteritis
may be used.
Depending on the farm practices the pigs will remain in this group until they are sold. The first
heavy pigs for sale are removed at about 18 weeks of age. If the pigs are housed in straw
based shelters as growers on some farms they will be moved to a larger shelter or the group
split at about 16–18 weeks. At about 16 weeks of age, cull pigs recognized as having reached a
sale weight will be sold. About 5% of pigs are sold at these lighter weights. Alternatively they
may be kept as a group until about 18 weeks of age when the heaviest pigs are sold and the
remainder moved and held in conventional concrete floored facilities in small groups until they
are sold — usually over the next two-three weeks.
The pigs are transported, usually early in the morning, for slaughter the same day. Where
significant distances are travelled the pigs will be rested in lairage for 12 hours and killed the
next day.
About 50–60% of Australia’s production is grown under the umbrella of the Australian Pork
Industry Quality Assurance program and the corresponding physical, chemical, biological,
management, welfare and biosecurity standards.
3.3 Weaner producers
Weaner farms are popular for contracting businesses. The profitability of a farm producing just
weaner pigs is lower than one selling finishing pigs so it is unusual for people who own both
their pigs and buildings to produce only weaner pigs. Weaner production systems lend
themselves well to contracting. They require a high degree of husbandry skill and their
profitability rests heavily on the herd’s reproductive performance.
On specialist weaner farms, there are usually purpose-built, environmentally-controlled facilities.
Properly designed, these purpose-built facilities provide the best efficiency and performance but
small deficiencies easily cause problems. Some producers have solved this by providing straw-
based shelters with plenty of bedding as a substitute for complex temperature control
engineering. Others have provided low cost weaner hutches and created a microclimate for
young pigs in buildings that once housed growing pigs.
In general, the quality of a building should predict performance but this doesn’t always apply.
On a specialist weaner farm, pigs will most likely be moved into all-in all-out rooms or sheds
each week. On some farms, the rooms may be filled over a two week period but the shed
emptied all at once.
Some farms run on a batch basis and the whole site is filled at the same time. On the largest
farms in Australia, pigs are moved onto the weaner site from two to three sow farms or breeder
sites. It is preferable for the sow sites to have the same health status but this is not always
possible. The best results are seen where the pigs from health status-compatible sow farms are
20reared in the same weaner houses. On the largest farms, as many as 6–8,000 pigs are shipped
in each week. It’s all a matter of scale. The number shipped reflects the size of the breeding
herds and the number of weaner facilities engaged. They are rarely all designed together but
reflect disparate expansion, the requirements for additional space, competing financial
constraints, a mix of business models and a mix of production models employing, sometimes all
at once, farrow-to-finish, multisite and batch production approaches. Clearly, as production
scale increases, the disease risk increases through management complexity, human error,
constraints on resources (such as cleaned trucks) and the proximity of farms to one another.
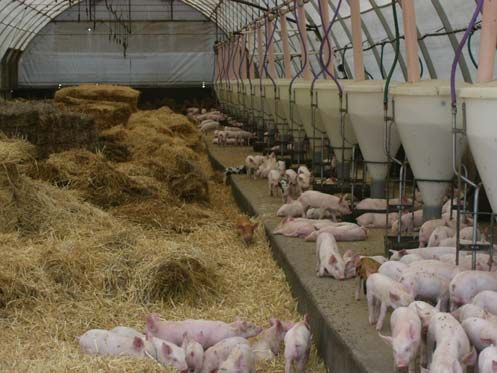
Weaners in an ecoshelter
in Queensland. This unit
operates as a separate
weaner site and draws
pigs from two sow farms
3.4 Finisher producers
After their period in the weaner house, the pigs are moved to the grower site where they are
grown out until sale. The preferred housing is based on all-in all-out systems. Straw bedded
shelters lend themselves well to these systems. One shelter for 200–400 pigs works well but
there are still problems with sorting the animals in these group sizes for sale. Because of the
behaviours associated with housing large numbers of entire male pigs together, feed efficiency
and mortality rates can be adversely affected.
Finisher farm sites lend themselves well to contracting schemes. They are often situated on
grain farms that have space, surplus labour and can use the effluent on crops. They resemble
the design and layouts and financial arrangements of similar contracting arrangements
elsewhere in the world.
3.5 Multisite production
There are relatively few multisite operations in Australia. They are present in some parts of
Queensland where herds are expanding and in Victoria as part of the QAF group.
Their advantage lies in scale but this is also a disadvantage if the pigs have to be drawn from
several breeder sites of different health status. Multisite operations have arisen because of a
perceived opportunity to improve efficiency through scale, disease control and feeding
practices. Unfortunately the multisite systems have not delivered against this potential. While
they have solved some problems regarding land availability, environmental management or
resource allocation they have not delivered on the health objectives and herds have managed
to become infected with nearly all of the common diseases of pigs in Australia, with the possible
exception of atrophic rhinitis, leptospirosis and mange.
3.6 Contracting arrangements
In 2005 there were 472 producers in contracting arrangements (Table three). Their numbers
decreased from 483 in 2004. The numbers of contractors in NSW and Victoria fell but the
numbers of contractors increased from about 135 to 205 in Queensland. The precise
21arrangements vary but, in brief, one party provides the labour and housing facilities and the
other provides the feed, the pigs, technical knowledge and sells or slaughters the pigs.
Some contracting schemes pay a set weekly amount while others pay bonuses dependent on
feed efficiency and deaths. The size of contract farms varies. Outside of QAF, the biggest
breeder sites produce about 400 weaners per week. The biggest finisher sites produce about
400 finishers a week.
The biggest group involved in contracting is the QAF group in southern NSW and Victoria. QAF
transports semen from their own in-house semen centre to their contract breeder herds. They
transport gilts from their multiplication herds operated under contract to their contract breeder
sites. There is regular movement of animals and semen across the breadth of their production
enterprise. The health status of the herds varies so, to preserve the health advantage, complex
biosecurity arrangements are in place. They have been generally successful in limiting disease
spread. Porcine myocarditis virus did not spread outside the initially infected herds at QAF.
While Mycoplasma hyopneumoniae has spread to previously-non-infected farms via aerosols,
swine dysentery, A. pleuropneumoniae and internal and external parasites have not.
Table Three: Pig farms and herd sizes by state
2005 2005 2005 2005 2005 2005
Contract 100 - 500 - Total
growers 1 to 49 50 - 99 499 999 1,000 +
NSW
Sows 4,074 3,296 20,160 5,229 57,217 89,976
Establishments 114 325 50 103 7 13 612
VIC
Sows 3,433 2,817 14,412 10,378 35,261 66,301
Establishments 47 293 42 54 16 11 463
QLD
Sows 3,684 3,917 20,266 8,635 42,813 79,315
Establishments 205 259 52 83 11 17 627
SA
Sows 4,623 1,451 15,561 6,917 24,083 52,635
Establishments 63 229 22 73 11 8 406
WA
Sows 1,677 2,033 10,113 5,696 18,952 38,471
Establishments 25 115 30 46 9 6 231
TAS
Sows 342 337 1,389 2,068
Establishments 15 25 5 5 50
NT
Sows 3 362 362
Establishments 2 1 1 4
Australia
Sows 17,836 13,852 82,262 36,855 178,326 329,131
Establishments 472 1,248 201 365 54 55 2,395
22Farrow to finish unit in Qld
showing perimeter fencing
and the gate which is locked
each evening. Feral pigs are
prevalent in this area.
3.7 Outdoor farms
Despite its large population of feral pigs, Australia is generally unsuited to keeping pigs for
commercial production outdoors. Environmental degradation factors combined with high
summer temperatures and seasonal infertility restrict populations of outdoor pigs generally to
coastal areas near Albany and areas in Southern Victoria. The outdoor sow population is
estimated at about 15,000–18,000 sows.
Although they are called outdoor systems, it is generally the sows that are ‘housed’ outdoors.
They are provided with a paddock, a shared hut for shelter and fed pelleted diets. The sites are
rotated about every two years. The sows farrow in huts ‘outdoors’ but the piglets are weaned
into straw bedded shelters. Systems vary but by 6–8 weeks of age the piglets have been moved
off-site to a growing unit. This may be a conventional concrete floored facility or a (straw)
bedded system.
The outdoor units have been populated almost exclusively from the PIC group. Their health
status has echoed the high health status of that group although, as happened with many herds
in 2000, an incursion of M hyopneumoniae following the breakdown of a nucleus herd created
problems. It ultimately forced two herds to close and another to undergo a Swiss depopulation
program to eliminate the disease.
Apart from the single episode with M hyopneumoniae, the outdoor sow herds have been able to
maintain their health status. After over 10 years of operation they remain free of internal and
external parasites. One or two contract grower sites have however become infected with M
Hyopneumoniae via aerosol spread from neighbouring properties.
These farms have been subject to a breach of security by feral boars but, as is often the case,
the feral boars have possibly enjoyed a superior health status to their domestic counterparts
and no disease episode followed.
The outdoor system was developed as a low cost housing, low intensity intervention system. It
relied on efficient management, putting sufficient sows before the boars to meet production
targets, high quality diets and good survival. It used the relatively low cost of keeping a sow to
hold surplus numbers to ensure that weaned targets were met and that contracted grower
facilities were filled. This discipline was maintained on some farms but others sought to optimize
production efficiency by introducing management procedures more common to indoor intensive
farms that outdoor farms. These include artificial insemination and trough feeding for sows.
23You can also read