Finding Food in Farm Country - Hiawatha's Pantry Project
←
→
Page content transcription
If your browser does not render page correctly, please read the page content below
Hiawatha's Pantry Project
Community Design Center, Lanesboro (507) 467-3446

                       Finding Food
                             in
                       Farm Country

                        The Economics
                      of Food & Farming
                   in Southeast Minnesota

                              compiled by

                               Ken Meter
              Crossroads Resource Center (Minneapolis)
                                  and
                              Jon Rosales
       Institute for Social, Economic & Ecological Sustainability
                       University of Minnesota
                                 2001
Credits & Acknowledgements The authors express their gratitude to the citizens of Southeast Minnesota and the technical experts who contributed their ideas, energy and inspiration to this report. We especially thank Prescott Bergh, Michael Nash, Carolyn Carr, Beth Waterhouse, Karen Lehman, Dr. Richard A. Levins, George Economy, Rod Sommerfield, and Julia Ness for reviewing early drafts. Finding Food In Farm Country is funded by the University of Minnesota's Southeast Minnesota Experiment in Rural Cooperation. Community Design Center's Hiawatha's Pantry Project is funded by the USDA Food Security Grant program with additional support from the Bush Foundation of Minnesota. Ken Meter, president of Crossroads Resource Center in Minneapolis and community faculty member at Metropolitan State University, is creator of the Neighborhood Income Statement and Balance Sheet studies. Jon Rosales is Research Fellow for the Institute for Social, Economic and Environmental Sustainability (ISEES) at the University of Minnesota.
Finding Food in Farm Country

     by Ken Meter and Jon Rosales

                 for
      Community Design Center
      Hiawatha's Pantry Project

      Nancy Bratrud, Coordinator
    Ruth Murphy, Executive Director
Hiawatha's Pantry Project
Community Design Center, Lanesboro (507) 467-3446
1. The 8,436 farms in 2. However, the region's
Southeast Minnesota sold farmers spent $947 million
$866 million of farm products raising this food. This is $80
in 1997. million more than they earned
by selling their products!
Finding Food
In
Farm Country
Southeast Minnesota
FACT SHEET
3. Even more troubling,
Southeast Minnesota farm 4. Meanwhile, the 303,256
families spend about $400 residents of Southeast
million per year purchasing Minnesota spend $506
inputs and credit from million buying food, almost all
distant suppliers. Very little from producers outside of
of this money builds wealth the state.
for local families.
This means as much as $800 million each year
flows out of our agricultural region as local
families grow and buy food. Almost none of this
money builds wealth in our neighborhoods.
Creating our own regional food system is one
way to reduce these losses.
If you would like to learn more, read our full report, Finding Food in Farm Country.
Sources for this fact sheet: Bureau of Economic Analysis (1997); Minnesota Department of Agriculture
(2000); Food Industry Institute (1999); and Bureau of Labor Statistics (1997). Data compiled by Ken
Meter, Crossroads Resource Center, and Jon Rosales, Institute for Social, Economic and
Environmental Sustainability, University of Minnesota, 2001.Table of Contents
EXECUTIVE SUMMARY:.......................................................................................................................................... 3
LOCAL FOOD INITIATIVES ................................................................................................................................... 6
ROOT RIVER MARKET (HOUSTON)........................................................................................................................................... 6
REBEKAH'S RESTAURANT (PLAINVIEW) ................................................................................................................................... 6
EARTHEN PATH ORGANIC FARM CSA / FULL CIRCLE COOPERATIVE (OAK CENTER).................................................... 7
BUILDING CONNECTIONS WITH FOOD .......................................................................................................... 8
THE REGION'S FARM & FOOD ECONOMIES ................................................................................................ 10
A REGION OF FARMERS............................................................................................................................................................. 10
A REGION OF FOOD CONSUMERS ............................................................................................................................................ 16
A REGION OF FOOD MANUFACTURERS & RETAILERS ........................................................................................................... 17
SUMMARY.................................................................................................................................................................................... 18
ECOLOGICAL IMPACTS OF CURRENT FARM PRACTICES......................................................................... 21
ECOLOGICAL CONCERN MOTIVATES THE GROWTH OF LOCAL FOOD SYSTEMS ................................................................ 22
SUNFLOWER FIELDS FARM CSA & GROWN LOCALLY (ALLAMAKEE COUNTY, IOWA)................... 23
RAISING FOOD FOR RURAL NEIGHBORS ................................................................................................................................. 23
SUNFLOWER FIELDS FARM CSA.............................................................................................................................................. 23
GROWN LOCALLY................................................................................................................................................................... 25
CONCLUSION: FOOD & COMMUNITY BUILDING....................................................................................... 29
RESOURCE LISTS .................................................................................................................................................... 33
1. SOUTHEAST MINNESOTA FOOD PRODUCERS, SELLERS & PROCESSORS ....................................................................... 33
2. FARMERS MARKETS IN THE REGION .................................................................................................................................. 33
3. COOPERATIVE WHOLESALERS ............................................................................................................................................ 33
4. COMMUNITY-SUPPORTED AGRICULTURE (CSA) FARMS: ................................................................................................ 34
5. PRODUCERS WHO SELL DIRECTLY TO CONSUMERS:.......................................................................................................... 35
6. FARMS IN OTHER REGIONS .................................................................................................................................................. 45
7. DIRECTORIES ......................................................................................................................................................................... 51
8. SELECTED WEB SITES:........................................................................................................................................................... 53
9. OTHER RESOURCES .............................................................................................................................................................. 54
APPENDICES ............................................................................................................................................................ 55
APPENDIX A: FARMING IN RELATION TO OTHER BUSINESSES ............................................................................................ 55
APPENDIX B: SCHOOL EXPENDITURES FOR SCHOOL LUNCHES .......................................................................................... 57
APPENDIX C: RELATED HOUSEHOLD DATA .......................................................................................................................... 58
APPENDIX D: FARM PROPERTY TAX PAYMENTS.................................................................................................................... 59
APPENDIX E: FIVE-YEAR TRENDS IN FARM INCOME AND EXPENSES (1994-1998) ........................................................... 60
APPENDIX F: EVIDENCE OF NITRATE CONTAMINATION IN MINNESOTA WELLS ............................................................ 63Finding Food in Farm Country, page 2 Meter/Rosales
Finding Food in Farm Country, page 3 Meter/Rosales
Executive Summary:
Finding Food in Farm Country
The majestic limestone bluffs that tower above the Root River in southeastern Minnesota overlook
some of the most lovingly tended farm acreage in the state. Still, it is not as easy as one would think
to find healthy food to eat.
Here, in the heart of a strong agricultural region that produces nearly a billion dollars worth of food
annually, the town of Houston recently spent two years without a grocery store. Two Plainview
women who wanted to assure that fresh-cooked meals could be created from organic foods took the
bold step of starting their own restaurant. A cluster of organic growers near Oak Center has labored
persistently for two decades, against great odds, to raise organic produce for an expanding urban
market.
It is not apparent on the surface why, in the midst of one of the most powerful agricultural systems
in the world, such relatively fragile and small initiatives would even be necessary. The purpose of
this report is to search for an explanation. Although a comprehensive answer is beyond the means
of this study, some powerful facts have been uncovered.
Our key finding is that the existing economic structures through which food products are bought
and sold extract about $800 million from the region's economy each year. All this money,
currently earned by Southeast Minnesota residents, is spent in ways that weaken the capacity of the
region to build wealth for its citizens. This is a significant loss, an amount equivalent to ten percent
of all household income earned by the region's 303,000 residents.
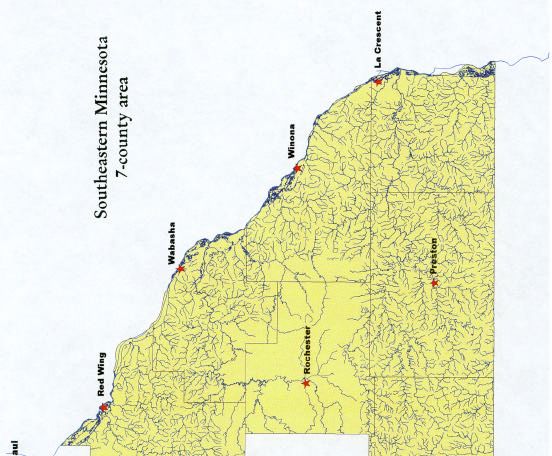
An economic overview of the farm and food economies of Southeast Minnesota (the seven-county
area including Fillmore, Goodhue, Houston, Mower, Olmsted, Wabasha and Winona Counties), this
report offers a perspective that is typically overlooked. Most studies look only at a single business, a
particular economic sector or industry, or a specific consumer market. Our approach is to view the
region's economy from the viewpoint of the region itself. We pose the question, what is best for
Southeast Minnesota as a whole?
One way of addressing this question is to examine aggregate farm income data for the seven
counties. The region's 8,436 farm families earned a total of $122 million in net farm income in 1997,
an average of only $15,000 per farm each year. However, this income was essentially earned through
activities other than crop cultivation or animal husbandry. Farmers relied on rental income, custom
service work, government payments, and investment income merely to cover these costs ofFinding Food in Farm Country, page 4 Meter/Rosales production. Of course farm families also earned additional income by working off-farm jobs, but that income is not included in these totals. In short, despite having invested heavily in technology that enables them to reap immense harvests, and despite spending nearly a billion dollars a year to raise crops and animals to sell to some of the wealthiest corporations in the world, many of the region's farm families live dangerously close to poverty levels. Overall, the region's farms earned $866 million by selling crops and livestock in 1997. However, this was $80 million less than they paid to grow those products. More troubling, nearly half of these production costs were devoted to purchasing inputs from distant suppliers, or paying loan interest to distant creditors who do not reinvest in their community – a loss of an estimated $400 million each year. As a result, farmers pay for a process that weakens their own power over the resources required to produce food. This has brought tragic consequences. More than one quarter of the region's farmland is absentee- owned. Both lending institutions and farm marketing channels are increasingly owned by more distant corporate owners who have no commitment to invest in the region, since their attention has turned to global markets. Although Southeast Minnesota's farmers hold what economists would call a competitive advantage in the global market for producing crops and livestock, these findings raise the question of whether it is in the self-interest of the farmers themselves – or of the communities they live in – to exercise this advantage. Global interdependence appears to create new losses, rather than new wealth, for the region. International trade policies have undermined commodity prices that were already low, and global economic uncertainty has weakened foreign markets that were once reliable to the region's growers. Corporate mergers in the food processing industry increasingly come under closer scrutiny for failing to add value to either farmers or stockholders.1 Moreover, the erosion of the farm economy affects the entire region, which is essentially losing its capacity for ownership. IRS data show that the region's aggregate household income from interest, rent and dividends fell 40 percent from 1990 to 1997, a decline from $358 million (adjusted for increased costs of living) to $213 million. 2 Although the essential promise of capitalism is that American citizens will be able to earn income from capital, that promise rings hollow in the Southeast region. This data is especially stark in the face of troubling trends in mainstream farming practices. The number of dairy farms is falling drastically, which poses additional harm to the region's ecology. As small dairy farms go under, less crop rotation is practiced, so fewer farmers raise pasture crops or apply manure to help build their soil. Less rotation means more row crops. With prices of oil and natural gas soaring, the farm chemicals derived from petroleum are so costly that farmers are switching to soybeans since these require fewer chemical inputs. However, this contributes to 1 Minneapolis Star Tribune (2001). "Consolidation at both ends of food chain yields worries about future sustainability." January 14, D1. 2 Internal Revenue Service (1990, 1997). County Income data file.
Finding Food in Farm Country, page 5                                                                  Meter/Rosales

erosion of the region's fragile soils. Already, the region is one of the most vulnerable in the state to
water contamination from farm runoff.

While farm production is a key aspect of the region's food economy, Southeast Minnesota is also an
important region of food consumers. With 120,000 households eating three meals a day, the region
spends over $500 million each year buying food. Yet only $2 million of this spent buying food
directly from farmers.3 Moreover, although data are sketchy, we estimate a total of more than $400
million of these purchases heads outside the region. Wealth, once again, is built outside the region
rather than in the region's communities.

Of course, food processing also plays a significant role in the southeastern region. Twenty percent
of the region's manufacturing income derives from food processing, and one third of all retail sales
involve food. Adding value to locally raised farm products and paying relatively higher wages than
farm labor or retail sales, processing does build some local wealth, but only to the extent local
producers and workers earn adequate income, or corporate ownership is locally held.

As local capacity for wealth creation erodes, exceptional pressures are placed on the region,
demanding it be more self-reliant. In response, a variety of citizen's initiatives have emerged,
expressing both consumer demand for healthier food and farmers' concern over the supply of their
primary resource, the soil. This report begins by offering a glimpse of three such initiatives: the
Root River Market in Houston, Rebekah's Restaurant in Plainview, and Full Circle Cooperative in
Oak Center.

Following an economic overview, the report turns its attention to Northeastern Iowa, where two
farmers groups have organized to take the unusual step of raising farm produce for their immediate
neighbors. The experience of these new businesses – Sunflower Fields Farm CSA and the
GROWN Locally farmers' cooperative – has shown that a hunger for healthy food exists, even
amidst farm families in the heartland. Southeast Minnesota farmers may wish to learn from this
story how to build similar networks in their region.

This report does not suggest the region would wish to build a wall around itself in an effort to close
itself from the broader world. All four of the citizens' initiatives described here connect to the
global economy, and all draw upon lessons learned in other locales. What makes each initiative
effective is that each builds connections among community members, and each builds wealth that
takes root in the local community.

Nor does this report suggest that expanding local food production and processing is the sole answer
to reducing the flow of money out of the region. But food has shown itself to be a powerful force
in building social connections. It is unlikely the region can achieve greater self-reliance without
reconfiguring the ways food moves from farm to table.

This report closes by offering a detailed resource guide for farmers who may wish to direct their
efforts to raising food for their local neighbors, or who wish to explore sustainable farming
practices. Farms inside and outside the region that have pioneered in selling their produce directly
to local consumers are listed, along with state agencies, resource groups and web sites offering
practical information to farmers in transition.

3   U.S. Agricultural Census for 1997. Viewed at , February 26, 2001.
Finding Food in Farm Country, page 6                                                   Meter/Rosales

                                       Local food initiatives

Root River Market (Houston)

When Houston's last grocery store closed in 1998, no other firms moved in to fill the gap. So a
group of nine residents decided to take matters into their own hands. In July, 1999, they formed a
locally owned cooperative grocery business. Not only did they reason that the town required a
grocery store of its own, the group also wanted healthier food choices.

"The grocery store in most towns is the center of the business community," said Tony Denstad,
manager of the Root River Market, which opened November 7, 2000. "If there is no grocery store
that hurts all the other businesses." Without the grocery store drawing customers to the business
district, folks shop elsewhere. And, Denstad adds, "everyone eats every day."

Within a few months, the nine founders had enrolled 350 of their neighbors to join the cooperative
– a wide majority of the local adult population of this town of 1,000. Each member purchased a
$100 share. As other investments were attracted, the coop built an impressive initial capital fund of
$180,000. The coop opened as a mid-sized store of 8,000 square feet.

There are three grocery stores in nearby towns, but each is at least twelve 12 miles away. Moreover,
the new store, planned by local folks, offers more services than a typical grocery. The Root River
Market aims to become a full-service food cooperative.

"We're a community store," Denstad stated. "We give service, and we wait on our customers." The
store delivers food to seniors. In six months the coop hopes to add a selection of "whole"
(healthier) foods, and to feature local produce.

Rebekah's Restaurant (Plainview)

Forty miles to the northwest of the Root River Market, on the table flat prairies of Plainvew, an
historic Odd Fellows Hall on West Broadway hosts a new café called Rebekah's. Owners Paula
Wheeler and Diane Lutzke buy food from 13 local producers, purchasing more than $15,000 of
fresh food annually. Rebekah's cooks all meals from scratch. Changing daily according to the
available harvest, the menu cycles through the seasons.

"People think it is more difficult to buy from local farms since you have to deal with so many more
businesses," explains Wheeler. "You can't just place one single order and have it delivered. To us,
that is the fun part. We see our neighbors on a regular basis. We see their children grow. We know
how they raise the food. We support the growers and they support us."
Finding Food in Farm Country, page 7 Meter/Rosales Rebekah's features beef, pork, lamb, chickens, eggs, turkeys, mushrooms, dairy products, wine and specialty items like buffalo, elk, and rabbit, all raised by local growers. Some people felt that there would be no way to make such a restaurant concept work in a small town, Wheeler said. "But our business draw is that we offer locally produced organic foods. There are several restaurants in town. Each does a good business. The others tend to cater to traditional tastes, offering small town fare. They appeal to those who like that kind of food. We offer an alternative. People are looking for that difference. Lots of our customers agree that organic food tastes better and is more nutritious." "We're just a small operation," Wheeler adds. "Just think what could be possible for local growers if it was more than just us." Indeed, one grocery in town sells local eggs, and the nearby Tavern on the Green Restaurant also offers local selections. In the future, Wheeler hopes, "Some of us will put together a local market where local growers can sell their products. We get lots of people through here who try to get us to start a similar restaurant in other towns, such as Rochester. But running a restaurant is not an easy business." Earthen Path Organic Farm CSA / Full Circle Cooperative (Oak Center) Just a few miles away, organic farmer Steve Schwen rises long before dawn one day each week of the growing season to climb into his delivery truck. One of the many pioneers of organic food production in the state, Schwen is the proprietor of Earthen Path Organic Farm, a community supported agriculture (CSA) farm. Still, despite 30 years of growing expertise, Schwen found that he could not build a market for organic produce on his own. So Schwen also coordinates a marketing cooperative, Full Circle Cooperative, that conveys organic produce raised by 14 local growers to Twin City cooperative food stores. Schwen has literally devoted his life to raising organic produce. Starting at a time when many consumers did not yet appreciate the value of organic crops, he persisted through long, lean years until the market caught up with his vision. Working in close collaboration with others, he helped bring an historic general store back to life at Oak Center. In the ground floor of this venerable building, fresh organic produce and other essentials are sold. In the rustic theatre hall above, Schwen hosts nationally known folk musicians and convenes searching educational sessions that help shape the community's vision for its future. Full Circle had established a solid reputation as an excellent and reliable supplier long before mainstream consumers began to ask for organic foods. As the urban market expanded, Full Circle's business has also settled into a strong niche. "We sell an average of $800-$1,000 of produce each week during the season," Schwen says, adding that his crop season begins in mid-May; he is still delivering root crops in December. He also sells produce at the Lake City and Rochester farmers' markets.
Finding Food in Farm Country, page 8                                                       Meter/Rosales

The search for new markets continues, of course. Schwen would like to add to his client list more
restaurants and institutional buyers from the Southeast region. He is now setting up a one-step
process for placing orders so potential buyers need only make one phone call or e-mail message.

"What has worked best for us is to develop a real strong organic presence, to gain more visibility for
the high quality of our foods," Schwen adds. We have been able to show to our buyers that what we
have is not just excellent quality produce, but that we're different in how we approach the buyer.
We're not just another entity marketing food. We are committed to building a sustainable region."

An essential ingredient of that sustainability, Schwen argues, is that farmers cooperate with each
other. "As we brought new farmers into the coop, it has gotten better for all of us. We get more
sales, better prices, and we make customers happier." On the other hand, he adds, "When we have
pulled back and thought of each other as competitors, marketing entities placed us against each
other, and our prices were driven down."

                                Building connections with food
All three of these initiatives build upon a common thread. Each uses food as a way of building new
connections among Southeast Minnesota neighbors. Each offers chances for neighbors to build
stronger bonds of loyalty, a more intimate sense of each other, and greater capacity to trust – the
kinds of community fabric a scientist might call social capital. By planning together to address the
needs of their own communities, by gathering together to dine or share stories, and by lingering with
each other as business is transacted, participants in each project build a certain amount of new
wealth for the community.

Moreover, each connection builds flows of money that link and enrich neighbors. By exchanging
goods and services with each other through local networks, residents create new business activity
that increases the accountability neighbors have to each other. Money is cycled through many hands
in the same locale, building new economic wealth at each turn.

Some 90 such businesses have already formed in southeastern Minnesota. Those we know of are
listed in the Resources section of this report [see page 33]. While these are relatively small businesses,
and while some may be commercially fragile, they hold fundamental importance since they link the
region's residents in social and economic networks. Proponents argue that it is precisely such
networks that the region requires to cohere. While the mainstream economy vitally depends on
such social capital, it is inherently unable to generate it anew. Close community bonds may only be
built by people who produce for each other, not by captive consumers of an abstract market.
Moreover, in the event of economic recession, cogent social networks will be the core of economic
and social recovery.

These local businesses appear to accurately respond to the dilemmas felt by the region's producers
and consumers in a rapidly changing farm economy. To gain a more accurate view of these local
economic conditions, this report offers an economic snapshot of the region's farm and food
Finding Food in Farm Country, page 9 Meter/Rosales economies, one that draws upon existing data sources. 4 These data begin to show how money flows through the region as food is both grown and purchased. Unfortunately, existing data are not sufficient to fully answer the questions raised in this study. Further investment and new community ventures are clearly needed. At the same time, local leaders should press academic and community-based researchers to accurately measure the specific economic and social indicators identified here that would effectively show how both the mainstream economy and the emerging citizens' initiatives work to strengthen and/or weaken the local region. 4 All data in this report are for 1997 unless otherwise noted. This year was selected since federal agricultural census data is available for this year, as are Bureau of Economic Analysis, tax and other data. More recent data is available in some cases but is not as complete as for this year. This is also the first year following passage of the Farm Bill of 1996. For a more detailed analysis of how 1997 figures correspond to those of surrounding years, see Appendix E. Note that crop production figures and farm animal populations are measured on January 1, 2000.
Finding Food in Farm Country, page 10                                                             Meter/Rosales

                            The Region's Farm & Food Economies
The southeast Minnesota bluff country hosts a stable farm community built upon lasting social
bonds. Long-term families that settled here a century ago have invested difficult years of labor, and
their most precious financial resources, to build a solid production system. Conservative by nature,
local farmers have also been among the nation's leaders in adopting conservation practices such as
contour plowing and reduced tillage.

Rolling hills and terraces encourage farms to stay relatively small, at least in comparison to prairie
dwellers to the west. Fragile soil and water systems demand the strongest stewardship from farm
families. This is especially true for the karst limestone found under the topsoil, which features long
and unpredictable fissures below the surface, meaning that water (and therefore pollutants) may
spread rapidly.

A region of farmers

All told, the region produces admirable quantities of food commodities. As of the beginning of
2000, more animals than people live in the region. This totals 1.4 million farm animals, including
half a million hogs and pigs, and a similar number of cattle.5 Nearly 150 million bushels of corn and
soybeans are harvested each year, and another 400,000 tons of green peas and sweet corn are raised
for sale to local packers. Over 166 million eggs and 20 million hundredweight of milk are also
produced.6

Farm animal population (January 1, 2000):7
            Hogs & pigs:         494,000
            All cattle:          466,000
            Beef cows:            64,500
            Milk cows:           116,000
            Laying hens:**       235,000
            Sheep & lambs:        12,500
**(includes Dakota and Dodge Counties)

The region's 8,436 farm families earned a total of $866 million dollars by selling crops and livestock
in 1997. Unfortunately, the cost of raising these crops and animals is $80 million more than this
figure – a total of $947 million.

5  Bureau of Economic Analysis data for 1997,  viewed on September 28,
2000. Although BEA data are not directly drawn from the management records of the region's farmers, they are one of
the most frequently used annual summaries of county economic activity.
6 Crop production figures from Minnesota Agricultural Statistics 2000 (Minnesota Department of Agriculture).
7 Minnesota Agricultural Statistics 2000 (Minnesota Department of Agriculture).
Finding Food in Farm Country, page 11 Meter/Rosales To cover these losses incurred by producing commodities and livestock, farmers must find other sources of farm income such as renting crop acreage, offering services for hire, or reaping investment income. All told, the region's farmers earn a total of $129 million of such supplemental income, including government support payments of $42 million.8 Taking this supplemental income into account, farmers earn a total of $48 million in net income. They reap another $30 million of income from increases in farm inventory. An additional $48 million is credited to farmers as the value of labor income and other perquisites (such as the value of living in the farm house). This amounts to an aggregate net income for all farm laborers and proprietors of $122 million.9 It is important to note here that government payments amount to only four percent of farm income. This belies the popular stereotype that farmers are "dependent" on government supports.10 However, these public supports are badly distributed, with 15 percent of the region's larger recipients receiving half of the support payments.11 Net income earned by corporate farms is rather small, at $3.5 million.12 Sales of livestock and related products account for $555 million of farm marketings, while crop production accounts for $311 million.13 The livestock sales figure includes about $300 million worth of dairy products.14 8 Bureau of Economic Analysis data for 1997, viewed on September 28, 2000. These data were taken from 1997 to maintain consistency with other data sources used in this report. This, however, runs the risk of selecting a year that is not typical. When a five-year average of these income and expense items was made, variations were found among the years 1994 to 1998, but all years were reasonably consistent. Using the 1997 findings in this report offers fairly representative numbers (See Appendix E). 9 Bureau of Economic Analysis data for 1997, viewed on September 28, 2000. 10 Bureau of Economic Analysis data for 1997, viewed on September 28, 2000. 11 USDA summaries of farm support payments for the seven counties for 1997. 12 Bureau of Economic Analysis data for 1997, viewed on September 28, 2000. 13 Bureau of Economic Analysis data for 1997, viewed on September 28, 2000. 14 Minnesota Department of Agriculture (2000) Minnesota Agricultural Statistics 2000, 85,95.
Finding Food in Farm Country, page 12                                                                       Meter/Rosales

                                           Source of farm marketings

                               Crops
                                36%

                                                                                       Livestock
                                                                                       & products
                                                                                          64%

The table below shows production of the most important crops in the region. This includes an
overall total of more than 150 million bushels of grain. Moreover, the seven counties produce
enough to feed each man, woman and child living in the region 550 eggs and 1,000 pounds of corn
and peas (for processing) per year.

Production of key crops in 1999:15
              Crop:           Production                     Ave. price         Total value
                                 (1999)                        (1999)           @ ave. price
                    Corn 117 mln bu.                           $1.70             $ 199 mln
               Soybeans       31 mln bu.                       $4.55             $ 141 mln
                    Oats       3.1 mln bu.                     $0.90                $ 2.8 mln
                   Barley      0.4 mln bu.                     $1.25                $ 0.5 mln
                    Milk      20 mln cwt.                     $13.99             $ 294 mln
                 Eggs** 166 mln                                                     $ 6 mln
             Sweet corn 319 mln lb.                               ?                   ?
             Green peas       52 mln lb.                          ?                   ?
**(includes Dakota and Dodge Counties)
Note: "Total value" figures in this table are approximations only and do not agree with "farm marketings" totals above since
not all farm products are sold at the average price.

Moreover, these impressive harvests reflect massive gains in production. The region's corn harvests
increased threefold between 1949 and 1992. Soybean harvests rose by a factor of six, despite the
fact that one of every five acres was taken out of cultivation from 1935 to 1992.16

15  Minnesota Department of Agriculture (2000). Minnesota Agricultural Statistics 2000.
16  University of Minnesota Extension County Summaries: Agricultural Profile. Note that harvest comparisons span
different years than acreage comparisons.
Finding Food in Farm Country, page 13 Meter/Rosales
Changes in crop production from 1949 to 199217
Corn 303%
Wheat -70%
Soybeans 683%
Hay 72%
Oats -77%
Barley -81%
Note: This chart measures changes in total yield for the region in bushels or tons (hay).
This farm economy is a powerful economic engine. The region's farmers buy nearly a billion dollars
of goods and services each year, spending $500 million on interest payments, farm chemicals and
"other" costs, $131 million for feed, $97 million for fertilizer, $73 million for hired labor, and $33
million of petroleum products in 1997. 18
Farm production expenses:19
Feed expenses: $131 million
Livestock: $58 million
Seed: $44 million
Fertilizer: $97 million
Petroleum products: $33 million
Labor costs: $73 million
"Other" expenses** $510 million
Total $947 million
**includes interest payments and farm chemicals
Tragically, there is weakness hidden in this apparent strength. As noted above, farmers spend more
producing commodities than they earn by selling them. Moreover, prices plunged by one-third since
1997. The region's $344 million production of corn, soybeans, oats and barley (listed in the table on
the previous page) for 1999 would have been worth an additional $106 million in 1997.
This report focuses not simply on the level of farm expenditures, but also where farm expenditures
go. We ask, what is the impact of farm production costs on the region itself? While most of the $73
million in labor costs, a cost to farm operators, is earned by nearby residents, and cycles some
money through the region, this is but a small portion of total farm purchases. Certainly some
portion of the feed, seed and livestock expenses is purchased from local producers – but this
proportion appears to be diminishing as farmers increasingly rely on inputs from larger and more
distant corporations. Contract labor costs, repair and maintenance costs, and property tax payments
do cycle a great deal within local communities.
17 University of Minnesota Extension County Summaries: Agricultural Profile. See note above.
18 Bureau of Economic Analysis data for 1997, viewed on September
28, 2000, list a total of $510 million dollars of unspecified expenses – more than half of all production expenses – in
interest payments, farm chemical costs, and "other" costs. USDA Economic Research Service analysts say it is
impossible to tally these "other" payments in greater detail, despite their magnitude.
19 Bureau of Economic Analysis data for 1997, viewed on September
28, 2000.Finding Food in Farm Country, page 14 Meter/Rosales Other production expenses almost certainly leave the region. Most of the $97 million spent on fertilizer each year, as well as costs of farm chemicals, feed, seed, or livestock produced by distant suppliers, leaves the community. Although some of these inputs may be purchased through a local dealer, only a small percentage of the sale price cycles through the local economy. Farmers certainly obtain a product or service of value to them for this money, but most of the potential wealth created by such sales accrues to owners outside the region, who are unlikely to reinvest their profits into the community. In addition, farmers make interest payments to lenders based outside of the region. Very little of this money recycles back into the community, unlike interest paid to local banks. Other expenses farmers pay for farm chemicals, insurance, marketing, land rent, utilities, machinery, or professional services also leave the region.20 Cash rent of course is often paid to neighbors, but may also be paid to absentee owners – who may be former neighbors now living in a southern climate. Existing data, unfortunately, do not allow this crucial measurement to be made with any precision. Significantly, BEA estimates of production expenses show more than half of these expenses as unspecified "other" costs. Prior national studies indicate that the flow of interest payments away from rural communities by itself constitutes a major drain of financial reserves from farm communities.21 If such important indicators continue to be overlooked by federal and state data providers, rural communities will be unable to fully assess whether they gain or lose in their financial transactions – and the outcome is likely to be that rural communities will continue to decline. To better estimate the scale of these farm production costs, these costs were compared to those found in the Minnesota State Colleges and Universities/Novartis Farm Business Management (FBM) Program data22 for farms in Southeast Minnesota, as well as data from the Agricultural Census of 1997.23 The FBM sample of 383 farms is not fully representative of the entire farm region, so any such analysis must be treated with extreme caution. This survey of farm production expenses shows that the largest farms are the most likely to purchase large amounts of feed. Smaller farmers are more likely to spend a higher percentage of their costs on interest payments, but larger farms pay more dollars in interest payments due to the size of loans taken out. Agricultural Census data summarize production expenses based upon a sample of one-fifth of the region's farms. This data is used by the BEA in modeling how money flows through the region. Comparing FBM and Ag Census data, we estimate farm chemical expenses to be $55 to $100 million 20 Minnesota State Colleges & Universities in partnership with Novartis Seeds (1999). Minnesota Management Education Program, Farm Business Management Board. Data posted on web site: , viewed November 9, 2000. 21 Meter, Ken (1990). Money with Roots. Minneapolis: Crossroads Resource Center. 22 Minnesota State Colleges & Universities in partnership with Novartis Seeds (1999). Minnesota Management Education Program, Farm Business Management Board. Data posted on web site: , viewed November 9, 2000). 23 USDA (1997). U.S. Agricultural Census, posted on web site , viewed on February 26, 2001.
Finding Food in Farm Country, page 15                                                                      Meter/Rosales

annually. Another $80 to $100 million appears to be paid as loan interest. Cash rent for land totals
$50 to $70 million per year.

We tallied these numbers, making estimates of the percent of local trading that results from each
expenditure. For instance, of $1.49 paid for each gallon of gasoline, how much of that is devoted to
local costs such as labor, rent to local owners, operating costs which yield income to a local supplier,
or local savings? Obviously such estimates are very rough. Working conservatively, we did establish
some upper and lower bounds.

We concluded that at least $330 million and as much as $570 million flows away from the region
each year as farmers pay for production costs. This money, once spent, does little to add further
value to the region itself. For this report, it is assumed that the actual figure falls within the middle
of this range, about $400 million per year.24

This figure looks quite stark when compared to the total net income of all farms in the region –
including government supports – of $122 million. To the region as a whole, it is economically
senseless to lose three dollars for each dollar earned.

To an individual farm family, continuing to produce on such terms may well be a rational decision.
Farmers have credit debts to pay, a commitment to their farm and community, and have invested
heavily in technology that allows them to use farm income as a way to cover those debts. Still, what
is rational for individual families appears to take a collective toll on the region as a whole.

These imbalances also weaken the condition of farm families relative to others in the seven counties.
For example, although farm families earn only 2% of the region's net income, they pay 14% of the
region's property taxes.25 This is a total of $34 million each year, one quarter of the farmers' net
income.26 Absentee ownership of farmland is substantial, with more than one-quarter (28%) of farm
property taxes paid by non-homesteading owners.27

In sum, as the local farm economy becomes more highly interconnected with larger economic
systems, which have the power and reach to extract value from the Southeast Minnesota region, the
region has suffered a loss of its own ability to create wealth for local residents.

24 For more details on this figure, see Appendix E, page 62.
25
   Minnesota Department of Revenue Sales Tax receipts for 1996, as profiled in University of Minnesota Extension
County Summaries: Profile of Business and Labor; University of Minnesota Extension County Summaries: Agricultural
Profile; Minnesota Department of Revenue Property Tax data: Estimated Distribution of the Net Tax by Use Class by
County Payable in year listed (1974, 1980, 1981, 1997).
26 Minnesota Department of Revenue Property Tax data: Estimated Distribution of the Net Tax by Use Class by

County Payable in year listed (1974, 1980, 1981, 1997); and Bureau of Economic Analysis data for 1997,
 viewed on September 28, 2000.
27 Minnesota Department of Revenue Property Tax data: Estimated Distribution of the Net Tax by Use Class by

County Payable in year listed (1974, 1980, 1981, 1997). Of course, tax payments made by absentee owners who live
outside the region bring a small flow of money into the region's public coffers, but ultimately contribute to a loss of local
control over resources.
Finding Food in Farm Country, page 16                                                               Meter/Rosales

A region of food consumers

At the same time, of course, Southeast Minnesota is also a region of food consumers. The 120,000
households in the seven-county area earn a total of $7.6 billion of household income each year.
Seven percent of this income is devoted to buying food – a total of $506 million dollars. Nearly
$300 million of this food is purchased for home consumption, and the rest is spent eating away from
home.28

When consumer food purchases are aggregated for the entire region, impressive totals are found.
The region's 303,000 consumers spend an estimated $60 million buying beverages, and another $47
million for fresh and frozen fruit and vegetables. Consumers purchase another $34 million of dairy
products, and $32 million of baked goods. An estimated $23 million of beef is purchased each year,
along with $17 million of pork and an equal amount of cereal grains, as well as $13 million of poultry
products.29

Consumer purchases for home consumption:30
                    Beverages:  $ 60 million
                                  includes alcoholic and nonalcoholic
         Fruits and vegetables: $ 47 million
               Dairy products:  $ 34 million
                                  for fresh milk alone: $ 14 million
                  Bakery items: $ 32 million
                          Beef: $ 23 million
                          Pork: $ 17 million
                       Cereals: $ 17 million
                       Poultry: $ 13 million
                  Other meats:  $ 11 million
                   Fats & oils:    $8 million
             Fish and seafood:   $ 6 million
                          Eggs:  $ 2.7 million
              Sugars & sweets:   $13 million

In addition, schools spend $15 million per year providing school lunches to the region's students (a
program that is of course heavily subsidized by the federal government).31 Another $8 million in
food stamps is given to aid low-income consumers.32

However, there is a strong disconnect between this consumer power and the region's producing
power. In fact, the amount of locally produced food sold within the region is small and there seems

28 Food Industry Institute (1999). Food Industry Review; and Bureau of Labor Statistics (1997). Consumer Expenditure
Survey.
29
    Food Industry Institute (1999). Food Industry Review; and Bureau of Labor Statistics (1997). Consumer Expenditure
Survey.
30 Food Industry Institute (1999). Food Industry Review; and Bureau of Labor Statistics (1997). Consumer Expenditure

Survey.
31 Minnesota Department of Children, Families and Learning, "School District Profiles, 1998-1999," available at

32 Bureau of Economic Analysis data for 1997,  viewed on September 28,

2000.
Finding Food in Farm Country, page 17 Meter/Rosales
to be no agency or organization measuring the amount. The only figure available is the Agriculture
Census count of food sold by farmers directly to consumers, a total of $2 million for the region.33
Little of southeast's $506 million in food purchases helps to build farm income in the region.
The primary economic benefit to the local region from these consumer food expenditures is that
some local payments are made for labor, business services, utilities, and other operating costs of
distribution. Certainly some profits are also earned by local owners, but the more that food
marketing channels are owned by outsiders (e.g., national retail chains), the more profits are
extracted from the area. Those consumers who purchase dairy products, meats, cereals, and other
foods produced by the region's processors do contribute to a local stream of wealth creation.
No data exist that would accurately portray how much money leaves the region from food
purchases. It seems that this figure might easily top $400 million per year, and could be far higher.
Once again, this is an area in which public institutions and universities should take the lead to collect
solid data so better analysis can be done.
Data collected should include financial summaries showing what percentage of local producer,
supplier or consumer purchases cycle through the local economy. The amount of interest paid by
farmers and processors to local and outside lenders would also be a key indicator of financial health.
Gauging the extent to which local cash flows cycle through the local economy would be important.
Consumers could be surveyed to track the growth of local food purchases. More accurate data
showing local consumer patterns would help solidify our grasp of local food systems.
A region of food manufacturers & retailers
Southeast Minnesota is also an important producer of value-added food products. The Bureau of
Economic Analysis reports that the region has 48 food manufacturers, earning $242 million in
revenue through manufacturing food and related products. This amounts to 20 percent of all
manufacturing income in the region. Well over half of this revenue is earned in Mower County,
where the food packers of Austin are located.34 As shown on the table below, manufacturing wages
are considerably higher than those for other sectors of the food economy.
Average weekly wage for food-related workers:35
Food Manufacturing $637.56
Agricultural Services $338.86
Retail food $217.35
Eating & Drinking $154.52
Establishments
For most of these manufacturers, a location close to food producers is essential to doing business.
Local processors who manufacture cereal products, meat products, ice cream, cheese, milk, frozen
33 USDA (1997). U.S. Agricultural Census, posted on web site , viewed
on February 26, 2001.
34 Bureau of Economic Analysis data for 1997, viewed on September 28,
2000.
35 Bureau of Economic Analysis data for 1997, viewed on September 28,
2000.Finding Food in Farm Country, page 18 Meter/Rosales or canned vegetables, and feed for livestock contribute mightily to the local flow of income to area farmers. Food is also important in the region's stream of retail commerce. In 1997, the region's 210 retail food stores accounted for $456 million in retail food sales. Another $218 million in revenue was earned by 616 eating and drinking establishments. All told, more than one-third of the region's retail sales is devoted to these food-related purchases.36 Very few of these sales add value to the production of local farmers, however, since most grocers and restaurants sell food that was raised elsewhere. Nor are Southeast shoppers currently demanding local produce in large quantities. A recent survey by SNG Associates in Rochester for the Omega Cooperative shows that two thirds of the region's shoppers purchase their groceries in metropolitan areas, where they can take advantage of national brands and larger distribution networks.37 Increasingly, however, there are signs that local consumers would prefer having the local option available. SNG also found that three of every four shoppers have bought food at a natural foods store, and liked the higher quality and freshness they could obtain through these purchases. Consumers added they were only "somewhat" satisfied with the availability of local produce. An even larger number, 90 percent, thought that opening cooperative food stores would be a good idea.38 Further, a survey performed by Community Design Center earlier this year shows that there is a potential market for local foods. Institutional food buyers report they certainly buy foods that are produced in the region, but do not purchase from local producers. Most say they would buy locally if price, quality and ordering were competitive.39 Summary The Southeast region grows food well and most residents eat fairly plentifully, but the region exports a great deal of its money in the process. Raising its farm products, the region loses about $400 million per year. In buying food, the region leaks perhaps another $400 million. This amounts to a total (conservatively estimated) of approximately $800 million that leaves the region. This money – though currently earned by the region's producers and consumers – fails to build wealth for people who live in the community. 36Bureau of Economic Analysis data for 1997, viewed on September 28, 2000. 37 SNG Associates (2000). Southeastern Minnesota Sustainable Agriculture Consumer Survey. Rochester, October 28. The region as defined for this report included an eighth county, Dakota, that is more suburban in nature. 38 SNG Associates (2000). Southeastern Minnesota Sustainable Agriculture Consumer Survey. Rochester, October 28. The region as defined for this report included an eighth county, Dakota, that is more suburban in nature. 39 Bilek, Petr (2000). Institutional Food Market Survey. Lanesboro: Community Design Center, Hiawatha'a Pantry Project, February 1.
Finding Food in Farm Country, page 19                                                             Meter/Rosales

                           $800 million erodes from the region each year

                     $400 million                                           $400 million

     Lost in buying food                  Few dollars cycle inside the region               Lost in raising food

Thus, the region's farmers could reduce their losses by growing fewer commodities for the
agribusiness economy, and consumers could reduce their losses by purchasing more food directly
from producers. The flows of money created – internal to the region – would likely be smaller than
those now found in the mainstream farm and food economy. Still, each dollar would do more to
create wealth for the region's residents.

This data further suggests there are potentially hundreds of millions of dollars in opportunities for
local value-added food production and processing. If value were added locally for local consumers,
a considerable amount of money could potentially be cycled through these seven counties. Local
businesses could find new markets in adding value to local produce.

Yet this would not be dramatic change. Even if all of the region's residents purchased all of their
foods from local suppliers, which is highly unlikely, this would only directly increase personal
income in the region by a maximum of 6 percent, the percent of household income devoted to food
purchases. Still, the value of these purchases would multiply as this money cycled through other
local businesses.

Economists at the University of Wisconsin–River Falls have found that substantially more money
cycles through local economies when farms are small. Professor Larry Swain, director of the Rural
Development Institute's Survey Research Center there, found that each dollar earned by small farms
in Minnesota and Wisconsin cycles 2.3 times through the local economy, compared to 1.9 times for
larger farms and only 1.6 for the average rural consumer.40
40Interview with economics professor Larry Swain, community development specialist for the University of Wisconsin
Extension Service and director of the Survey Research Center at UW-River Falls, February 12, 2001. See Swain L.B.
Finding Food in Farm Country, page 20 Meter/Rosales Moreover, more local purchases means harm would be reduced. While difficult to quantify, it is clear that as losses are reduced, new wealth and new personal connections would be built among the region's residents, as more local farmers and consumers exchanged goods and services and added value to food commodities. This is borne out by the experience of Sunflower Fields Farm CSA (see page 23). (1999). "A Study of the Economic Contribution of Small Farms to Communities – Completed 1996 to 1999." Unpublished manuscript; and Swain, L. B., & Kabes, D. (1998). "1996 Community Supported Agriculture Report." Unpublished manuscript.
Finding Food in Farm Country, page 21                                                                Meter/Rosales

                          Ecological impacts of current farm practices
Tragically, erosion is also the ecological outcome of current agricultural practices. The soils lying
over the region's limestone karst geology are very loose, providing an excellent medium for growing
food. However, this same quality also makes the soils highly vulnerable to erosion. With each
rainfall, tons of soil are washed into surface waterways.41 Bacteria, fertlizers, and farm chemicals
often cling to the soil, polluting both rivers and lakes. Further, the underlying karst formations have
long fissures that extend underground. As contaminated water enters these cracks in the limestone,
pollutants can rapidly migrate into distant wells or bodies of water. The movement of these
contaminants is accelerated by the steep slopes of many of the farm fields.42 As a result, the Root
River is one of the most sedimented rivers in the state of Minnesota.43

The Pollution Control Agency also lists the southeast region as the part of the state most affected by
nitrate contamination.44 These nitrates come from residential septic systems as well as agriculture,
but one official estimates that 75% of the nitrates found in the region's groundwater come from
agricultural sources.45 Most at risk from nitrate contamination are young children and pregnant
women.46

Nitrates have also contaminated residential and municipal wells in the region. The town of Lewiston
was forced to spend $1 million to dig a deeper well due to nitrate contamination. The town of
Mabel also had to dig a new well for the same reason.47 The Department of Agriculture estimates
that 15 to 20% of the wells it has tested in the southeastern part of the state in a voluntary testing
program have nitrate levels that exceed state health standards.48 In fact, six counties exceed 20%, as
shown on the map, Appendix F, on page 63.

Similarly, the USDA identifies the region as one having high potential for pesticide runoff.49

Recent economic changes may make this situation worse. As the milk price has fallen in recent
years, and as dairy farmers have aged, many farmers have sold their dairy herds. One DNR official
points out that while the number of dairy cows in the region remained about the same from 1990 to
1999, the number of farms fell by 60%. As fewer farms raise pasture crops for dairy animals,
farmers tend to shift to cultivating row crops. With fewer green or cover crops and less crop

41 Interview with Louise Hotka, surface water specialist, Pollution Control Agency, St. Paul, January 11, 2001.
42 Interview with Louise Hotka, surface water specialist, Pollution Control Agency, St. Paul, January 11, 2001.
43 Interview with Louise Hotka, surface water specialist, Pollution Control Agency, St. Paul, January 11, 2001.
44 A map can be found on the PCA web site: .

Viewed January 8, 2001.
45 Interview with Jeff Green, regional groundwater hydrologist, Pollution Control Agency, Rochester, January 12, 2001.
46 Interview with Jennifer Maloney, groundwater specialist, Pollution Control Agency, St. Paul, January 10, 2001.
47 Interview with Bea Hoffmann, Zumbro/Root River Joint Powers Board, Winona, January 10, 2001.
48 Interview with Bruce Montgomery, well-water specialist, Minnesota Department of Agriculture, January 12, 2001.
49 USDA Natural Resources Inventory, 1982 , p. 32, viewed in October, 2000.
You can also read