FIRST-HALF 2021 RESULTS - 26 July 2021 - Lagardère
←
→
Page content transcription
If your browser does not render page correctly, please read the page content below

FIRST-HALF 2021 RESULTS
26 July 2021

First-half 2021 results / 26 July 2021

DISCLAIMER
By reading this presentation, you agree to be bound by the following limitations and qualifications:

This presentation is for information purposes only and does not constitute an offer or solicitation for the sale or purchase of any securities, any part of the business or assets described herein,
or any other interests. It only includes summary information and does not claim to be comprehensive. The information contained in this presentation has not been independently verified.

This presentation may contain forward-looking statements (including objectives and trends) with respect to the financial position, results of operations, strategy, expected future business and
financial performance of Lagardère SA, which are based on management’s current views and assumptions. These data do not represent forecasts regarding Lagardère SA’s results or any
other performance indicator, but rather trends or targets, as the case may be.

When used in this presentation, words such as “anticipate”, “believe”, “estimate”, “expect”, “may”, “intend”, “predict”, “hope”, “can”, “will”, “should”, “is designed to”, “with the intent”, “potential”,
“plan” and other words of similar import are intended to identify forward-looking statements. Such statements include, without limitation, projections for improvements in processes and
operations, revenue and operating margin growth, cash flow, performance, new products and services, current and future markets for products and services and other trend projections, as
well as new business opportunities.

Although Lagardère SA believes that the expectations reflected in such forward-looking statements are reasonable, such statements are not guarantees of future performance. Actual results
may differ materially from the forward-looking statements as a result of a number of risks and uncertainties, many of which are outside our control, including without limitations:
• general economic conditions (notably due to the Covid-19 pandemic health crisis);
• legal, regulatory, financial and governmental risks related to the businesses;
• certain risks related to the media industry (including, without limitation, technological risks);
• the cyclical nature of some of the businesses.

These risks factors and uncertainties are further developed in the “risk factors” section of the Universal Registration Document (the most recent version of which is available on the website
of Lagardère SA, in the Shareholders and Investors’ section, and on the AMF's website).

No representations or warranties, expressed or implied, are made as to, and no reliance should be placed upon, the fairness, accuracy, completeness or correctness of such forward-looking
statements and Lagardère SA, or its affiliates, directors, advisors, employees and representatives, do not assume any liability whatsoever in this respect.

Accordingly, we caution you against relying on forward-looking statements. The abovementioned forward-looking statements are made as of the date of this presentation and neither
Lagardère SA nor any of its subsidiaries undertake any obligation to update or review such forward-looking statements or any other information that may be presented in this presentation
to reflect new information, future events or otherwise, and any opinion expressed in this presentation is subject to change without prior notice. Consequently, neither Lagardère SA nor any of
its subsidiaries are liable for any consequences that could result from the use of any of the abovementioned statements.

This presentation may include certain information on specific transactions that shall be considered as projects only and may remain subject to certain approvals and other conditions.
Lastly, disclosure of monthly revenue trends and flow-through does not indicate a change in Lagardère SA’s communication but is intended to provide investors with more detailed
information in light of the current general economic conditions due to the Covid-19 health crisis. Going forward, Lagardère SA intends to continue to communicate on its quarterly earnings.
                                                                                                                                                                                                              2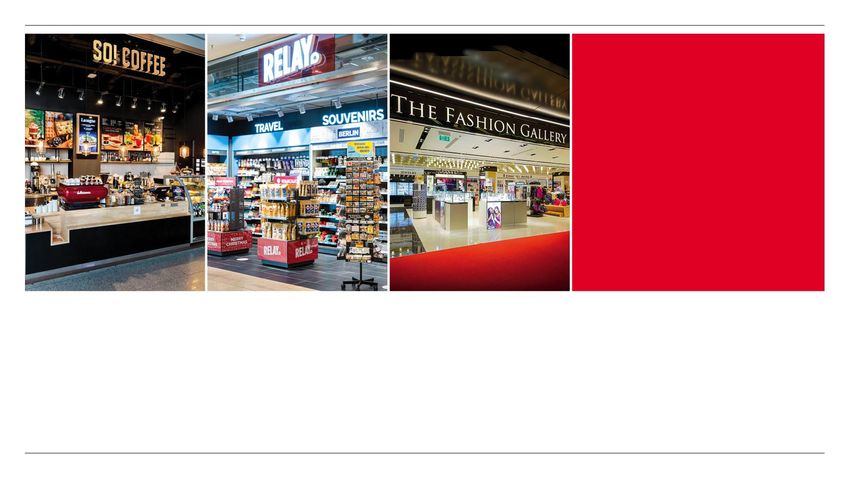
First-half 2021 results / 26 July 2021

                                         H1 2021
                                         HIGHLIGHTS
First-half 2021 results / 26 July 2021

STABLE H1 2021 GROUP REVENUE (YOY): STRONG PERFORMANCE IN PUBLISHING &
TRAVEL RETAIL BENEFITING FROM US TRAFFIC RECOVERY IN AN UNCERTAIN CONTEXT
ROBUST WORK ON PROFITABILITY AND CASH MANAGEMENT
Positive Group free cash-flow: thorough cost optimisation and cash preservation in a reopening context

▪ Lagardère Publishing very strong H1 2021 in a transition period from lockdown to reopening of social venues:
  +19%* yoy revenue growth, exceptional H1 profitability historically, and positive free cash-flow
▪ Lagardère Travel Retail efficient cost discipline and cash preservation in uncertain traffic recovery environment:
  outstanding flow-through at 12.2% and minimised cash consumption in H1 2021
▪ Continued work to streamline cost structure across divisions & rationalise costs at Corporate level

▪ €150m due debt repaid successfully in H1 2021: net debt stable at €1.7bn as of 30 June 2021 (vs. end-2020)
▪ Achieved robust liquidity of €2.0bn as of 30 June 2021: RCF covenant test passed with significant headroom

▪ Shareholders approved the conversion project into a joint-stock company at the GM on 30 June 2021

* On a like-for-like basis                                                                                             4

First-half 2021 results / 26 July 2021

H1 2021 GROUP PERFORMANCE IMPROVED VS. H1 2020,
LED BY FOCUS ON COST EFFICIENCY AND CASH PRESERVATION
H1 2020 comparison basis: impacted by pandemic effects starting in Q2 2020

                             (€m)                                                                                 H1 2020*   H1 2021

                             Revenue                                                                               2,088     2,076

                             Group recurring EBIT**                                                                (218)       3

                             Operating margin**                                                                   -10.4%      0.1%

                             Free cash flow**                                                                      (511)       77

                             o/w free cash flow before changes in WC**                                             (242)      (12)

                             Net debt at end of period**                                                          (2,048)    (1,716)

* Excluding Lagardère Sports which has been classified within discontinued operations in accordance with IFRS 5
** Alternative Performance Measure (APM)
                                                                                                                                       5
First-half 2021 results / 26 July 2021

CHANGE IN REVENUE

                (€m)

                       2,088                   +181                             +8                                     2,076
                         63
                         107                  +18.7%          (87)           +7.9%           (55)                        115
                                                                                                       (59)
                                                             -9.2%
                                                                                                                         831
                         947

                                                                                                                       1,130
                         971

                      H1 2020                Lagardère     Lagardère      Other Activities   Scope      FX             H1 2021
                      revenue                Publishing   Travel Retail                      effect*   effect          revenue

Revenue down -0.6% as reported, up +5.0% like-for-like
▪ €55m negative scope effect and €59m negative currency effect
                                                                                                                Like-for-like vs. H1 2020
* Scope effect including Lagardère Studios                                                                                                  6
First-half 2021 results / 26 July 2021

SIGNIFICANT IMPROVEMENT IN RECURRING EBIT ACROSS DIVISIONS

                   H1 2021 revenue by division                                                                          H1 2021 recurring EBIT by division

                                  Other
                               Activities***                                                                     110
                                   6%
                                   8%*/****

                                                                                                     27                                    H1          H1                        H1           H1
                                                                                                                                          2020        2021                      2020         2021

        Lagardère                                           Lagardère                                H1           H1
                                   €2,076m                                                          2020         2021                                                                       (11)
       Travel Retail                                        Publishing
           40%                     €2,088m**                  54%                                                                                                               (35)
            45%*                                                47%*

                                                                                                                                                      (96)

                                                                                                                                         (209)

                                                                                             Lagardère Publishing                 Lagardère Travel Retail                     Other Activities

* % of H1 2020 revenue
** H1 2020 revenue
*** Other Activities include Lagardère News (Paris Match, Le Journal du Dimanche, Europe 1, Virgin Radio, RFM and the Elle brand license), the Entertainment businesses and the Group Corporate function
**** H1 2020 revenue includes 3% non-retained scope                                                                                                                                                        7
First-half 2021 results / 26 July 2021

                                         PERFORMANCE
                                         BY DIVISION
First-half 2021 results / 26 July 2021
H1 2021 PERFORMANCEFirst-half 2021 results / 26 July 2021
STRONG BOOK SALES GROWTH IN A REOPENING CONTEXT
2020 & 2021 like-for-like revenue
+23%
▪ Strong revenue performance across various segments,
in a context of gradual reopening of leisure venues across
+14% various geographies
▪ Growth supported by all distribution channels, including
+6%
+4% e-commerce
▪ Sustained readers’ interest in e-books and audiobooks,
-3%
despite unfavourable comparison basis in H1 2020
-12%
Q1 Q2 Q3 Q4 Q1 Q2
2020 2021
H1 2021 change* vs. H1 2020: +18.7%
H1 2021 change* vs. H1 2019: +8.9%
* On a like-for-like basis 10First-half 2021 results / 26 July 2021
GENERAL LITERATURE AND ILLUSTRATED BOOKS STILL DRIVING GROWTH
DESPITE SOFTER PERFORMANCE IN OTHER SEGMENTS
H1 2021 revenue by geographic area H1 2021 revenue by activity
Education
10%
UK*** France 11%*
21% 28%
20%* 25%* Illustrated
Books
General 14%
11%*
Spain Literature
5% €1,130m 45% €1,130m
5%* €971m** 49%* €971m**
Other Partworks
Europe 13%
US & 9% 13%*
Canada 9%*
Other
29% Other
31%* 8% 18%
10%* 16%*
▪ Best-sellers in General Literature (The President’s Daughter, Hamnet) & positive dynamics of Illustrated
Books (Billie Eilish, On va déguster l’Italie) in different regions
▪ Education: stable activity in H1 2021 as expected (no reform in France)
▪ Partworks: positive momentum with backlist sales and new launches
▪ Boardgames continued growth: organic and external
* % of revenue in H1 2020
** H1 2020 revenue
*** Including Ireland, Australia and New Zealand 11First-half 2021 results / 26 July 2021
RECORD H1 PROFITABILITY IN AN UNPRECEDENTED ENVIRONMENT
Change in recurring EBIT (€m) ▪ Despite historical H1 seasonality effect, H1 2021 outstanding
and operating margin (%) profitability led by several drivers over the period
▪ Strong demand for Illustrated Books and General Literature
9.7% in a context of lockdown and gradual reopening
• Youth book sales boosted by State incentives for young
readers in France
▪ Positive impact of backlist, including Lupin and Bridgerton
110 ▪ Favourable format mix and distribution channels in
General Literature contributed to increased margins
2.8%
• E-books: 8% of H1 2021 revenue
27 • Audiobooks: 4% of H1 2021 revenue
H1 2020 H1 2021
▪ Ongoing focus on cost efficiency
12First-half 2021 results / 26 July 2021
POSITIVE FREE CASH FLOW AND IMPROVED WORKING CAPITAL
(€m) H1 2020 H1 2021
Cash flow from operations before changes in working capital 33 113
Changes in working capital (114) (37)
Income taxes paid (22) (39)
Cash flow from (used in) operations (103) 37
Purchases/disposals of PP&E and intangible assets (14) (14)
Free cash flow (117) 23
Purchases/disposals of investments (15) 1
Cash flow from (used in) operations and investing activities (132) 24
Free cash flow before changes in working capital (3) 60
13First-half 2021 results / 26 July 2021
H1 2021 PERFORMANCEFirst-half 2021 results / 26 July 2021
US AIR TRAFFIC RECOVERY DRIVING REVENUE IMPROVEMENT OVER H1 2021
2020 & 2021 like-for-like revenue vs. 2019
(vs. passenger traffic) ▪ Revenue correlated to air passenger traffic
+1%
• Accelerating pace of US traffic rebound over Q2 2021
• Positive dynamics in China
• Travel restrictions still affecting Europe
▪ Lagardère Travel Retail benefiting from US domestic
-47%
-54% -54%
travel restart
-61%-61%
-67%
-63%-64%
-69%
-62%-64%
• Significant geographic exposure: 32% of revenue
coming from North America
-82%
-91%
-87% • Relevant footprint in US airports: Travel Essentials
& Foodservice
Jan.- Mar. Apr. May Jun. Jul.- Sep. Oct. Nov. Dec. Jan.- Mar. Apr. May Jun.
Feb. Aug. Feb.
2020 2021
Relay store (Germany) Aelia Duty Free store (France) Bar Louie store (United States) Smullers store (Netherlands)
H1 2021 like-for-like revenue: -58.0%
vs. 2019
H1 2021 global passenger traffic: -68.4%
IATA monthly global passenger traffic figures (RPK ‘Revenue Passenger Kilometres’); arithmetic mean for January-February and July-August 15First-half 2021 results / 26 July 2021
STRATEGIC DIVERSITY OF BUSINESSES & FOOTPRINT ENABLING
LAGARDÈRE TRAVEL RETAIL TO BENEFIT FROM TRAFFIC RECOVERY
H1 2021 revenue by geographic area H1 2021 revenue by activity
Greater China
14%
7%*
Duty Free &
Other Asia-Pacific Fashion
US & Canada 3% 31%
32% 5%* 36%*
26%*
Travel
€831m France
Essentials €831m
€947m** 17% €947m**
20%* 48%
42%*
EMEA
(excluding Foodservice
France) 21%
22%*
34%
42%*
▪ Rebalancing of geographical presence driven by traffic recovery: +24% performance in US and +90% in Greater
China vs. H1 2020***
▪ Duty Free still affected by low international passenger travel: -65% vs. H1 2019***
▪ Stronger performance in Travel Essentials and Foodservice thanks to diversified distribution channels and
domestic traffic improvement: -47% and -60% vs. H1 2019***
* % of revenue in H1 2020
** H1 2020 revenue 16
*** On a like-for-like basisFirst-half 2021 results / 26 July 2021
INCREASING OPERATING EFFICIENCIES: OUTSTANDING FLOW THROUGH IN H1 2021
Flow through vs. 2019
24.3%
▪ Outstanding 12.2% flow through delivered in H1 2021
16.7%
12.2% ▪ Keeping up massive efforts to variabilise and reduce costs
in a low air traffic environment
H1 2020 H2 2020 H1 2021
• Adjusting rent in line with revenue decrease, selective store
openings, government support and strict cost control
Cost savings (as % of revenue change vs. 2019)
• Achieved €1.0bn cost savings in H1 2021, incl. €320m fixed
88% cost reduction for the period (vs. H1 2019)
83%
76%
26% 28%
21%
▪ Ongoing roll-out of LEAP in line with expected plan
55% 57% 60% • Target €100m additional cost savings at 2019 revenue level
H1 2020 H2 2020 H1 2021
Variable cost savings Fixed cost savings
17First-half 2021 results / 26 July 2021
SIGNIFICANT FREE CASH FLOW IMPROVEMENT THANKS TO
EXCELLENT FLOW THROUGH, SOLID WORKING CAPITAL & CAPEX CONTROL
▪ Limited cash consumption in H1 2021 despite low air traffic globally: positive free cash-flow when taking
into account favourable working capital
(€m) H1 2020 H1 2021
Cash flow from operations before changes in working capital (136) (43)
Changes in working capital (201) 122
Income taxes paid (2) 1
Cash flow from (used in) operations (339) 80
Purchases/disposals of PP&E and intangible assets (71) (25)
Free cash flow (410) 55
Purchases/disposals of investments 7 (2)
Cash flow used in operations and investing activities (403) 53
Free cash flow before changes in working capital (209) (67)
18First-half 2021 results / 26 July 2021
OTHER
ACTIVITIESFirst-half 2021 results / 26 July 2021
NEWS BUSINESSES GROWTH VS. H1 2020 IN A REOPENING ENVIRONMENT
H1 2021 revenue by activity ▪ Other Activities revenue growth at +7.9% vs H1 2020***
• Press & Radio revenue growth vs. H1 2020, due to favourable base
effect and advertising sales recovery as restrictions are loosened
• Outperformance of in-house ad agency vs. market, across all media****
Press &
Radio Licenses • Strong momentum of Le Journal du Dimanche
41%
38%*
€115m 45%
46%*
€107m** • ELLE brand license growth vs. H1 2020 on the back of post-
lockdown environment
• Virtually all event venues closed in H1 2021 due to health measures
Other
14% ▪ Other Activities -€11m recurring EBIT affected by revenue decrease
16%*
• Ongoing work on cost savings
* % of revenue in H1 2020
** H1 2020 revenue
*** On a like-for-like basis
**** Market: IREP & SRI data for January-May 2021 20First-half 2021 results / 26 July 2021
GROUP
RESULTSFirst-half 2021 results / 26 July 2021
H1 2021 CONSOLIDATED INCOME STATEMENT
(€m) H1 2020* H1 2021
Revenue 2,088 2,076
Group recurring EBIT (218) 3
Income (loss) from equity-accounted companies** (23) (22)
Non-recurring/non-operating items (156) (98)
o/w IFRS 16 impacts on concession agreements (17) (37)
Total EBIT (397) (117)
Finance costs, net (41) (25)
Interest expense on lease liabilities (39) (32)
Profit (loss) before tax (477) (174)
Income tax (expense) benefit 48 (3)
Profit (loss) for the period from continuing activities (429) (177)
Gain (loss) from discontinued operations*** (8) 5
Profit (loss) for the period (437) (172)
Attributable to minority interests (15) (1)
Profit (loss) – Group share**** (422) (171)
* Restated for 1st IFRS 16 – Covid-19 amendment
Adjusted profit (loss) – Group share***** (276) (86) ** Before impairment losses
*** Lagardère Sports
**** Including profit (loss) from Lagardère Sports
***** Excluding Lagardère Sports which has been classified within discontinued operations in accordance with IFRS 5 22First-half 2021 results / 26 July 2021
H1 2021 CONSOLIDATED STATEMENT OF CASH FLOWS
(€m) H1 2020 H1 2021
Cash flow from (used in) operations before changes in working capital (138) 38
Changes in working capital (269) 88
Income taxes paid (15) (11)
Net cash from (used in) operations (422) 115
Purchases/disposals of PP&E and intangible assets (89) (38)
Free cash flow (511) 77
o/w free cash flow before changes in WC (242) (12)
Purchases of investments (14) (39)
Disposals of investments 30 69
Net cash from (used in) operations and investing activities (495) 107
Dividend paid (4) (13)
Interest paid (34) (33)
Other items (54) (44)
Change in net debt (587) 17
23First-half 2021 results / 26 July 2021
ROBUST LIQUIDITY WITH €2.0BN AVAILABLE AS OF 30 JUNE 2021
1,970
Debt maturity profile (€m)
1,102
784
596 580 186
440 93 93 100
868 72 189
498 100 498
368 84 298
80 5 93
Available H2 2021 2022 2023 2024 2025 2026 &
liquidity beyond
Cash position RCF - undrawn Commercial
Commercial paper Bonds
paper Bonds Loans
Loans & other PGE*
& other PGE
▪ €2.0bn available liquidity (as of 30/06/21) including €868m cash position and €1.1bn fully undrawn RCF amount
• €45m cash inflow in Q2 2021 related to Lagardère Sports sale contract settlement (AFC), as planned
▪ €150m bilateral loan successfully repaid as planned in June 2021
▪ Next bond maturity: April 2023
Note: undrawn Group credit facility excluding authorised credit lines at divisional level
* PGE simulation for the sake of presentation. No decision announced yet on PGE repayment/extension. 24First-half 2021 results / 26 July 2021
OUTLOOK
▪ Lagardère Publishing sales normalising on the back of higher attendance of social venues in 2021
• Positive impact of new Asterix release in Q4 2021 to be offset by absence of curriculum reform in France
• Profitability expected to benefit from favourable sales mix: 2021 operating margin* slightly above 10%
▪ Lagardère Travel Retail revenue dependent on air traffic trends: taking advantage of recovery in an efficient
way thanks to diversified footprint and segments, in an uncertain environment due to variants
• Minimising flow-through to 15-20% level in 2021 (vs. 2019): adjusting operational capacity to pace of
recovery while optimising costs
• Preserving cash by containing Capex and managing Working capital
▪ Continued efforts on Corporate cost reduction
* Lagardère Publishing recurring EBIT divided by Lagardère Publishing revenue - see Glossary. 25First-half 2021 results / 26 July 2021
APPENDICES TO
THE
CONSOLIDATED
ACCOUNTSFirst-half 2021 results / 26 July 2021
CHANGES IN SCOPE: MAIN ITEMS
▪ Lagardère Publishing
• Disposal of J’ai Lu Éditions in April 2021 to Madrigall Group
• Acquisition in June 2021 of Hiboutatillus, a French boardgame publisher specialized in party games
• Acquisition in June 2021 of Illuminate Publishing, UK’s educational publisher
• Acquisition in June 2021 of Maxima, French publisher specialized in academic books
27First-half 2021 results / 26 July 2021
REVENUE BY GEOGRAPHIC AREA
29%
26% 26% 27%
25%
21%
12%
10% 9% 9%
3% 3%
H1 H1 H1 H1 H1 H1 H1 H1 H1 H1 H1 H1
2020 2021 2020 2021 2020 2021 2020 2021 2020 2021 2020 2021
France Western Europe Eastern Europe USA & Canada Asia-Pacific Latin America,
Middle East, Africa
28First-half 2021 results / 26 July 2021
SUMMARY OF PERFORMANCE BY DIVISION – H1 2021
▪ Revenue
H1 2021 Consolidated Consolidated Like-for-like change*
(€m) change change (%) (%)
Lagardère Publishing 1,130 +159 +16.4 +18.7
Lagardère Travel Retail 831 -116 -12.3 -9.2
Other Activities 115 +8 +7.5 +7.9
Target scope 2,076 +51 +2.5 +5.0
Non-retained scope (formerly Lagardère Active) - -63 -100 -
Total 2,076 -12 -0.6 +5.0
▪ Recurring EBIT**
H1 2021 Consolidated Consolidated Flow through
(€m) change change (%) vs. 2019 (%)
Lagardère Publishing 110 +83 +311 n.a.
Lagardère Travel Retail (96) +113 +54 (12.2)
Other Activities (11) +24 +67 n.a.
Target scope 3 +220 +101 n.a.
Non-retained scope (formerly Lagardère Active) - +1 n.a. n.a.
Total 3 +221 +101 n.a.
* At constant scope and exchange rates
** Alternative Performance Measure (APM) – See Glossary 29First-half 2021 results / 26 July 2021
ANALYSIS OF NON-RECURRING/NON-OPERATING ITEMS
Non-retained
scope
Lagardère Lagardère Other Total (formerly
Total Total
(€m) Publishing Travel Retail Activities Target scope Lagardère Active) H1 2021 H1 2020*
Recurring EBIT** 110 (96) (11) 3 - 3 (218)
Income (loss) from equity-accounted
- (22) - (22) - (22) (23)
companies
Restructuring costs (3) (3) (20) (26) - (26) (12)
Gains (losses) on disposals 16 1 3 20 - 20 (8)
Impairment losses - (6) - (6) - (6) (63)
Amortisation of acquisition-related intangible
(3) (46) - (49) - (49) (56)
assets and other acquisition-related expenses
IFRS 16 impact on concession agreements &
5 (42) - (37) - (37) (17)
gains and losses on leases
EBIT 125 (214) (28) (117) - (117) (397)
* Restated for 1st IFRS 16 Covid-19 amendment
** Alternative Performance Measure (APM) – See Glossary 30First-half 2021 results / 26 July 2021
ADJUSTED PROFIT – GROUP SHARE
(€m) H1 2020* H1 2021
Profit (loss) for the period (437) (172)
Restructuring costs 12 26
Gains/losses on disposals 8 (20)
Impairment losses on goodwill, PP&E, intangible assets and investments
63 6
in equity-accounted companies
Amortisation of acquisition-related intangible assets and other acquisition-related expenses 56 49
IFRS 16 impact on concession agreements 47 62
Tax effects on the above transactions (39) (28)
Profit (loss) from discontinued operations 8 (5)
Adjusted profit (loss) (282) (82)
Attributable to minority interests 6 (4)
Adjusted profit (loss) – Group share** (276) (86)
* Restated for 1st IFRS 16 Covid-19 amendment
** Alternative Performance Measure (APM) – See Glossary 31First-half 2021 results / 26 July 2021
GROUP RECURRING EBIT TO ADJUSTED PROFIT (LOSS) – GROUP SHARE
(€m) H1 2020* H1 2021
3 9 6
(9) (7) (4)
(23) (22) (25) (31)
(41)
(86)
(218)
(276)
Income tax
Group Income (loss) Interest expense excluding Adjusted profit (loss) Adjusted
expense on lease Finance costs, attributable
recurring from net tax adjustments on profit (loss) – Group
EBIT** equity-accounted liabilities – buildings non-recurring and to minority share**
companies*** and other leases non-operating items interests
* Restated for 1st IFRS 16 Covid-19 amendment
** Alternative Performance Measure (APM) – See Glossary
*** Before impairment losses 32First-half 2021 results / 26 July 2021 FREE CASH FLOW RECONCILIATION (€m) H1 2020* H1 2021 Cash flow from operating activities before changes in working capital 27 153 Repayment of lease liabilities (113) (94) Interest paid on lease liabilities (37) (11) Changes in working capital of lease liabilities (15) (10) Cash flow from (used in) operations before changes in working capital (138) 38 Changes in working capital (269) 88 Income taxes paid (15) (11) Cash flow from (used in) operations (422) 115 Purchases of property, plant & equipment and intangible assets (90) (50) Disposals of property, plant & equipment and intangible assets 1 12 Free cash flow* (511) 77 * Restated for 1st IFRS 16 Covid-19 amendment ** Alternative Performance Measure (APM) – See Glossary 33
First-half 2021 results / 26 July 2021

CONSOLIDATED BALANCE SHEET
                                                                                                                        Equity and liabilities
                                                Assets*
                       (€m) 31 Dec. 2020                        30 Jun. 2021                                          31 Dec. 2020       30 Jun. 2021

                                                                                                                          827
                                                                                                                                           686          Total equity
   Intangible assets                 2.436
                                                                     2.426                                               1.733                          Net debt**
                                                                                                                                          1.716

Right-of-use assets
                                                                                                                                                        Lease liabilities
          (IFRS 16)                  1.939                           1.669                                               2.246            2.047         (IFRS 16)

        Other assets                 1.239                           1,247                                                767               779         Other liabilities

     Working capital                 2.180                           2.139                                               2.221            2.253         Working capital

                                     7.794                           7.481                                               7.794            7.481

* Excluding assets included in net debt
** Net of cash and cash equivalents, short-term investments and derivative instruments designated as hedges of debt
Alternative Performance Measure (APM) – See Glossary                                                                                                                        34
First-half 2021 results / 26 July 2021
CONSOLIDATED BALANCE SHEET
(€m) 31 Dec. 2020 30 Jun. 2021
Non-current assets 5,519 5,219
Investments in equity-accounted companies 52 34
Current assets 2,223 2,228
Short-term investments and cash 687 868
Assets held for sale - -
TOTAL ASSETS 8,481 8,349
Total equity 827 686
Non-current liabilities 2,413 2,263
Non-current debt* 1,627 2,062
Current liabilities 2,821 2,816
Net debt** of €1,716m
Current debt 793 522
(vs. €1,733m at 31 Dec. 2020)
Liabilities associated with assets held for sale - -
TOTAL EQUITY AND LIABILITIES 8,481 8,349
* Including €7m in long-term derivative assets at 30 June 2021 and €16m at 31 December 2020
** Alternative Performance Measure (APM) – See Glossary 35First-half 2021 results / 26 July 2021
GLOSSARY (1/3)
Lagardère uses alternative performance measures which serve as key indicators of the Group's operating and financial performance.
These indicators are tracked by the Executive Committee in order to assess performance and manage the business, as well as by investors in order
to monitor the Group's operating performance, along with the financial metrics defined by the IASB. In the context of the first-time application of
IFRS 16 – Leases, effective 1 January 2019, the Group has elected to retain its existing alternative performance measures with certain modifications,
in particular the neutralisation of pure accounting effects and distortions created by the new standard on the concession's businesses. From
1 January 2019, these indicators are monitored by the Executive Committee to assess operating performance and manage the business, along
with the financial metrics defined by the IASB. These indicators are calculated based on accounting items taken from the consolidated financial
statements prepared under IFRS and a reconciliation with those items is provided either in this presentation or in the press release or in the notes
to the consolidated financial statements. A dedicated presentation relating to the impacts of IFRS 16 on the alternative performance indicators was
held on 12 February 2019 and is available on the Lagardère website
(http://www.lagardere.com/fichiers/fckeditor/File/Relations_investisseurs/Publications/2019/IFRS16/2019_Session_IFRS_16.pdf)
▪ Recurring EBIT. The Group's main performance indicator is recurring operating profit of fully consolidated companies, which is calculated as
follows:
Profit before finance costs and tax excluding:
• Income (loss) from equity-accounted companies before impairment losses
• Gains (losses) on disposals of assets
• Impairment losses on goodwill, property, plant and equipment, intangible assets and investment in equity-accounted companies
• Net restructuring costs
• Items related to business combinations:
- Acquisition-related expenses
- Gains and losses resulting from purchase price adjustments and fair value adjustment due to changes in control
- Amortisation of acquisition-related intangible assets
• Specific major disputes unrelated to the Group's operating performance
• Items related to leases and finance sub-leases:
- Cancellation of fixed rental expense* on concession agreements
- Depreciation of right-of-use assets on concession agreements
- Gains and losses on leases
(See reconciliation on page 30)
* Cancellation of fixed rental expense is equal to the repayment of the lease liability, the associated change in working capital and interest paid in the statement of cash flows 36First-half 2021 results / 26 July 2021 GLOSSARY (2/3) ▪ Flow through is calculated by dividing the change in recurring operating profit of fully-consolidated companies (recurring EBIT) by the change in revenue. This indicator is used by the Group in the context of the Covid-19 pandemic to measure the effect of the decline in revenue on recurring EBIT (See reconciliation on page 17) ▪ The like-for-like change in revenue is calculated by comparing: • H1 2021 revenue to exclude companies consolidated for the first time during the period, and H1 2020 revenue to exclude companies divested in H1 2021; • H1 2021 and H1 2020 revenue based on H1 2020 exchange rates (See reconciliation in note 4 to the 2021 condensed consolidated interim financial statements) ▪ Operating margin is calculated by dividing recurring EBIT of fully consolidated companies (recurring EBIT) by revenue ▪ Recurring EBITDA over a rolling 12-month period is calculated as recurring operating profit of fully consolidated companies (Group recurring EBIT) plus dividends received from equity-accounted companies, less depreciation and amortisation charged against property, plant and equipment and intangible assets, amortisation of the cost of obtaining contracts, and the cancellation of fixed rental expense* on property and other leases, plus recurring EBITDA from discontinued operations ▪ Free cash flow is calculated as cash flow from operations before changes in working capital, the repayment of lease liabilities and related interest paid, changes in working capital and interest paid plus net cash flow relating to acquisitions and disposals of property, plant and equipment and intangible assets (See reconciliation on page 33) ▪ Free cash flow before changes in working capital is calculated as free cash flow deducted from the change in working capital ▪ Net debt is calculated as the sum of the following items: short-term investments and cash and cash equivalents, financial instruments designated as hedges of debt, non-current debt and current debt (See reconciliation on page 35) * Cancellation of fixed rental expense is equal to the repayment of the lease liability, the associated change in working capital and interest paid in the statement of cash flows 37
First-half 2021 results / 26 July 2021

GLOSSARY (3/3)

▪ Adjusted profit – Group share is calculated on the basis of profit for the period, excluding non-recurring/non-operating items, net of the related tax and
  of minority interests, as follows:
   Profit for the period excluding:
   •   Gains (losses) on disposals of assets
   •   Impairment losses on goodwill, property, plant and equipment, intangible assets and investments in equity-accounted companies
   •   Net restructuring costs
   •   Items related to business combinations:
       - Acquisition-related expenses
       - Gains and losses resulting from purchase price adjustments and fair value adjustments due to changes in control
       - Amortisation of acquisition-related intangible assets
   •   Specific major disputes unrelated to the Group's operating performance
   •   Tax effects of the above items
   •   Non-recurring changes in deferred taxes
   •   Items related to leases and finance sub-leases:
       -   Cancellation of fixed rental expense* on concession agreements
       -   Depreciation of right-of-use assets on concession agreements
       -   Interest expense on lease liabilities under concession agreements
       -   Gains and losses on leases
   • Adjusted profit attributable to minority interests: profit attributable to minority interests adjusted for minorities' share in the above items
   (See page 31 for reconciliation with Profit for the period)

* Cancellation of fixed rental expense is equal to the repayment of the lease liability, the associated change in working capital and interest paid in the statement of cash flows   38
First-half 2021 results / 26 July 2021
IFRS 16
IMPACT ON THE
CONSOLIDATED
ACCOUNTSFirst-half 2021 results / 26 July 2021 IMPACT OF IFRS 16 ON THE CONSOLIDATED INCOME STATEMENT AND RELATED INDICATORS (€m) H1 2020* FY 2020 H1 2021 Recurring EBITDA** (1) (2) (2) Group recurring EBIT** +7 +13 +7 Income from equity-accounted companies*** 2 - - Non-recurring/non-operating items (17) (17) (37) Of which cancellation of fixed rental expense**** – concession stores +128 +213 +71 Of which depreciation of right-of-use assets – concession stores (225) (401) (156) Of which gains and losses on leases +80 +171 +48 Total EBIT (8) (4) (30) Of which impact from concession stores (17) (17) (42) Of which impact from buildings and other +9 +13 +12 Finance costs, net (2) (1) +1 Lease interest expense (39) (74) (32) Of which impact from concession stores (30) (57) (25) Of which impact from buildings and other (9) (17) (7) Profit before tax (49) (79) (61) Income tax expense +12 +18 +14 Profit (loss) from discontinued operations - - - Profit for the period (37) (61) (47) Of which impact from concession stores (35) (57) (51) Of which impact from buildings and other (2) (4) +4 Attributable to minority interests - - - Profit – Group share (37) (61) (47) Adjusted profit – Group share** (4) (4) (1) * Restated for1st IFRS 16 Covid-19 amendment / ** Alternative Performance Measure (APM) – See Glossary / *** Before impairment losses. 40 **** Cancellation of fixed rental expense is equal to the repayment of the lease liability, the associated change in working capital and interest paid in the statement of cash flows.
First-half 2021 results / 26 July 2021

IMPACT OF IFRS 16 ON THE CONSOLIDATED STATEMENT OF CASH FLOWS
 (€m)                                                                    H1 2020*   FY 2020   H1 2021

 Cash flow from operating activities before changes in working capital      +171      +295      +111

 Repayment of lease liabilities                                             (113)     (236)      (94)

 Interest paid on lease liabilities                                          (37)      (49)      (11)

 Changes in working capital from lease liabilities                           (15)       (5)      (10)

 Cash flow from operations before changes in working capital                  +6        +5        (4)

 Changes in working capital                                                   (7)       (8)       +3

 Income taxes paid                                                              -         -         -
 Cash flow from operations                                                    (1)       (3)       (1)
 Purchases of property, plant & equipment and intangible assets                 -         -         -
 Disposals of property, plant & equipment and intangible assets                 -         -         -
 Free cash flow**                                                             (1)       (3)       (1)
  Purchases of investments                                                     -         -         -
  Disposals of investments                                                    +1        +3        +1
 Cash flow from operations and investing activities                             -         -         -
  Dividend paid and other                                                       -         -         -
  Net cash from discontinued operations                                         -         -         -
  Interest paid                                                                 -         -         -
 Change in net debt                                                             -         -         -
 Net debt**                                                                     -         -         -

* Restated for 1st IFRS 16 Covid-19 amendment
** Alternative Performance Measure (APM) – See Glossary                                                 41
First-half 2021 results / 26 July 2021

IMPACT OF IFRS 16 ON THE CONSOLIDATED BALANCE SHEET

 (€m)                                    31 Dec. 2020   30 Jun. 2021   (€m)                                 31 Dec. 2020   30 Jun. 2021

                                                                       Total equity                               (187)          (239)
 Non-current assets                          +2,022         +1,764
                                                                       Non-current liabilities                  +1,843         +1,690

 Right-of-use asset                          +1,939         +1,669     Lease liability – non-current            +1,833         +1,678
    o/w concession stores                      +1,541         +1,288     o/w concession stores                    +1,400         +1,265

    o/w buildings and other                      +398           +381     o/w buildings and other                    +433           +413

                                                                       Deferred tax liabilities                     +10            +11
 Deferred tax asset                              +68            +80
                                                                       Non-current debt                                -              -
                                                                       Current liabilities                        +364           +322
 Other non-current assets                        +18            +18
                                                                       Lease liability – current                  +413           +369
 Investments in equity-accounted
                                                                         o/w concession stores                      +342           +299
 companies                                        (3)            (3)
                                                                         o/w buildings and other                     +71            +70

 Current assets                                   (2)            +9    Other current liabilities                   (49)           (47)

 Short-term investments and cash                    -              -   Current debt                                    -              -
                                                                       Liabilities associated with assets
 Assets held for sale                               -              -   held for sale                                   -              -
 TOTAL ASSETS                                +2,020         +1,773     TOTAL EQUITY AND LIABILITIES             +2,020         +1,773

                                                                                                                                          42
You can also read