FMG Monthly Update A Complete Roundup Across Key Assets - ATB Financial
←
→
Page content transcription
If your browser does not render page correctly, please read the page content below

FMG Monthly Update A Complete Roundup Across Key Assets

Agenda

Macro Overview……………………………………………………..3
Trending Map…………………………………………………………7
Canadian Dollar………………………………………………………8
DXY and Interest Rates…………………………………............11
WTI and Canadian Crudes……………………………………..12
Natural Gas…………………………………………………………....14
USDCAD Regressions……………………………………………..15
Macro Overview
Priced for Vaccination
The Outlook At Times Seems Binary: Vaccination or Bust
2021 is off to a muddled started. Stock markets swooned in early                If Israel is any indication we still have long fight ahead of us and the
January before finding their footing and rallying in unison with the            path won’t be linear. Israel has vaccinated by far the largest portion
S&P 500 reaching fresh record highs by mid-month. WTI surged                    of its population of any country to date – a full 53% have received at
above US$53, and the Loonie traded to its best levels since 2018.               least one dose compared to about 9% for the US and a paltry 2.5%
Everything was moving in the right direction, and an explosive post-            for Canada. And yet even at that pace lockdowns are still required.
COVID recovery seemed assured and right at our fingertips.
                                                                                The newer COVID variants move faster. Faster than the needle and
In the past two weeks or so reality has struck with its usual force.            the faster than our manufacturing and supply chains. And ICU
Vaccine supplies have become scarce. Logistical rollouts have been              availability still rules the day with regard to the policy response.
bottlenecked to the point where vaccine nationalism is now a thing.             Early efforts will pay-off, but we may not see the immediate benefits
And stock markets were seemingly turned on their head as bands of               until at least the spring time. However, there are some green shoots
retail traders took on the hedge funds and won the day. Is this the             to take note of, and I for one remain optimistic on the outlook
start of another bout of extreme volatility across assets?                      despite the challenges in front of us. So let’s take a quick look at the
                                                                                current set-up.
The strong trends in place throughout Q4 2020 are being tested –
it’s nothing catastrophic at the moment, but certainly the trend of
risk assets rallying in uniform fashion seems a bit tired and out of
place at the moment. And perhaps it should.
                                                                                   Highlight  text in abeen
                                                                                    Has the recovery   callout box in?
                                                                                                            priced would
                                                                                                                       Andbeifideally
                                                                                                                               so, what
                                                                                   set up like this (Open Sans  Bold
                                                                                    happens if it doesn’t show up?   12pt)

                                                               FMG Monthly Update | Feb 2021                                            ATB Capital Markets | 3
Macro Overview
Reasons for Optimism
There Has Been Some Improvement In Hospitalization and Case Rates
It has been about 25 days since the US started to administer vaccines and there are some positive takeaways even though they are minor yet. In
the US, we note a distinct drop in the hospitalization rate as well as the number of people on ventilators. New daily case rates are also declining
in a rather sharp fashion. Most encouragingly, deaths in long term care facilities, which have received a higher rate of vaccinations than
the general population, have improved. And that last point is excellent news – there are fewer vulnerable people exposed to severe health
outcomes which is one of the keys that must be achieved before re-opening on a larger scale. These data point to an improving trend – but as
you can see the starting point was very dire to begin within and thus there is a lot of work yet to do.
US Hospitalizations and Ventilators Per Million US Daily New Cases
450 30 450,000
400 400,000
25
350 350,000
300 20 300,000
250 250,000
15
200
200,000
150 10
150,000
100
5 100,000
50
50,000
0 0
-
US Current Hospitalizations (LHS) US Currently On Ventilator (RHS) Daily New Cases 5-day Moving Average
Sources: Covid Tracking Project, Bloomberg, ATB FMG
FMG Monthly Update | Feb 2021 ATB Capital Markets | 4Macro Overview
Reasons for Caution
Vaccination Rollouts Have Been Very Slow in Some Countries…But the US is on Track
Even for developed countries the differences in vaccine availability are stark. Canada may have “secured” the most doses per capita amongst our
peers but we don’t have any manufacturing capabilities and thus are dependent on others to honour commitments. This nebulous arrangement
finally came to its logical conclusion last week when the EU effectively rolled out vaccine nationalism: Doses are now prioritized for EU member
states ahead of exports. Regardless, distribution has been slow and questions remain regarding efficacy against the newer variants with J&J’s
iteration only proving 66% effective against the South African strain – far below the ~90% threshold from earlier Pfizer and Moderna versions.
Yet if we extrapolate the current run rate for shots delivered in the US, by the beginning of September at least one shot will have been
administered to 83% of the population. The pace could increase, or it could slow, or the shots could prove less effective. A lot has to go right.
But given the current pace of administration, and the current range of variants, the US is on track to achieve herd immunity by late Q3/early Q4.
Global: Vaccine Doses Administered Per 100 People US and Canada: Shots Delivered % of Population
60 9.00%
8.18%
50 8.00%
7.00%
At the current pace, the US will have
40 delivered at least one dose to 83% of
6.00%
the population by September
30 5.00%
4.00%
20 2.42%
3.00%
10 2.00%
0 1.00%
Israel
Bahrain
Serbia
Iceland
Italy
Finland
Greece
Norway
Slovenia
Russia
Poland
Austria
Netherlands
Mexico
Ireland
Kuwait
Argentina
Guinea
Spain
Germany
Canada
Slovakia
France
Hungary
China
U.A.E.
U.K.
U.S.
Denmark
Sweden
Saudi Arabia
Czech Republic
0.00%
Dec-20 Dec-20 Dec-20 Jan-21 Jan-21 Jan-21 Jan-21
Canada USA
Sources: Covid Tracking Project, Bloomberg, ATB FMG
FMG Monthly Update | Feb 2021 ATB Capital Markets | 5Macro Overview
Conclusion: Priced for Vaccination With Little Room for Error
Global Growth Could be Set for Take Off…
This leads us to conclude that the outlook is positive. PMI’s are pointing to an expansion of activity, employment trends are improving, and
demand for commodities remains high. China’s latest 5-year plan, the 14th iteration, could be one of the most forceful for global growth since
the early 2000’s: The trend towards urbanization is not complete with the government targeting 80% urbanization over the next 15yrs compared
with 60% at present. Record fiscal and monetary stimulus have the ability to pull up incomes for the middle class, which on balance will lead to
greater aggregate demand in the coming years, especially for commodities. Yet there are risks. How much good news is left to price in?
Equity markets pay for future performance and at current 22x forward earnings there is little room for error. Earnings will have to surprise to the
upside for the rally to extend. And what if the Fed removes stimulus sooner than currently anticipated? That could lead to a rather forceful re-
pricing. But the green shoots from early vaccination results and trajectories for herd immunity give us reason for optimism.
PMI’s Are Improving, Well Above Key 50 Level… ...But Is That Enough? S&P 500 P/E Ratio Near Record
65
26.00
60 Expansion 24.00
55
22.00
50
20.00
45
P/E Ratio
Contraction 18.00
40
35 16.00
30 14.00
Jun-18
Jun-19
Jun-20
Aug-18
Aug-19
Aug-20
Feb-18
Apr-18
Oct-18
Dec-18
Feb-19
Apr-19
Oct-19
Dec-19
Feb-20
Apr-20
Oct-20
Dec-20
Feb-21
12.00
10.00
US Canada China
1991
1993
1995
1997
1999
2001
2003
2005
2007
2009
2011
2013
2015
2017
2019
2021
Sources: Bloomberg, ATB FMG
FMG Monthly Update | Feb 2021 ATB Capital Markets | 6What’s Trending? After a Stellar Run in Q420, Markets Are Consolidating
Trending Map: Mapping January returns vs. December returns reveals a market mostly treading water heading into
February with commodities like oil and soybeans notable exceptions
12.00%
Reversing Up Trending Up
10.00%
8.00% WTI
SoyBeans
6.00%
Copper
DXY CAD
January Return
4.00%
HYG
CNY
2.00%
GBP
NOK
0.00%
AUD
-2.00% JPY TSX EUR
S&P 500
TLT
-4.00% MXN
BRL
-6.00%
Trending Down Reversing Down
-8.00%
-8.00% -6.00% -4.00% -2.00% 0.00% 2.00% 4.00% 6.00% 8.00% 10.00% 12.00% 14.00%
December Return
Source: Bloomberg, ATB FMG
FMG Monthly Update | Feb 2021 ATB Capital Markets | 7Canadian Dollar – A Pause Before Resuming Strength?
Fig. 1: USDCAD Broke Key Resistance ~1.3000 Fig. 2: Shanghai Deliverable Copper Inventories (Tonnes)
1.50 450,000
400,000
1.40 1.3000 Break
1.30
Should See CAD 350,000
Gains Accelerate. 300,000
Tonnes
1.20 2018 lows 250,000
1.10
Chart ~1.2550 and 200,000
1.2250 medium 150,000
1.00 term targets 100,000 Chart
50,000
0.90
2011 2012 2013 2014 2015 2016 2017 2018 2019 2020 2021 -
2003
2003
2004
2005
2006
2007
2008
2008
2009
2010
2011
2012
2013
2013
2014
2015
2016
2017
2018
2018
2019
2020
Sources: Bloomberg, ATB FMG
Fig. 3: S&P 500 vs USDCAD Regression Sources: Bloomberg, ATB FMG
5% • The Loonie has benefited from strong commodity and equity prices: global
4% growth leads to CAD strength
y = -2.5417x + 0.0031 • Copper prices in particular are a great indicator of economic activity and
USDCAD % Change
3%
2% R² = 0.5706 demand has been strong – inventories in Shanghai are near ten year lows
1% (Fig. 2)
• The equity market has maintained a close relationship with CAD as well: a
0%
Chart 5% weekly change in the S&P 500 implies a 1% change in USDCAD (Fig. 3)
-1%
-2% • The market seems comfortable looking through weaker growth in Q1 2021
-3% to greener pastures later this year
-20% -15% -10% -5% 0% 5% 10% 15% • But vaccines are a risk: Canada’s domestic story could underperform that
S&P 500 % Change of the US if Canadian vaccine rollouts do not improve substantially
Sources: Bloomberg, ATB FMG
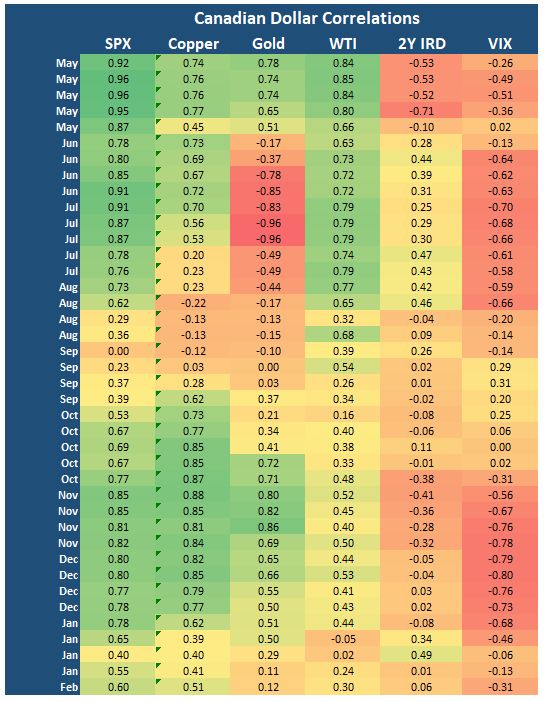
FMG Monthly Update | Feb 2021 ATB Capital Markets | 8Canadian Dollar Heat Map – What’s Driving CAD
S&P 500 and Equities Still in Drivers Seat, But Not as Clear Cut as the Past
10 Week Rolling Correlations
• CAD still maintains a strong positive correlation to
equities and copper at 0.60 and 0.51 respectively
• But you can see this is below recent highs for these
relationships ~0.85 in November
• As our Trends Map on page 7 indicated, the market
overall seems to be in a consolidation phase with
traders taking stock of how best to allocate going
forward after a strong surge across risk assets over the
past few months
• This does not imply a breakdown of the underlying
trend, just a pause
CAD Correlations largely intact, although not as
Highlight
strong as atext
fewinmonths
a callout
agobox would be ideally
set up like this (Open Sans Bold 12pt)
FMG Monthly Update | Feb 2021 ATB Capital Markets | 9Canadian Dollar Forecast
We Still See CAD Gaining on Strong Global Growth Trends
Outlook Supportive
ATB FMG USDCAD FORECAST 2021-2022
1.4500
1.4000 Positive:
1.3500 • Record QE and low rates to fuel growth + improved vaccine ramp could
accelerate re-opening trades
1.3000
• Commodities could be on verge of a super-cycle
1.2500
• Early stage build out of EV fleet and greener grid supportive of raw
1.2000 materials and energy prices in near/medium term
1.1500
• Technically, USDCAD not near oversold territory on longer term scales
Q120 Q220 Q320 Q420 Q121 Q221 Q321 Q421 2022 • Does the Canadian economy really need a 30% discount against the USD
to compete?
Historical Mean High Low ATB FMG
Negative:
Date Mean High Low ATB FMG • It’s still a pandemic, we are tethered to vaccine efficacy + logistics
Q1 2021 1.2800 1.3400 1.2500 1.2800 • Have equities and commodities (key drivers of CAD strength) priced in
Q2 2021 1.2800 1.3600 1.2400 1.2700 too much good news?
Highlight Correlations
text in a callout box intact,
would although
be ideallynot as
Q3 2021 1.2700 1.3600 1.2300 1.2500
• US yieldCAD curve steeping could largely
lead to upward pressure on front end yields
Q4 2021 1.2700 1.3600 1.2200 1.2500 set up like this
strong a(Open
asbe few Sans Bold
months ago 12pt)
which would likely supportive of USD strength
2022 1.2700 1.3900 1.2000 1.2300
• Moral suasion from the BoC: Will they draw a line in the sand regarding
CAD strength?
FMG Monthly Update | Feb 2021 ATB Capital Markets | 10DXY and Interest Rates – USD Pressured; When Will Fed Move?
Fig. 1: DXY Consolidating, Downtrend Still Intact Fig. 2: US Twin Deficits Imply a Weaker USD
105.00 0 0
100.00 -10
Testing Major
Budget Deficit % of GDP
Trade Deficit Billions
-20 -5
95.00 Support:
Structurally weaker
-30
90.00
USD narrative -40 -10
85.00
Chart intact. Market -50
consolidating at -60 -15
Chart
80.00
75.00 major support -70
~89-91 -80 -20
70.00 2016 2017 2018 2019 2020
2010 2011 2012 2013 2014 2015 2016 2017 2018 2019 2020
Sources: Bloomberg, ATB FMG Trade Deficit (USD Billions) Budget Deficit % of GDP
Fig. 3: Inflation Expectations May Force Fed’s Hand? Sources: Bloomberg, ATB FMG
3.00 US 10y Breakevens are • The trade weighted US dollar index (DXY) has been in a consolidation
already back above 2% - pattern in the very near term but the overall trend remains lower
• Over the long term the USD faces major headwinds from twin US deficits:
2.50
2.00 Record trade and budget imbalances will put sustained pressure on the
greenback
Inflation %
1.50
• Treasury Secretary Janet Yellen has essentially brushed aside a return to
Chart the longstanding official “Strong USD Policy” , and during her time as Fed
1.00 GFC
Covid chair she highlighted a strong greenback as hurting the US economic
0.50
recovery from the GFC
0.00 • That type of thinking may mean lower for longer…but long-run inflation
2001 2003 2005 2007 2009 2011 2013 2015 2017 2019 2021 expectations are already above 2% – the Fed may have to follow the
Sources: Bloomberg, ATB FMG market sooner than anticipated and start tapering
FMG Monthly Update | Feb 2021 ATB Capital Markets | 11WTI Crude Oil – Bullish Fundamental Backdrop
Fig. 1: US Stockpiles Fell 64mm bbls Since June Peak Fig. 2: Supply Restraint From OPEC and US Shale
560,000 540,722 13,500 36,000
Inventories peaked
OPEC Production 000's bpd
540,000 34,000
US Production 000's bpd
at 540mm bbls in 12,500
520,000 32,000
June & have drawn
000’s bbls
500,000 11,500
30,000
480,000
an avg of 2.06mm
10,500 28,000
460,000
bbls/week since
26,000
440,000 then…but still sit 9,500
24,000
5% above the 5yr
420,000
Feb Mar Apr May Jun Jul Aug Sep Oct Nov Dec Jan Feb avg for this time of
8,500
Chart 22,000
7,500 20,000
year
US Commercial Inventories 2014 2015 2016 2017 2018 2019 2020
US Oil Production OPEC Oil Production
Sources: Bloomberg, ATB FMG
Fig. 3: WTI 1st-12th Month Timespreads Remain Strong Sources: Bloomberg, ATB FMG
4.00 • WTI prices have been supported by record OPEC+ supply cuts along with a
3.00 renewed commitment to supply restraint from US shale as well
2.00 • The mantra from investors and management alike has been “shareholder
+US$7.44/bbl (+179%)
1.00 returns ahead of production growth”, and that theme finally seems to be
sticking
US$ / bbl
0.00
-1.00 • US commercial oil inventories have drawn -8mm bbls already this year and
-2.00 US production is 10.9mm bpd – well below the 13.1mm bpd peak 1year
-3.00 ago
-4.00 • The setup is favourable as a result with the curve pointing to a tight
-5.00 market throughout 2021 and prices looking poised to rally once again
Aug Sep Oct Nov Dec Jan Feb towards US$60 ahead of the next OPEC meeting in March
Sources: Bloomberg, ATB FMG
FMG Monthly Update | Feb 2021 ATB Capital Markets | 12Canadian Crude – Outlook Positive Despite Keystone Disappointment
Fig. 1: Canadian Differentials to WTI Relatively Strong Fig. 2: US Imports of Canadian Crude Improving
$10.00 4,100
$5.00 3,900
$0.00 3,700
-$5.00
US$/bbl
WCS 3,500
-$10.00
3,300
-$15.00 MSW
3,100
-$20.00 C5 CFT 2,900
-$25.00
2,700
Chart
-$30.00
2,500
Feb-19 May-19 Aug-19 Nov-19 Feb-20 May-20 Aug-20 Nov-20
Sources: Bloomberg, ATB FMG 000's bbl per day 4-Wk Average
Fig. 3: Low Crude by Rail Volume = Tighter Differentials Sources: Bloomberg, ATB FMG
450,000 • Canadian crude prices continue to fair quite well, buoyed by rebounding
400,000 demand from the US and a lower call on crude by rail which is helping to
350,000 support differentials to WTI
300,000
• The debottlenecking out of the WCSB is set to continue with most major
bbl per day
250,000
200,000
producers rather optimistic on differentials over the next 2-3 years
150,000 • Enbridge’s Line 3 replacement and the TMX expansion could add up to
100,000 960k bpd of egress due to new pipe and optimizations on existing
50,000 infrastructure
• While Keystone XL is a disappointment, the continued demand from US
0
Aug-16
Aug-17
Aug-18
Aug-19
Aug-20
Feb-16
Feb-17
Feb-18
Feb-19
Feb-20
May-16
Nov-16
May-17
Nov-17
May-18
Nov-18
May-19
Nov-19
May-20
Nov-20
refiners and lack of greenfield heavy oil projects, along with a structurally
short Canadian refined products market, will help to support producers
Sources: Bloomberg, ATB FMG over the coming cycle
FMG Monthly Update | Feb 2021 ATB Capital Markets | 13Natural Gas – February Cold Snap Could Have Summer Implications
Fig. 1: US Natural Gas Inventories Near 5yr Avg Fig. 2: Low Rigs Could Mean Tighter Supply in 2022
4,500 210
4,000 190
3,500 170
3,000 150
2,500 130
2,000
110
1,500
90
1,000
70
500
50
0
Jan Feb Mar Apr May Jun Jul Aug Sep Oct Nov Dec
5yr Range 5yr Avg 2021 2020
Sources: Bloomberg, ATB FMG US Gas Rigs
Fig. 3: Backwardated Above $3 Should Incentivize Drilling Sources: Bloomberg, ATB FMG
$3.60 • Nymex gas prices have been on a wild ride lately with front month prices
rising 53cents since Jan. 22 to hit US$2.95/mmBtu as we went to press
$3.50
$3.40
$3.30
$3.20 • Weather has been above seasonal for much of the winter, but the coming
cold blast across North American could bring inventories below the 5-yr
$3.10
$3.00
$2.90
$2.80 average just as we start to think about a challenging spring/summer
$2.70 injection season amid lower than normal drilling activity
$2.60
$2.50
$2.40
• While stockpiles may be elevated at present, there is an argument to be
$2.30 made that 2022 balances are on track to be rather tight, and this could
$2.20
lead to a sustained rally in the medium term in order to incentivize further
Apr-21
Oct-21
Apr-22
Oct-22
Apr-23
Oct-23
Apr-24
Oct-24
Apr-25
Oct-25
Jan-21
Jul-21
Jan-22
Jul-22
Jan-23
Jul-23
Jan-24
Jul-24
Jan-25
Jul-25
drilling
Today 3-Months Ago
• LNG is also a bullish caveat with US exports still tracking right at capacity
Sources: Bloomberg, ATB FMG for ~11Bcf per day on a strong Asia and Europe arb
FMG Monthly Update | Feb 2021 ATB Capital Markets | 14USDCAD Regressions – Key Weekly Regressions For CAD 2018-2021
USDCAD vs Copper USDCAD vs WTI
5.00% 5.00%
4.00% 4.00%
y = -0.1797x + 0.0004
y = -0.1387x + 0.0003
3.00% R² = 0.2536 3.00% R² = 0.3652
USDCAD % Change
USDCAD % Change
2.00% 2.00%
Charts are placed here.
The box outline is not required
1.00% 1.00%
0.00% 0.00%
-1.00% -1.00%
-2.00% -2.00%
-3.00% -3.00%
-15.00% -10.00% -5.00% 0.00% 5.00% 10.00% -20.00% -15.00% -10.00% -5.00% 0.00% 5.00% 10.00% 15.00%
Copper % Change WTI % Change
USDCAD vs DXY
5.00%
4.00%
3.00%
y = 0.6934x + 0.005
R² = 0.4631
USDCAD % Change
2.00%
1.00%
0.00%
-1.00%
-2.00%
-3.00%
-4.00%
-5.00% -4.00% -3.00% -2.00% -1.00% 0.00% 1.00% 2.00% 3.00% 4.00% 5.00%
Sources: Bloomberg, ATB FMG FMG Monthly Update | Feb 2021 ATB Capital Markets | 15
DXY % ChangeATB Financial Markets Contacts
FMG Desk Contacts
Rob Laird
Managing Director
ATB Financial Markets Group
403-974-3582
rlaird@atb.com
Foreign Exchange Commodities Interest Rates Trading
Janek Guminski, CFA Chris Fricke, MBA Shane Hawryluk Dan Noble Mark Johnson, MBA Bennett Cheung, CFA
Sr. Director FX Sales Director FX Sales Director Commodity Sales Director Commodity Sales Director Interest Rates Sales Director FX Trading
403-974-3580 403-974-3580 403-974-3582 403-974-33582 403-974-3582 403-974-3583
jguminski@atb.com cfricke@atb.com shawryluk@atb.com dnoble2@atb.com mjohnson4@atb.com bcheung@atb.com
Cynthia Chan Mike Gee, MBA Mark Engelking, CFA
Associate Director FX Sales Director ATBFX Director FX Trading
780-392-7070 403-869-8526 403-974-3583
cchan@atb.com mgee2@atb.com mengelking@atb.com
Bill Dahmer
Director FX Initiatives
780-408-7237
wdahmer@atb.com
Analyst Business Management
JP Dore Kim Campbell
Analyst, FMG Sr. Business Manager
403-888-5342 403-554-3963
jdore@atb.com kcampbell2@atb.com
FMG Monthly Update | Feb 2021 ATB Capital Markets | 16You can also read