Spotlight on International farmland markets 2009
←
→
Page content transcription
If your browser does not render page correctly, please read the page content below
Savills Research | International Farmland Markets                                                                      Summer 2009

 Spotlight on…
International farmland
markets 2009

Across the globe the value of farmland is traditionally
driven by its productive capacity but increasingly there   it is important to put these competing demands for
                                                           farmland into context, which is one of low turnover and,
Around areas of high population density, for example,      in most cases, it is relatively small (25-acre) plots that
there is a growing demand for amenity use. Investors are   change hands.
now regular buyers of farmland where they seek a low-

 Savills
 Research
 savills.co.uk/research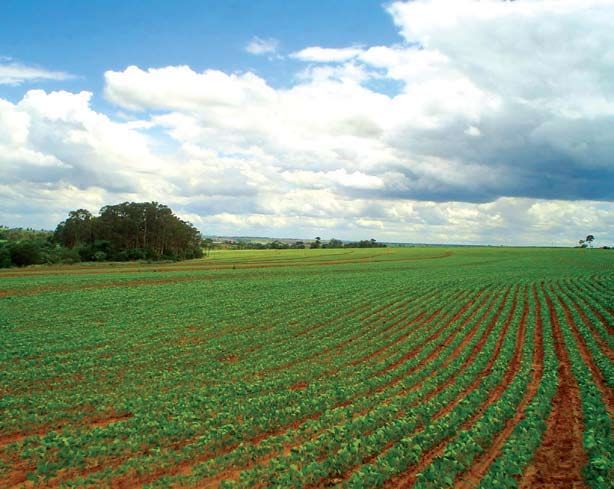
Savills Research | International Farmland Markets Summer 2009
Generally the buyers of farmland can be split into the Non-farmers whose primary motives are lifestyle.
These buyers are generally interested in properties where
the residential and amenity aspects are as good if not
Farmers – the individuals or companies whose better than the agricultural productivity. Their presence
primary motive is the generation of income from farming. in the market is more marked in some countries and
The recent strength of commodity prices and the regions, these include the UK, Ireland, and regions with
relative stability of the Single Payment Scheme of the good transport links to cities and big towns. It is likely
Common Agricultural Policy (CAP) has restored some however, that as transport and communication networks
become increasingly global and the economy improves,
low interest rates throughout the EU will alleviate some of that previously unexploited regions could become new
the economic pressure brought about by the recession. destinations of choice adding another dimension to the
Graph 1 illustrates the varying strength of the link supply/demand equation.
between farm incomes and values.
Investors – these buyers are motivated by capital buyers who play a part in some markets; in the UK
appreciation and the potential to increase income. Their
focus, therefore, is commercial farmland. Maximising the
performance of this asset is closely linked to a well-timed skills, technology and capital) have also been the driving
force behind investment into the agricultural industry in
in income returns are most likely to be in areas where developing markets.
entry values are low or agricultural production is currently
underperforming. Both these aspects could apply to
parts of Central Eastern European Countries (CEECs) Comparative data on farmland values across the
and South America, where investment can produce globe, especially in the developing markets such as the
(CEECs) is not readily available, but our research uses
are high or production is already maximised. Whilst rising Eurostat, USDA and national data sources along with our
knowledge of local markets.
potential for the highest returns there is often a greater
risk attached. The opportunity to capitalise on increasing
income by injecting funds and skilled management often mask the true extent of movement in average
has attracted interest from investment funds. These farmland values when measured in the domestic
investment funds offer the opportunity for investors to currency. Table 1 illustrates three examples showing
diversify their portfolios into agriculture and interest is the range of variation possible and therefore the care
high and at levels not seen since the activity of pensions needed in discussing the trends in values.
funds in the UK in the late 1980s.
Farm ownership is more attractive than commodity
futures/indices or publicly traded shares in agribusiness
companies. Although there is still an active interest in
Table 1
investors have more pressing commitments for their Change in average farmland values 2004 to 2008
capital in the current economic climate.
Domestic Euros
England (Pound £) 104% 31%
Denmark (Krone DKK) 65% 65%
Sweden (Krona SEK) 82% 55%
Graph 1 Graph 2
Average EU land values v. agricultural GVA* Exchange rate discounts for UK farmland
* GVA at producer prices = output - intermediate consumption % change from 1st Dec 2006 to 1st May 2009
(materials & service costs) which broadly equates to gross margin % diff between high & low within period
45,000 0%
Ireland -5%
40,000
Denmark -10%
35,000
Netherlands -15%
2007 Land Value (€/ha)
30,000
-20%
25,000
Belgium
-25%
20,000 -30%
Italy
15,000 -35%
UK
Spain -40%
10,000
Germany
Finland Poland France Greece -45%
Latvia 5,000 Sweden
Lithuania Hungary -50%
Romania
0 Swiss Danish Euro Swedish US Dollar Australian Canadian Japanese Norwegian NZ Dollar
Franc Krone Krona Dollar Dollar Yen Krone
0 500 1,000 1,500 2,000 2,500 3,000 3,500 4,000 4,500 5,000
Bulgaria Source: Bank of England & Savills Research
Slovakia 2007 Agricultural GVA (€/ha)
Source:
Source: Eurostat
Eurostat 2005&&Savills
2007 SavillsResearch
Research
Page 2
Savills Research | International Farmland Markets                                                                                           Summer 2009

Map 1
Average farmland values across Europe

         € per hectare
             over 30,000
             20,001 – 30,000
             15,001 – 20,000
             10,001 – 15,000
             6,001 – 10,000
             4,001 – 6,000
             3,001 – 4,000
                                                                                              Sweden
             under 3,000                                                                       55.0%

         Figures on map show                                                                                   Finland
                                                                                                               20.3%
         % change since 2004

                                         N. Ireland                                                                     Latvia
                                          52.0% Scotland                                                               283.1%
                                                                      Denmark
                                                    33.4%                                                          Lithuania
                                                                       65.3%
                                                                                                                    515.8%
                                                                     Netherlands
                               Ireland                                 16.0%
                               152.4%
                                                              Belgium
                                              Wales            28.8%
                                              21.0% England                                               Poland
                                                     31.4%                                                237.7%
                                                                                   Germany
                                                                                    0.0%
                                                                                             Czech Rep.
                                                                                               114.0%       Slovakia
                                                                                                            323.3%

                                                            France                                         Hungary
                                                                                                            48.9%              Romania
                                                            19.5%                                                              330.0%
                                                                                     Italy
                                                                                    2.6%
                                                                                                                                  Bulgaria
                                                                                                                                  272.3%

                                          Spain
                                          42.5%
                                                                                                                         Greece
                                                                                                                          3.1%

Source: Savills Research

Europe including CEEC and UK                                                       sterling) during the second half of 2008. Our latest
Our analysis of European land values shows that values                             research shows that this downward pressure continued
have, in general, continued to increase across Europe
over the past few years, mirroring the trend we have                               year. As with all markets, average values tend to mask
witnessed in the UK. However, not all European countries
                                                                                   market is no exception.

Map 1 of Europe clearly shows that the increases in                                Over the past few years values have been driven by very
                                                                                   strong demand from farmers, investors and non-farmers,
across the rest of Europe when measured in Euros.                                  for whom lifestyle has been the primary motive behind a
                                                                                   purchase. The presence of the latter has declined during
                                                                                   the current economic downturn, but weak sterling has
Great Britain                                                                      increased the opportunities for overseas buyers who,
In Great Britain, Savills Farmland Value Survey showed                             until 2003, represented up to 6% of UK farm buyers.
that to the end of 2008 the average value for all types
of farmland increased by 21% to £4,200 per acre
(€11,400 per hectare). The average value of grade                                  increase in overseas buyers, who now represent between
3 arable land increased 16% during 2008 to £4,400                                  10% and 20% of all buyers of farms over 50 acres
per acre (€12,000 per hectare). These patterns were                                in the UK. Buyers from Ireland (mainly from Northern
mirrored in England, Scotland and Wales and across                                 Ireland) who were able to sell at home and buy four to
average pasture land values.
                                                                                   5% of buyers in some years. The Danes have been very
However, the bull-run of recent years appears to have                              active in the past three years, buying around 10% of all
come to an end with average values falling 6.5% (in                                farms marketed in the UK. In 2008 the Danes and Irish

Page 3
Savills Research | International Farmland Markets Summer 2009
represented 9.4% and 4.2% of all buyers respectively, and the values in the South of France are somewhere in
comparable with their activity in 2007. between, at more than €4,000 per hectare.
Graph 2 indicates the potential discounts for UK Germany
Average values in Germany have been relatively stable
buyers. The graph does not include any fall in UK
farmland value over the periods illustrated. currently average around €10,000 per hectare in a market
with a turnover of approximately only 0.6% – a similar
proportion of the market to the UK. Average values in
Ireland West Germany are around €15,000 per hectare, whereas
Across the Irish Sea, the increase in farmland values in in East Germany they average around €5,000 per hectare.
Eire has been phenomenal during the past few years Although there is pressure on farmers in East Germany
with values reaching over €65,000 per hectare in 2006. to buy their land (either from ongoing privatisation or by
This rise in values was driven by the strong demand from owners or heirs who are not active farmers and are selling
City purchasers wishing to buy a country residence and their land) market activity has remained unchanged.
taking advantage of the improved transport infrastructure.
The Netherlands and Denmark
The Netherlands and Denmark have some of the highest
Since then the market has changed and values have values in Europe, just below Ireland. Here the markets
fallen back. Initially, this was very slowly but recently the are restricted and demand for land is high in order that
decline has been more dramatic. By the end of 2008, the stocking rate demands in place via pollution and
as the full effect of the credit crunch took hold, values
averaged around €40,000 (still an increase of 150% since increases in value have taken a knock and market
2004) with farmer buyers now underpinning the limited information suggests that values in Denmark have fallen
acres available to buy. This market remains tiny with back around 20% from their peak of around €34,000
only just over 14,000 hectares sold in 2008 – just 0.3% per hectare.
of the total agricultural area. The average area sold per
transaction was 45 hectares.
Central Eastern European
The market is equally constrained in Northern Ireland
where average values are around €36,000 per hectare,
Countries (CEECs)
up by just over 50% since 2004. It is now more than two years since Romania and Bulgaria
States, Hungary, Poland, Slovakia, the Czech Republic,
Mainland Europe and Slovenia, the large block of eight Central Eastern
Across the English channel into mainland Europe European Countries (CEEC) acceded to the EU on the
values have been more stable with demand from the 1st May 2004. Average land values in the CEECs are well
lifestyle/amenity buyer weaker than in the countries below those of most of the rest of Europe; France, Greece
and Finland being the exceptions. Values range from just
over €2,000 per hectare in Romania to just over €5,000
France per hectare in Poland and the Czech Republic.
In France, average values are relatively low and stable
at just under €5,000 per hectare. The low population However, as has happened in previous accessions to the
density and sheer volume of land are factors here.
France can be split into three main zones with the lowest with rises of several hundred per cent recorded as
values, at below €3,000 per hectare, found in the central illustrated in Map 1 and Graph 3. In recent months, as
strip (from east to west). The highest value land, at more elsewhere, values have stabilised (Romania) or eased
than €5,000 per hectare, is in the North of the country slightly, with corrections of up to 10% to 20% recorded
in Bulgaria and 5% in Poland.
Graph 3
Change in farmland values from year of accession
EU membership and there has been consistent growth in
Latvia Lithuania Poland Slovakia GDP across the whole region during the past few years
Hungary Czech Bulgaria Romania to 2008. According to the forecasts for GDP growth,
600%
these countries, with some exceptions, are likely to
500% weather the economic storm slightly better than the UK
400%
and the Eurozone.
300%
200% increase in agricultural subsidies. Also, in a number
100%
of countries there are large areas of good commercial
farmland, which in places, is underperforming through
0%
lack of capital investment and infrastructure. Therefore
-100%
-200% the injection of capital.
-4 yr -3 yr -2 yr -1 yr Acc. +1 yr +2 yr +3 yr +4 yr +5 yr
Source: Savills Research using Eurostat, national data and various market sources
Page 4Savills Research | International Farmland Markets Summer 2009
USA USDA reports that the increase in values continues
The latest data from the United States Department of to be driven by strong commodity prices and farm
Agriculture (USDA) shows that the average value of programmes, outside investments, favourable interest
farms (all land and buildings on farms) across the USA rates and tax incentives, and continued commercial and
increased 9% in the year to 1st January 2008 to a record residential development. The increase in pasture land
growth was also recorded in the same period for the recreational use and urban development.
average value of cropland (10%) and pasture land (6%).
Regional increases in average farmland values ranged and agriculture are likely to remain fairly resilient to the
from 1.6% in the North East region to 1.5% in the current recessionary pressure as in previous recessions
Northern Plains region. The highest values remain in the illustrated in Graph 5, which tracks values back to 1970.
North East region where development pressure pushed
values up to over $5,000 per acre.
Index (CPI), has been relatively stable since 2000
Cropland values were also up in all regions with the averaging just under 3%. Also, the growth in the value of
largest increase of 18.8% in the Northern Plains region crop and livestock output has been relatively strong over
to $1,390 per acre. The Corn Belt region recorded a 15% the same period. A fall in values during the early 1980s
increase to $4,260 per acre with the Southern plains
recording a similar increase to $1,490 per acre.
The highest growth (19.7%) in pasture values was
recorded in the Northern Plains region to $565 per acre.
In the Southern Plains and Mountain regions, which
account for more than half of the pasture in the USA,
values increased 17.1% and 6.4% respectively.
Graph 4 Graph 5
Average USA farmland values (by type) USA farmland values and farm output
Farm (all land & buildings) Cropland Pasture Land & buildings (RHS) Value of crop production (LHS)
Value of livestock production (LHS)
3,000 2,500 180
160
2,500
2,000 140
2,000
120
$ per acre
1,500
$ per acre
$ per acre
100
1,500
80
1,000
1,000
60
500 500 40
20
0
1998 1999 2000 2001 2002 2003 2004 2005 2006 2007 2008 0 0
1970 1975 1980 1985 1990 1995 2000 2005
Source: USDA (data corresponds to 12 months before 1st Jan each year)
Source: USDA
Page 5Savills Research | International Farmland Markets Summer 2009
Canada South America
Farmland values continue to rise in Canada, although Farmland values in South American countries have
growth continues to be slower than in neighbouring followed the same upward trend as recorded elsewhere.
USA. The average value of farmland in Canada increased These countries are of great interest to the fund
managers, who are looking for agricultural investments
with the potential for strong performance in income
Graph 6 shows that in all provinces average farmland returns, as well as capital appreciation.
values have increased during the past 25 years.
South America has vast areas of land including some not
Although farmland values are low and stable in in full agricultural production and where water is not a
Saskatchewan relative to other parts of the country they limiting factor. In addition, the infrastructure with access
to ports and processors is good and local land values
follows two previous half yearly increases. Demand for
land in this region is driven by local expansion and out of management skills are available the potential to increase
the region by buyers and investors.
there are some risks from politics and the general
Average farmland values, at over $4,500 per acre, are economic situation, these risks are counterbalanced by
the potential returns that can be achieved.
by strong commodity prices and, despite rising costs,
Farm Credit Canada report that the optimism of cash The main countries of interest in South America are
Brazil, Argentina, Uruguay and Paraguay.
it had been for several years.
Brazil is the largest country with a population of around
189 million and enjoys a healthy democratic system with
recorded in Alberta, where average values reached a sound economy. Brazilian agriculture represents around
$1,300 per acre. The strong grain and oilseeds markets 28% of GDP and around 44% of the country’s exports.
contributed to this rise. Speculative buying around urban
centres and for commercial development along the main In Brazil, as illustrated in Graph 7, values have increased
highway corridor also added support to the market.
regions than in others. Average values across Brazil have
The falling world commodity prices and global recession increased around 350% since the beginning of 2000.
will no doubt impact on values. Although agriculture and
farmland values, as noted above, have proved resilient in However, average values stabilised at around R$1,850
the past. per acre in 2005 following annual increases of between
30% and 40% in the preceding few years. Growth
resumed in 2006 at 12% and then increased by 27% in
The picture is the same across Argentina where
during the past few years. The highest growth rates were
recorded in the second-quality land where the potential
to increase performance is highest.
“The optimism of cash crop operators in Often the second-quality land can be upgraded with
investment in irrigation to enable double cropping
had been for several years.” and capital value.
Graph 6 Graph 7
Average Canadian farmland values Average Brazilian farmland values
Newfoundland Prince Edward Island Nova Scotia
New Brunswick Quebec Ontario
Manitoba Saskatchewan Alberta Brazilian avge Mato Grosso Mato Grosso do Sol Sao Paulo
British Columbia Canada avge
5,000 5,000
4,500 4,500
4,000 4,000
3,500 3,500
R$ per acre
3,000
3,000
$ per acre
2,500
2,500
2,000
2,000
1,500
1,500
1,000
1,000 500
500 0
Jun- Jun- Jun- Jun- Jun- Jun- Jun- Jun- Jun- Jun- Jun- Jun- Jun-
0
96 97 98 99 00 01 02 03 04 05 06 07 08
1981 1983 1985 1987 1989 1991 1993 1995 1997 1999 2001 2003 2005 2007
Source: FGV
Source: Statistics Canada & Farm Credit Canada
Page 6Savills Research | International Farmland Markets Summer 2009
“In Brazil, values have
although the rise has
been greater in some
regions than in others.”
Our research shows that the average value of second-
quality cropping land across Argentina increased by anecdotal evidence suggests that values have reached
more than 230% between 2003 and 2007 with some a plateau (eased back in external currencies) in recent
regions, notably La Pampa, Córdoba, and El Chaco, months in line with other parts of the world, whilst other
recording increases well in excess of 300%. reports suggest otherwise with values in some parts
perceived to be too high for investors.
Last year we commented on the sentiment of investors
shifting away from the long-established Argentinian land
market into the less-governed Uruguayan economy.
Anecdotal evidence suggest that investors still see
Uruguay as a solid destination to invest capital but
possibly perceive 2008 values as being high.
Paraguay is the fourth country in the region where
the value of farmland is growing. The recently elected Graph 8
government is positively promoting biofuels as a way Average 2nd quality cropping land values in Argentina
to develop the rural economy and have reduced VAT to
2% in order to stimulate external investment. We believe La Pampa
Mendoza
Buenos Aires
Patagonia
Cordoba
Santa Fe
these incentives will only have a positive effect on the El Chaco Entre Rios Corrientes
Jujay, Salta, Tucuman Santiago de Estero
farmland market in the region. 2,500
However, in Paraguay and to a lesser extent Uruguay, 2,000
there appears to be a growing sentiment against foreign
ownership of farmland, which is linked into the spike in
US$ per acre
1,500
global food prices last year.
1,000
The capital growth in farmland recorded in South
America in the past few years, mirrors the exceptional 500
rise in values recorded in the CEECs where the potential
0
the recession and the general world economic situation Jun-03 Dec-03 Jun-04 Dec-04 Jun-05 Dec-05 Jun-06 Dec-06 Jun-07 Dec-07
Source: Argentina's magazines
Page 7Savills Research | International Farmland Markets Summer 2009
Australia New Zealand
Farmland values in Australia are fundamentally driven The latest data shows that until June 2008 average
by agricultural activities, and values here have, once farmland values in New Zealand continued their upward
again, followed a similar pattern to other mature farmland trend. Since 2000 growth in dairy and arable land has
markets such as the UK. Collated data is not easy to been very strong as illustrated by Graph 10.
obtain but Graph 9 illustrates the trend.
In New South Wales the average value of wheat- values increased by 25% to $14,085 per acre, giving
producing properties increased 100% to just over $500 total growth since 2000 of 224%. Average arable
values followed the same pattern, recording increases
grazing land increased by up to 125% to around $1,100 of 39% and 290% respectively to reach a value of
per acre over the same period. Capital growth in 2008 $12,881 per acre.
was generally higher than in 2007.
The average value of livestock fattening and grazing land
The latest data for Victoria reveals that, in 2007, the
average value of cereal farms was $713 per acre, up the levels recorded for dairy and arable land. Fattening
15% on 2006. Beef farms averaged $2,000 per acre land increased by 8% to just under $5,000 per acre and
(+17%) and dairy farms $3,000 per acre (-15%). grazing land by 17% to $2,140 per acre.
Recent reports suggest that rural property values Farm incomes are the key driver of values in New
across Australia have held up well, despite the global Zealand but the National Bank in New Zealand reported
economic crisis around the world, as the agricultural in September 2008 that the increase in land value had far
fundamentals have remained sound. Australian outstripped growth in farm incomes.
agriculture is seen by many large local and international
investors as a ‘safe’ place to invest and there is reported Recent reports from our associates at PPG Wrightson
activity of companies buying to either diversify or show that growth in values in the second half of 2008
consolidate their portfolios. and into 2009 was much more constrained. In some
These companies appear to be driven by issues which The market is beginning to see signs of recovery,
include: although activity is not expected to increase until their
Food security in the South East Asian countries spring, which begins in September.
Economics of low-cost grass-fed beef
Possible effects of carbon emissions schemes
especially on the cost of grass-fed beef Others countries
The demand for cheaper cuts of meat due to There has been muted interest from investors and farm
economic constraints. purchasers in the land markets of countries other than
those discussed in this report. These include Russia,
South Africa and India. Information and especially good
anecdotal evidence that these countries may be of
interest in the future to those funds or individuals, who
are looking for new markets. It would be expected that
the fundamentals of population, wealth and biofuels
growth will also impact on these markets, although the
political and economic risk is likely to be high.
Graph 9 Graph 10
Average New South Wales farmland values Average New Zealand farmland values
Western Grazing Wheat Properties Dairy Fattening Grazing Arable Total Rural
Tablelands Grazing Coastal Grazing 16,000
1,400
14,000
1,200
12,000
1,000 10,000
NZ$ per acre
$ per acre
800 8,000
600 6,000
4,000
400
2,000
200
0
2008 H1
1980
1981
1982
1983
1984
1985
1986
1987
1988
1989
1990
1991
1992
1993
1994
1995
1996
1997
1998
1999
2000
2001
2002
2003
2004
2005
2006
2007
0
2002 2003 2004 2005 2006 2007 2008
Source: NSW Lands Department Source: Quotable Value Ltd
Page 8Savills Research | International Farmland Markets Summer 2009
Outlook “With an industry well placed to weather
Our research shows agricultural incomes have not been
unduly hampered by past recessions. In this recession,
the current recession we believe that
although there is more commodity price volatility, farmland values across the world will
there are undoubtedly opportunities that may not have
existed in the past. A fundamental difference being low
generally remain robust during the current
interest rates. In addition, some areas, including the economic cycle.”
most recent entrants to the EU, are enjoying a new era
where farmland adds the low-risk, long-term stability that
short term and ensure they continue to rise in the has been lacking in the past.
medium term.
Population growth and increased wealth will, over the
With an industry well placed to weather the current long term, increase the demand for food and, as reliance
recession, we believe that farmland values across the moves away from fossil fuels, the demand for biofuels will
world will generally remain robust during the current
economic cycle. The lifestyle buyer may be harder to that values are supported and, for the medium term, we
forecast values will continue growing albeit at a much
from farmers (not only domestic) and investors (who slower rate than recorded during the past few years.
regard farmland as a safe haven for their money in the
short term and an appreciating asset in the medium The effect of climate change may shift or concentrate
to long term) is likely to support values. The interest in production in the areas of the world best suited for food
farmland by investment funds will continue as investors production where rainfall and humidity will be key. This in
seek to build and maintain portfolios of property assets the long term may also affect the farmland market.
Research
contact: For more information please contact one of our team:
Ian Bailey Crispin Holborow Ken Jones Henry Wilkes Pat O’Hagan
Head of Rural Research Director Director Director Director
+44 (0) 1797 230156 +44 (0) 20 7409 8881 +44 (0) 20 7016 3712 +44 (0) 20 7016 3752 + 353 (0) 1663 4358
ibailey@savills.com cholborow@savills.com kjones@savills.com hwilkes@savills.com pat.OHagan@savills.ie
Savills plc
Savills is a leading global real estate service provider listed on the London Stock Exchange. The company established in 1855, has a rich heritage with unrivalled
Middle East.
This report is for general informative purposes only. It may not be published, reproduced or quoted in part or in whole, nor may it be used as a basis for any contract,
prospectus, agreement or other document without prior consent. Whilst every effort has been made to ensure its accuracy, Savills accepts no liability whatsoever for
any direct or consequential loss arising from its use. The content is strictly copyright and reproduction of the whole or part of it in any form is prohibited without written
permission from Savills Research.
Page 9You can also read