GB Agricultural Land Spotlight | 2018 - Savills Research UK Rural savills.com/research
←
→
Page content transcription
If your browser does not render page correctly, please read the page content below
Savills Research
                                                               UK Rural
                                                  savills.com/research

               Spotlight | 2018

              GB Agricultural Land

Savills_Agri_01_12_front_back_cover_v1.0.indd 5                       09/02/2018 12:39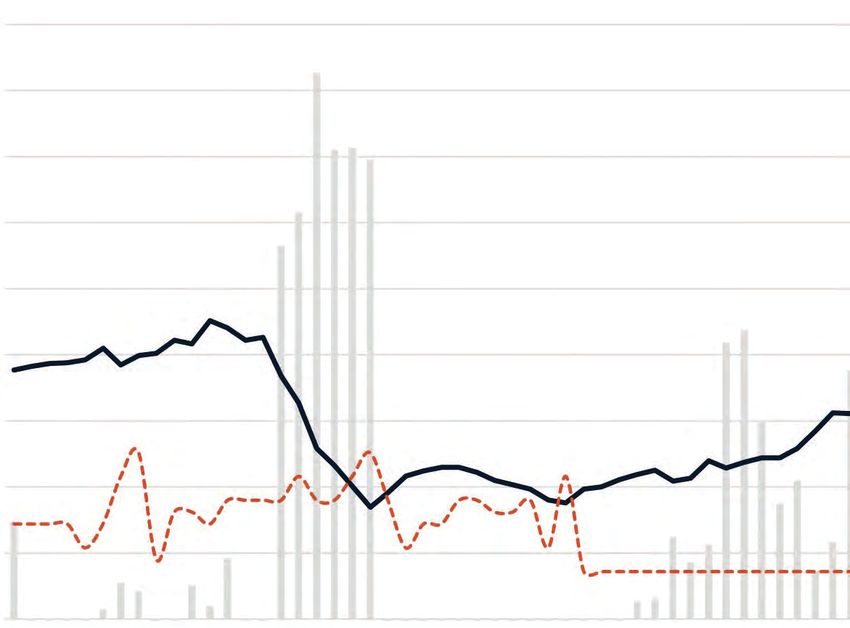
M A R K E T DY N A M I C S
Farmland supply* Markets in England and Scotland proved more resilient than Wales
Foreword Market 200,000
update
Brexit-related developments
continue to dominate market 150,000
Marketed farmland (acres)
discussion. While Secretary of
State Michael Gove provided
some comfort to the farming
community at the Oxford Short-term uncertainty lingers, but markets are likely to 100,000
Farming Conference in January,
strengthen over the next five years. Holdings with a range of
lingering uncertainty is keeping
supply constrained and average
income streams will be sought after, while commercial units with
pricing marginally subdued. little scope to diversify could encounter further downside risk 50,000
Despite the prevalence of
downside risk, we note strong Farmland supply
pockets of resilient demand from Just over 151,000 acres of farmland reaction to the EU Referendum result
lifestyle/amenity purchasers as were publicly marketed in Great in 2016. Both events prompted an 0
residential farms and trophy Britain during 2017, down 16% from initial uptick in activity as some chose 2007 2008 2009 2010 2011 2012 2013 2014 2015 2016 2017
estates have performed well 2016 and 8% below the 10-year to leave the asset class (197,000 acres England Scotland Wales GB 10-year average supply
when priced at fair value. average of 164,000 acres. in 2008 and 181,000 acres in 2016).
While some farmland values The greatest fall in volume was Similarly, the GFC was followed by a Source Savills Research Note *Of more than 50 acres
across Britain continue to be recorded in Wales, down 40% lull in new launches, leading to annual
hampered, we believe the trend year on year. Markets in England supply remaining below the long-run
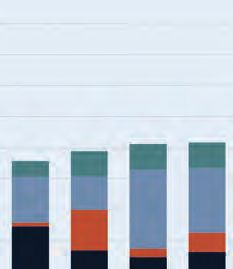
initially spurred by weakness in and Scotland proved more resilient, average until 2015. Buyer types Change in demand, driven by increased interest from lifestyle purchasers
commodity pricing during 2014 down 16% to 102,900 acres and
is slowing. Our most recent 11% to 39,700 acres respectively. Reasons for sale 100
Farmland Value Survey revealed The number of holdings marketed Personal circumstances, such as
90
an average fall of around only fell by 20% year on year to 725, in retirement and death, account for
2% year on year across all land 2017, which is 5% below the 10-year a significant number of sales – around 80
types and geographies. Disparity long-run average. The falling supply 40% during the past three years.
Percentage of purchases
is evident, with some more levels suggest some caution among However, the number of sellers citing 70
commercial areas and lesser sellers following the decision to debt as their principal motivation has 60
quality properties seeing greater leave the EU. increased from about 8% at the time
falls than others. Yet, in certain These trends (see top right) reflect of the GFC to around 20% since 2015. 50
circumstances, excellent sale a similarity between the 2007/08 As interest rates have been at
40
results are and will continue global financial crisis (GFC) and the historic lows over the period, we
to be achieved. 30
We are confident on the
market’s longer-term 20
Seller motivation Increasingly, debt is the principal reason for a sale
fundamentals and expect
10
dynamics to firm up as the
outcome of Brexit further Debt 0
6%
materialises. GB farmland Retirement/death/personal
7% 10%
Relocation and other 2007 2008 2009 2010 2011 2012 2013 2014 2015 2016 2017
remains an attractive investment 2007 2008 2009
proposition, buoyant against Investment elsewhere Farmer Lifestyle Institutional/corporate
inflation with realisable upside
from a return to capital uplift Source Savills Research
and further enhancement
from diversification and/or believe that weaknesses in commodity serving loans set to increase, we Expansion of existing farm
development windfall. pricing is the main factor driving believe debt will continue to be one businesses remained the primary
8% 14%
2010 2011 2012 21% 2013 debt levels up and, in some cases, of the material factors driving supply reason for buyers and accounted
13%
to unsustainable levels. Although and could also temper demand. for just over half of transactions.
pressure on farm earnings has been While Secretary of State Michael
in part alleviated by a comparatively Buyer types Gove provided some comfort to the
weak pound against the euro. The scale and profile of demand farming community at the Oxford
Despite the farming sector’s has remained largely unchanged over Farming Conference in January,
comparatively low gearing, the balance the past three years, with farmers there is a long way to go.
Alex Lawson 2014 2015 2016 2017 between the cost of debt and return on accounting for around 40% of Uncertainty may impact on demand
20% 21%
Director, National 17% 19%
working capital employed is tight. For purchases where Savills acted for for commercial holdings, so realistic
Farms and Estates some, it would be negative if subsidy either the buyer or seller. In 2017, pricing is essential. However, interest
020 7409 8882 and diversification income is excluded. there was increased interest from in land with high amenity value and
alawson@savills.com With future farm income potentially institutions, while the return scope to diversify into alternative
Source Savills Research under pressure, and the cost of of the lifestyle buyer has continued. sources of income should stay strong.
2 savills.com/research savills.com/research 3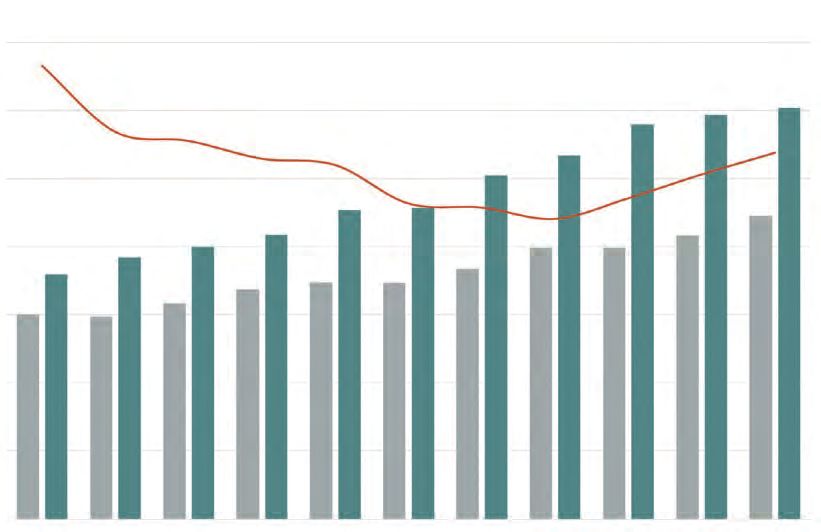
2.4m 0.5 1.0
acres tonne
15%
8%
E U FA R M L A N D E U FA R M L A N D
Farmland values Estonia
UK farmland is
second only to the 77%
Netherlands in terms of
How UK
value. Over the past 10 years,
Eastern Europe recorded the
Food
strongest capital growth,
production
averaging just under
Irish production is
farmland
20% (compound 58% most weighted towards
annual growth).
livestock (70% of output),
yet with comparatively low
efficiency. Denmark exports
sizes up
the largest share of output,
0.9 3.5 despite grazing land being
6.5m Environment
acres tonne less than 10% of total
UK agricultural area. With farmland
equating to 71% of
42.6m 4% landmass, UK farming can
With a large area of farmland and high 11m acres positively influence the
acres 38% Denmark
market developing around
domestic demand, the UK has the 45% natural capital. Also, the
means post-Brexit to boost production 0.4
1.5 32% 37% 35.6m 1.1 2.3
prevalence of UK grassland
and reduce dependency on imports acres
tonne is suited to the initiatives
identified by the UK
Ireland 4.5m Government.
With more than 65 million people, the UK has one of the acres
10%
1.0 50% 35%
largest and most densely concentrated populations in tonne
Europe. Of the 11 countries analysed here, it has the third 1.5 3.7 8.6
largest area of agricultural land, equating to 71% of total 15% tonne 26% tonne Poland
2.0 3.5
land mass. This is the highest of this group of countries,
41.3m tonne 53%
35% 23%
acres
and well above the average of around 55%.
UK agriculture benefits from strong domestic demand Netherlands
and a large volume of farmland. However, the sector has 13%
29% 45%
comparatively lower production. The UK’s aggregate
Germany
output volume per acre of agricultural land ranks as
third quartile (due to a high portion of marginal grazing
ground) in comparison with the other countries, despite
second-quartile ranking for the unit value of output. 40% 34.2m 0.6 1.2
52% acres tonne
The UK also has the lowest per capita of production
and is the most reliant on imports, with 70 to 75% of 20%
the food supply serviced by domestic output. For most
Demand
countries, production exceeds domestic demand needs. Romania
France With the second
Increasing efficiency to make post-Brexit margins 40%
35% highest population
competitive will be key to closing the productivity gap Agricultural density, the efficiency in
with top-quartile countries. The UK’s reliance on land 71.1m 0.9 2.4 which the UK deploys its
tonne 12.3m 0.6 1.2
imports, coupled with below average food consumption The UK has the third acres stock of agricultural assets acres tonne 33%
per capita, presents the sector with an opportunity largest agricultural area, is, and will remain, key to
to better align output with domestic food demand. behind France and Spain. 17% meeting demand, as well as
Of this, 64% is grassland and increasing diversification 13%
36% is cropping ground. Of in land use away from
Key
the 11 countries analysed, agriculture.
Bulgaria
54%
the Netherlands has the
Percentage of land most balanced split
used for cropping of the two.
48%
Percentage of land
used for grazing
Production per capita Denmark is the EU’s agricultural superpower
Animal products Fruit and vegetables Cereals Other cropping
Percentage of land 4.0
(non-agricultural)
Food production per capita (tonne)
Spain 3.5
Agricultural area
3.0
(million acres)
34% 2.5
People per acre of 65.7m 0.7 1.4
acres tonne 2.0
agricultural area
UK food 1.5
Production per 19% production
agricultural acre (tonne) 1.0
Although the UK’s
aggregate production is 0
in line with the peer group
UK
Germany
Estonia
Spain
Bulgaria
Romania
Poland
Ireland
Netherlands
France
Denmark
Source Food and Agriculture Organization of the United Nations, average, it has the lowest
World Bank, United Nations Population Division and Eurostat
level of agricultural output
Note The map is a graphical representation of the percentage
per capita and hence the
split in agricultural and non-agricultural land. It is not a guide to 47%
where each land-type is located highest reliance on
food imports. Source Food and Agriculture Organization of the United Nations
4 savills.com/research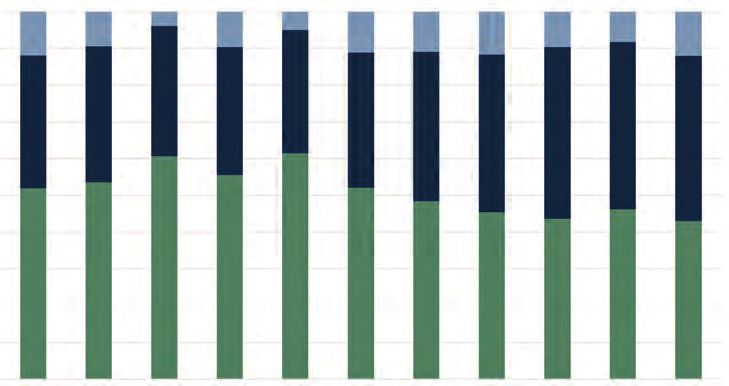
G B FA R M L A N D VA L U E S G B FA R M L A N D VA L U E S
Outlook and
historical context
While pure commercial holdings are at risk from any reduction in farm earnings,
we forecast rising values for those with options to diversify. Is there anything we
can learn from historic trends? We examine the events that shaped farmland values
Farmland values continued to be muted during 2017, in commodity pricing, could put pressure on earnings this has fallen to around 35%. Today, annual supply The UK’s entry into the European single market in the
with a significant price difference across both land for lower-performing commercial arable and livestock equates to around 0.5% of total GB farmland. early 1970s, and, subsequently, the Common Agricultural
type and geography. Grazing land proved most resilient, businesses. This is priced into our forecast, with an Following the Second World War, growth was largely Policy, further spurred demand-led growth, amplified
falling around 1.5% year on year compared with the average average decline of 2 to 3% per annum expected for pure driven by a combination of market intervention by the by strength in commodity prices.
2.5% drop for prime arable land. commercial farmland, but rising values of around 2% British Government and inflationary pressures. The While the correlation between farm profitability and
Poorer-quality arable land recorded the largest fall, per annum for amenity holdings which have options uptick in protectionism and initiatives to encourage land values has become somewhat diluted with the
reflecting the lower productive capacity coupled with to diversify away from agriculture (see table right). domestic output bolstered the earning potential from emergence of non-farming lifestyle buyers, any reduction
uncertainty over the sector’s future prosperity (trade agriculture while also reducing downside price risk. in farm subsidies and/or weakened trade position would
and subsidy). Conversely, despite exposure to post-Brexit Values in an historic context This, in turn, prompted increased interest from both likely exert downward pressure on the value of commercial
trade arrangements, lower-quality grazing land remains Over the past 100 years, the value of GB farmland has, domestic and foreign investors, who entered the market holdings. Yet, we see no reason why farmland will not
insulated, falling by only 1% as demand remained strong on average, increased by 6% per annum (see pages 8 and 9). in search of stable and relatively low-risk cash flow. retain its status for long-term wealth preservation.
for lifestyle holdings with higher amenity value. Yet, when adjusted for inflation, real-term growth equates
At the close of 2017, Savills GB Farmland Value Survey to just over 1% (compound annual growth). While the
shows average prime arable commanded close to £9,000 lion’s share of nominal growth has occurred over the Five-year outlook
per acre, with average grade 3 farmland trading at £7,500 past 15 years, real-term values indicate higher volatility. GB supply Average value GB farmland Straight commercial holdings value forecast
per acre. Grazing land was trading at between £4,400 Despite the sector-specific and macro-economic Amenity/lifestyle holdings value forecast
and £5,500 per acre, reflecting the variation in quality factors which influenced values, we also note that the
and geography across the holdings marketed. fundamental shape of land ownership has shifted. At the £8,000 200,000
While the spread between prime and average arable turn of the 20th century, the bulk of farmland was held
land is at a 10-year high, the difference between by a comparatively small number of owners, with more
180,000
average and less productive grazing land has fallen than 90% of land let. Over the period of our research,
from a 2012/13 high, although it is still well below the £7,500
levels recorded in the late 1990s and early 2000s, 160,000
where the premium was almost 50%. The decline is slowing, with
On average, the decline in capital values has persisted
an increase in Brexit-related
GB annual farmland supply (acre)
Average farmland value (£/acre)
140,000
since the downturn in commodity prices during 2014. £7,000
We calculate an average cumulative drop of 6% across the clarity likely to bring more
market for all arable farmland over the past three years, 120,000
with a 3% fall for grazing land. But the results of our certainty to the marketplace
quarterly Farmland Value Survey indicate this decline is £6,500 100,000
slowing, with an increase in Brexit-related clarity likely
to bring more certainty to the marketplace.
80,000
Five-year outlook
£6,000
Our outlook for the next five years shows an overall 60,000
recovery to positive growth, albeit at a pace below historic
trends. However, much will depend on the outcome of
trade negotiations and revisions to agricultural subsidy. 40,000
£5,500
On the supply side, unless the national political and
economic picture materially worsens, we believe annual 20,000
volumes will increase over the near-to-medium term
and return to long-run average levels.
Interest from lifestyle buyers is likely to continue, £5,000 0
particularly for holdings with scope for diversification
2013 2014 2015 2016 2017 2018 2019 2020 2021 2022
away from agriculture.
Over the medium term, a weakened trade position
and reduced subsidy, coupled with any further softening Source Savills Research Note The land value forecast uses Savills rural data and considers factors ranging from the macro-economic
outlook, the performance of competing asset classes, through to the individual components influencing farm earnings
6 savills.com/research savills.com/research 7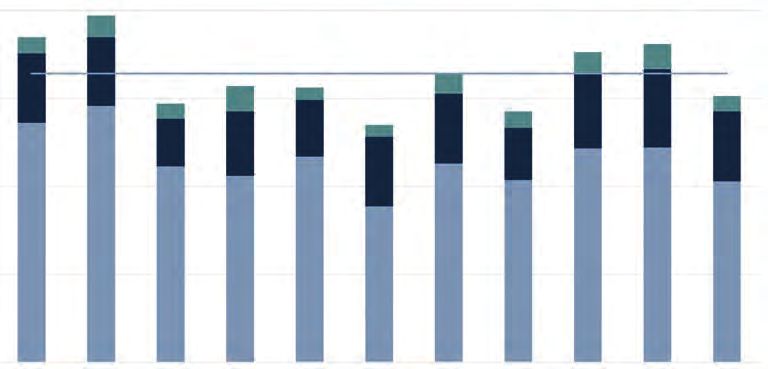
G B FA R M L A N D VA L U E S G B FA R M L A N D VA L U E S
11 key
events
that have
shaped
farmland
values: 3 1940-1950
1900 to 1 1900-1930 The Second World
2017 There’s a material
fall in land values
War boosts demand
for food and, with 6 1992
as the sector opens guaranteed prices, CAP reforms lower
The impacts
up to international leads to a 50% subsidy payments
of historical markets. The UK £ increase in the area
CAP
for cereals and
events on is inefficient of arable farmland. beef. It marks the
farmland compared with 2 1930-1940 Changes in attitude, start of a transition
emerging markets The establishment innovation and 4 1950-1970 from incentivising
values inform SFP
– especially the US. of UK marketing financial support The Common per unit production
our forecasts The First World War boards increase see the adoption of Agricultural Policy with the CAP 11 2016
for the next prompts high price certainty, and technology to aide (CAP) comes into introduction of 7 2003 10 2014 The UK votes
five years. inflation and causes the introduction of production. This existence with the Arable Area Interest from 8 2005 9 2008 Weakness in to leave the EU,
The detailed a huge strain on farm subsidy brings spurs capital aim of collectively Payments, which lifestyle buyers CAP reforms with The global financial commodity pricing casting material
the farming sector, a hardening of growth until the modernising the 5 1970-1980 lead to increased peaks at around the introduction of crash heralds drags average uncertainty over
discussion can
which drives land land values and early 1950s when industry towards The UK joins the disparity between 45% of demand, the Single Farm a resurgence in values down as the future
be found on values down a return to positive demand settles realising better EU and, in turn, average arable and a level not reached Payment (SFP) demand for relative farm earnings prosperity of
pages 6 and 7 further. real-term growth. and values retract. economics of scale. the CAP. grassland values. again until 2015. mechanism. safe-haven assets. contract. UK agriculture.
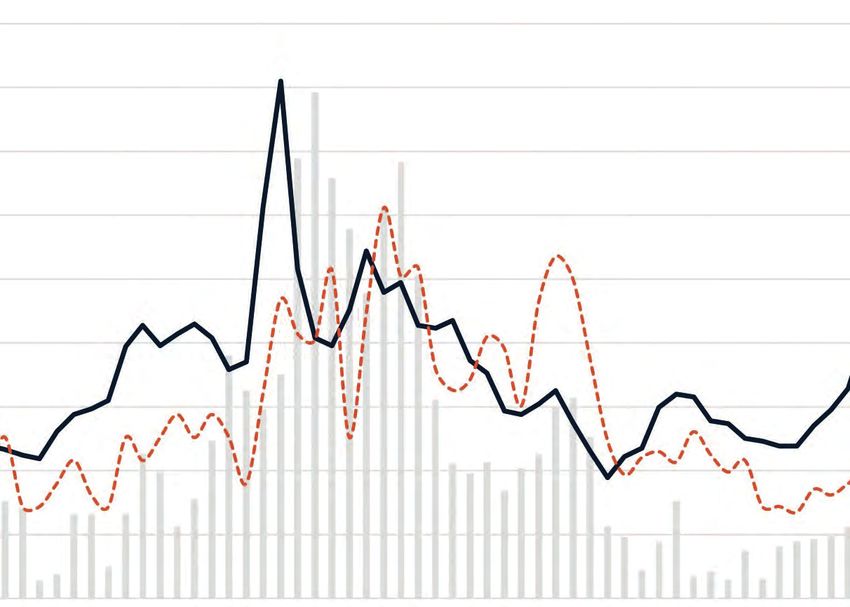
Historical context Long-term average value of GB farmland compared with inflation and base rate: 1900-2017 UK annual inflation Average farmland value (real) Bank of England base rate
£9,000
25%
1 2 3 4 5 6 7 8 9 10 11
£8,000
£7,000 20%
£6,000
UK infl ation (RPI%)
Value (£ per acre)
15%
£5,000
£4,000
10%
£3,000
£2,000
5%
£1,000
£0 0%
1912
1915
1918
1921
1924
1927
1930
1900
1903
1906
1909
1933
1936
1939
1942
1945
1948
1951
1954
1960
1963
1966
1969
1972
1975
1978
1981
1984
1987
1990
1993
1996
1999
2002
2005
2008
2011
2014
2017
1957
Source Savills Research, Bank of England
8 savills.com/research savills.com/research 9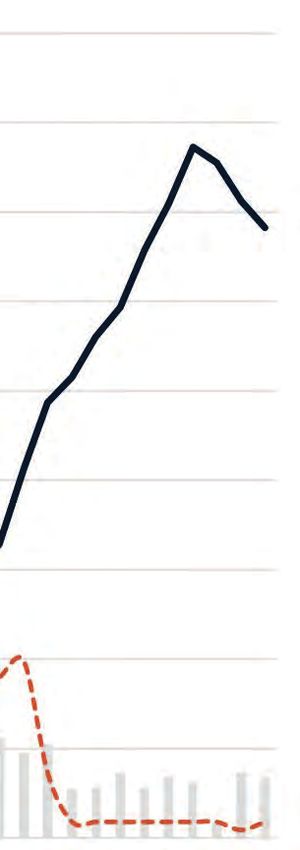
G
REB SFA
I L IREM
NLCA
E NMDAR
PE N T S S A F E G UA R D I N G R E T U R N S
Farmland rents
The rental market remained subdued during 2017, in keeping with the
Four for the future
Given the uncertainty and associated risk over the next five years, land managers
longer-term downtrend in the size and frequency of reviews undertaken should assess their respective exposure to a decline in farm earnings. Our research
has flagged four short- and long-term levers to protect investment returns
1. 2.
Driven by weakness in commodity prices since 2014, on direct subsidy payments to remain cash-flow
the average uplift in rents has fallen from just over 7% positive during the downturn in commodity prices.
between 2013 and 2014 to around 4% during the last two Should the agricultural sector’s position weaken post
years. We continue to note the reduced number of reviews Brexit, we see material benefit in landlords engaging
taking place, as well as an increase in the number of with tenants to assess rents in relation to the realisable
no change and downward revisions. earning capacity of both the farming operation and the
During the past 10 years, our Estate Benchmarking Survey land utilised. While this could lead to rents commanding
shows that average rents have increased by just over 4.5% a larger share of cash flow, scarcity of supply should
per annum (compound annual growth). Farm business offer protection for newer, shorter terms tenancies.
tenancies (FBTs) recorded closer to 5.5% growth, yet
underperformed traditional tenancies (AHA) during
2016 and 2017. Farm business tenancies
We estimate annual growth in AHA rents has averaged
recorded growth during 2016 Increasing operational efficiency Tighter capital discipline will ensure cash is
more than 6% in the last two years. The value gap
between tenancy types has also narrowed since 2015, and 2017 yet underperformed would give the most immediate conserved and not re-invested into a business
albeit remaining marginally above the long-run average relief. This could be achieved either where the future return is uncertain. We are
of around 30% FBT premium to AHAs. traditional tenancies through raising output yields to likely to see an increase in the number of project
While returns appear modest in comparison with the
heightened risk posed to agricultural earnings, long-term boost aggregate revenue, or by deferrals until further clarity emerges on the
capital appreciation remains the prime attraction to the implementing cost reductions to impact of Brexit. Similarly, we are unlikely to see
asset class. Although we remain bullish on farmland’s role prevent margins from contracting. surplus cash being used to ease leverage, with
as an inflation hedge, income returns could come under
pressure if cash flow from agriculture declines. This is However, the extent to which gains reserves likely to be highly prized over the next
particularly salient for farm businesses which have relied could be made will be limited. few years to provide additional running room
against lower cash flow.
3. 4.
Average passing rents During the past 10 years, average rents have increased by just over 4.5% per annum
AHA (rent/acre) FBT (rent/acre) Savills Rural Research modelled gross yield
£140 2.0%
1.8%
£120
Modelled gross income return from let farmland
1.6%
£100
1.4%
Value added investment into enterprises other
Average rent per acre (£)
Diversifying revenue to lessen the reliance on
£80
1.2% agricultural earnings represents a longer-term than agriculture present the best, yet most
undertaking. Our Estate Benchmarking Survey capital-intensive, way to protect both income
1.0%
shows that rural businesses have reduced their and capital value. These often require a complete
£60
0.8% exposure to farming over the past 15 years. change in land use across the area in question.
Residential and leisure initiatives have increased Combined energy generation and storage, as
£40 0.6% in prevalence, often making use of surplus built well as woodland establishment, both present
infrastructure that is no longer required or not attractive options with plenty of benefit to be
0.4%
£20
fit for modern agricultural purpose. The realised, although thorough due diligence is
0.2% all-but-confirmed shift from direct subsidy required to unlock maximum value.
payments towards incentivising environmental
£0
2007 2008 2009 2010 2011 2012 2013 2014 2015 2016 2017
0.0% management also presents opportunities for
future income streams.
Source Savills Research, Bank of England
10 savills.com/research savills.com/research 11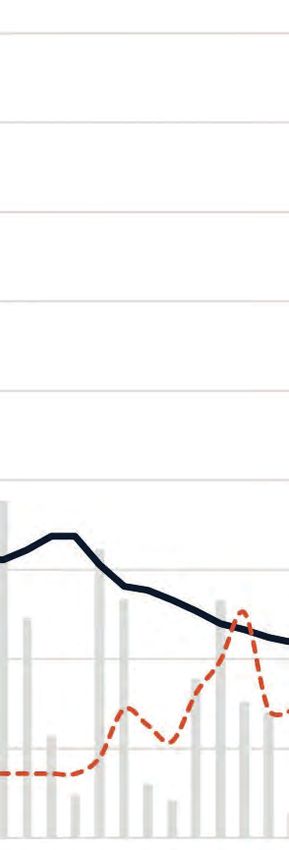
The team For more information about this report, please contact us

              Rural Research                                                     Farm & Estate Sales

              Ian Bailey                          Andrew Snedden                 Alex Lawson                       Charles Dudgeon
              020 7299 3099                       020 7409 8174                  020 7409 8882                     0131 247 3702
              ibailey@savills.com                 andrew.snedden                 alawson@savills.com               cdudgeon@savills.com
                                                  @savills.com

              Savills plc: Savills plc is a global real estate services provider listed on the London Stock Exchange. We have an international network of more than 700 offi ces
              and associates throughout the Americas, the UK, continental Europe, Asia Pacifi c, Africa and the Middle East, offering a broad range of specialist advisory,
              management and transactional services to clients all over the world. This report is for general informative purposes only. It may not be published, reproduced or
              quoted in part or in whole, nor may it be used as a basis for any contract, prospectus, agreement or other document without prior consent. While every effort has
              been made to ensure its accuracy, Savills accepts no liability whatsoever for any direct or consequential loss arising from its use. The content is strictly copyright
              and reproduction of the whole or part of it in any form is prohibited without written permission from Savills Research.

Savills_Agri_01_12_front_back_cover_v1.0.indd 4                                                                                                                                        09/02/2018 12:39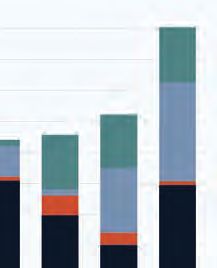

You can also read