Financial Markets Monthly Update - December 1 2020 - ATB Financial

Page created by Norman Glover
 
CONTINUE READING
Financial Markets Monthly Update - December 1 2020 - ATB Financial
Financial Markets Monthly Update

December 1 2020
Financial Markets Monthly Update - December 1 2020 - ATB Financial
Contents

What’s Inside

I.     Quick-Take: November Rally One for the Record Books

II.    Interest Rates

III.   Canadian Dollar and DXY FX

IV.    WTI + Canadian Crude Outlook

V.     Natural Gas

VI.    ATB FMG Forecasts

                                                             ATB Capital Markets | 2
Financial Markets Monthly Update - December 1 2020 - ATB Financial
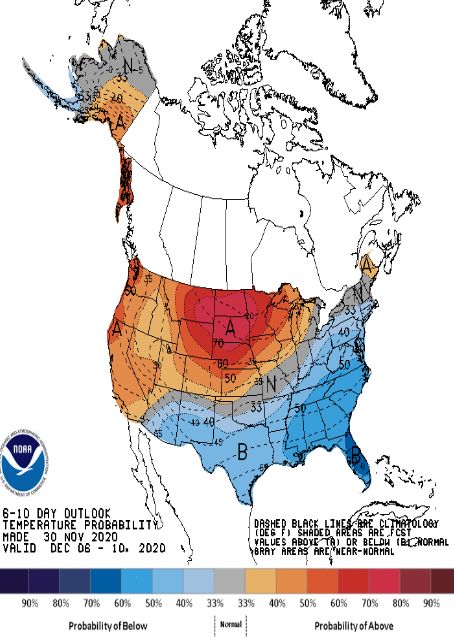
Quick Take: November Rally
One for the Record Books
Section I
Financial Markets Monthly Update - December 1 2020 - ATB Financial
QuickTake: A November to Remember
 It’s Been A Risk-On Rally All Month

Monthly Recap
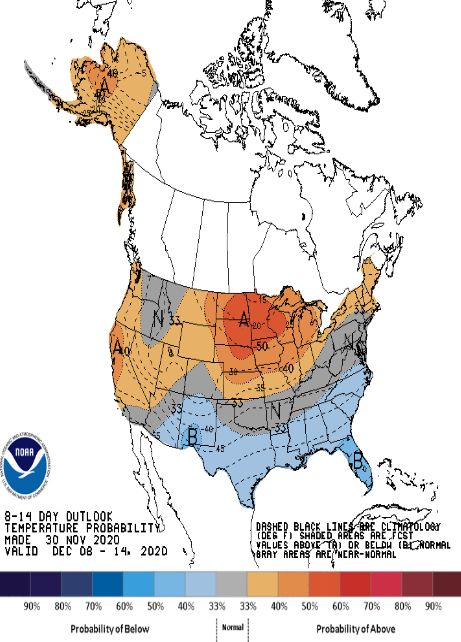
• It’s been a stellar month for financial markets with a risk-on rally pushing equities, commodities, and the Canadian dollar to solid gains. Optimism
  surrounding vaccines kick-started the move that has led to near record monthly returns across many assets (see heat map below).

• The USD dollar drifted lower as traders sold it steadily in pursuit of higher returns elsewhere. CAD, EUR, AUD, and CNY were all prime beneficiaries and
  currencies linked to commodities and early stage manufacturing processes look set to continue appreciating against the USD.

• In commodities, the prospect of tight physical markets across base metals and ags is exerting upward pressure on near term prices as we enter what is
  expected to be a strong period of global growth in 2021. Usually we would not expect to see undersupplied commodity markets this early in the
  growth cycle, so this is an unusual dynamic that could be very bullish for prices. Oil prices firmed as well as mobility is expected to rebound and
  OPEC+ should maintain its commitment to support the market via supply restrictions for another few months.

• Equities surged as low policy rates, the prospect of more fiscal stimulus, as well as vaccines pushed most indices to fresh highs – although valuations
  are also following suit with the S&P 500 forward P/E ratio screening in the 93rd percentile relative to the last 20 years - expensive no matter how you
  look at it. Can these moves last? At this point in time, 2021 global growth is essentially assumed to confirm a ‘V’ shaped recovery…that may be a high
  bar especially given the recent surge in cases that could see GDP take another dip before the benefits of immunization are realized. However, the
  market has paid handsome returns to those with a positive outlook since March…here’s hoping that trend continues through the holidays.
  Heat Map of Monthly Returns: CAD, WTI, and Equities Posted Solid Gains for the Month

                                                                                                                                       ATB Capital Markets | 4
Financial Markets Monthly Update - December 1 2020 - ATB Financial
Interest Rates

Section II
Financial Markets Monthly Update - December 1 2020 - ATB Financial
Interest Rates and Macro Backdrop
   A Run Down of What’s Impacting the Cost of Money

Canada
What We Know

• BoC Governor Macklem confirmed that our central bank is concerned about the amount of bonds that it can buy via QE - given the limited supply in the
  market. Anything over 50% is not really viable. Hence the reduction from $5billion per week to $4billion.

• Changes in the structure of QE are more important than the reduction in the volume of bonds purchased. An increasing focus on 5-7 year part of the
  curve is designed to support commercial and household lending more specifically.

• The elimination of purchases of bonds under 2 years (and reduction under 3 years) will weigh on prices and keep rates at the front end underpinned.

• As these bonds are no longer "squirrelled away" by the BoC, they will be available to the street and will compete for investors with Treasury Bills and BAs.
  These legacy bonds have higher yields (issued before 2020). This could push BA and Bill yields higher - pushing CDOR and swap rates higher over time

What We’re Watching For

• Vaccines. Release and availability in Canada. It appears that we shall have to be patient north of the border as we have no domestic producers. We
  will watch for the impact on economic sentiment and activity when this fact dawns on the public. Could this hold back the rising of market rates at
  the margin?

• Negative rates - or at least lower rates. Governor Macklem, when asked recently about the possibility of Canadian policy dropping to below zero,
  said " negative rates are in our toolkit but they would not be terribly helpful at this time." However, perhaps with one eye on the limits to QE and
  another on the limits of vaccine availability (and indeed the seemingly limited public willingness to receive immediate vaccination) he also added
  that the BoC could potentially lower the effective lower bound from 25bps without going negative.

                                               The market remains concerned about downside
                                              risks, but the BoC has been vocal in their support
                                              of the recovery through easy policy rates and QE

                                                                                                                                         ATB Capital Markets | 6
Interest Rates and Macro Backdrop
   A Run Down of What’s Impacting the Cost of Money

US
What We Know

• Despite strong data in Q3, the Federal Reserve remains cautious on the sustainability of the bounce and the impact of a vaccine. They have no plans to
  change course on policy

• Indeed, they may well look to be more aggressive on QE down the road. At first, most likely in what they purchase - ie longer duration for more impact
  (like the BoC.) But should fiscal spending increase issuance, or should the economy need it, they may look at increasing how much they purchase too.

• Janet Yellen is the new Treasury Secretary. As a former Fed Chair, she will work more closely with Jerome Powell than Steve Mnuchin, and she knows the
  nature and limits of the job better than he did. No more public calls for negative rates. And a commitment to push unemployment as low as is feasibly
  possible with the Fed's help (via highly accommodative monetary policy).

What We’re Watching For

• Georgia. A Democratic sweep in the Senate runoffs on January 5th would hand them "Blue Wave" control. With seemingly unstoppable legislative
  power and with the Biden/Yellen partnership at the helm, we may see some aggressive programs to boost wealth and wages. Potentially quite
  negative for bonds and a strong driver of a steeper yield curve. Failure to gain total control of the Senate means Gridlock - a much less powerful
  position for Biden and at the margin more dovish for term rates.

                                           Election risks are back in full force in January with
                                           Senate run-offs taking place that could impact the
                                                   size of any potential fiscal impulse

                                                                                                                                       ATB Capital Markets | 7
Major Macro Trends
         Macro Charts to Consider

Markets are in a buoyant mood. Central banks are committed to low                            Fig. 2: US 5s-30s Curve has Levelled Off After Steepening Sharply
rates and balance sheet expansion while yield curves have taken a
                                                                                                           140
breather…can the party last?
                                                                                                           130
• Has the backdrop changed? COVID cases are surging, vaccines are                                          120
   months away and yet markets are at all times highs, the USD is falling,
                                                                                                           110
   and commodities rising

                                                                                              Bps Spread
                                                                                                           100
• And this is all without further clarity on the US fiscal impulse under                                    90
   Biden – is a large package needed if the outlook is so rosy?
                                                                                                            80
• One place to look for over jubilant pricing dynamics may be                                               70
   stocks…the S&P 500 forward P/E ratio is screening ~21x at the                                            60
   moment…that’s in the 93rd percentile running back to 2000…yikes                                          50
• However, what else is one to buy? Can bonds rally much further from                                       40
   here? Equities are anticipatory assets and thus the outlook is obviously
   well beyond the current maelstrom of bad news…let’s hope
   expectations are met – we remain optimistic for a strong cyclical
   growth period in 2021 but the outlook is not without risks…                         Sources: Bloomberg

                           Fig. 1: Fed Assets Have Sky Rocketed Above US$7 trillion…                       Fig. 3: Stocks Getting Pricey? SPX P/E in the 93rd Percentile
                          7.50                                                                       26                                                                            100%
                                                                                                                                                        Rank: 93%                  90%
                          7.00                                                                       24
Fed Assets US$ Trillion

                          6.50                                                                                                                                                     80%
                                                                                                     22                                    P/E: 21.3x

                                                                                                                                                                                          Percentile Rank
                          6.00                                                                                                                                                     70%
                                                                                                     20

                                                                                         P/E Ratio
                                                                                                                                                                                   60%
                          5.50
                                                                                                     18                                                                            50%
                          5.00
                                                                                                     16                                                                            40%
                          4.50
                                                                                                                                                                                   30%
                          4.00                                                                       14
                                                                                                                                                                                   20%
                          3.50                                                                       12                                                                            10%
                          3.00                                                                       10                                                                            0%
                                                                                                             1990
                                                                                                             1992
                                                                                                             1993
                                                                                                             1994
                                                                                                             1995
                                                                                                             1996
                                                                                                             1997
                                                                                                             1999
                                                                                                             2000
                                                                                                             2001
                                                                                                             2002
                                                                                                             2003
                                                                                                             2004
                                                                                                             2006
                                                                                                             2007
                                                                                                             2008
                                                                                                             2009
                                                                                                             2010
                                                                                                             2011
                                                                                                             2013
                                                                                                             2014
                                                                                                             2015
                                                                                                             2016
                                                                                                             2017
                                                                                                             2018
                                                                                                             2020
                                                                                                             2021
             Sources: Bloomberg                                                                                                Percentile Rank          Forward P/E Ratio

                                                                                                           Sources Bloomberg, ATB FMG                               ATB Capital Markets | 8
Canadian Dollar and G10 FX

Section III
Canadian Dollar Outlook
 The Loonie Could be a Prime Beneficiary of the Growth Story in 2021

The Loonie had a strong month as commodity prices and growth                            Fig. 2: USDCAD Strong Support ~1.30 Being Tested Once Again
prospects continue to drive appreciation against the US dollar
                                                                              1.50
• With copper, oil, and equities all surging in November it was easy for
   CAD bulls to go along for the ride as the Loonie gained over 2.5% on       1.45
   the month
• CAD’s high beta status means it will be riding shot-gun if the engine of    1.40
   global growth starts to rev in 2021
• Raw materials, agriculture, and energy prices all could be on the cusp      1.35
   of cyclical bull markets in 2021 as persistent under-investment in the
   last decade has created the conditions for tight physical markets to       1.30
   appear very early in the growth cycle – commodities are typically in
   deficit only in the late stages of the growth cycle, not the beginning     1.25
• That could be a boon for the Loonie in 2021…but risks remain
• COVID cases continue to threaten activity into 1Q21 and Canada is
   also lagging many G10 countries for delivery of vaccines, which could
   hamper domestic growth                                                    Sources: Bloomberg, ATB FMG

       Fig. 1: CAD vs Copper: Loonie Tracking Dr. Copper Closely             Fig. 3: CADUSD vs Copper, Weekly 2% Change in Copper = 0.5% in CAD
0.78                                                                 $360                      4.00%
0.77                                                                 $340
0.76                                                                                           3.00%
                                                                     $320                               y = 0.2591x - 0.001
0.75                                                                                           2.00%
                                                                     $300                                   R² = 0.4463
0.74

                                                                                CAD % Change
                                                                                               1.00%
0.73                                                                 $280
0.72                                                                                           0.00%
                                                                     $260
0.71                                                                                           -1.00%
                                                                     $240
0.70
0.69                                                                 $220                      -2.00%
0.68                                                                 $200                      -3.00%
                                                                                               -4.00%
                                                                                               -5.00%
                                CADUSD     Copper                                                   -14.00% -11.00% -8.00%    -5.00%   -2.00%   1.00%   4.00%    7.00%
                                                                                                                              Copper % Change
  Sources: Bloomberg, ATB FMG
                                                                                          Sources Bloomberg, ATB FMG
                                                                                                                                                   ATB Capital Markets | 10
USD Index and G10 FX
 The Greenback On the Precipice

The USD has been on the back foot since the spring with the DXY                                         Fig. 2: DXY Near Crucial Support with Momentum Against it
down -10% since March and -4% year to date. The market is now
                                                                                               105
testing key technical levels, and given the weak fundamental
backdrop it could be ‘make-it-or-break-it’ time in the next few
                                                                                               100
months
• The USD is facing three major threats: 1) A record trade deficit, 2) Ultra                     95
   loose monetary policy + more fiscal stimulus, and 3) An increasing
   chance of a multi-year period of global cyclical growth                                       90
• The USD remains the world’s reserve currency and in times of                                   85
   upheaval it will catch a bid in the flight to safety…but the weak
   fundamental backdrop means that the USD is swimming against the                               80
   tide over the medium term
• Periods of strong global growth are generally not great for the USD as                         75
   commodity exporting/manufacturing currencies reap the most reward
                                                                                                 70
• Incoming Treasury Secretary Yellen has also noted in the past how a                          Sources: Bank of Canada MPR October 2020
                                                                                                   2010       2011   2012   2013    2014    2015   2016   2017   2018   2019    2020
   strong USD held the domestic recovery back in 2014+2016
Fig. 1: US Trade Deficit Should Exert Downward Pressure on the USD                                       Fig. 3: When Vol Spikes (Yellow), So Does the DXY (Blue)
        125                                                         0                                   104                                                                    90
        115                                                         -10                                 102                                                                    80
                                                                          Trade Balance ($b)                                                                                   70
                                                                    -20                                 100
        105
                                                                                                                                                                               60

                                                                                                                                                                                    VIX (%)
                                                                    -30                                 98
  DXY

                                                                                                  DXY
        95                                                                                                                                                                     50
                                                                    -40                                 96
        85                                                                                                                                                                     40
                                                                    -50                                 94                                                                     30
        75                                                          -60                                 92                                                                     20
        65                                                          -70                                 90                                                                     10
              1997
              1998
              1999
              2000
              2001
              2002
              2003
              2004
              2005
              2006
              2007
              2008
              2009
              2010
              2011
              2012
              2013
              2014
              2015
              2016
              2017
              2018
              2019
              2020

                              DXY      US Trade Balance
                                                                                                                                          DXY      VIX
Sources: Bloomberg, ATB FMG
                                                                                                      Sources Bloomberg, ATB FMG
                                                                                                                                                             ATB Capital Markets | 11
WTI + Canadian Crude Outlook

Section IV
Crude Oil Outlook
 OPEC, Lockdowns Key to Near Term Outlook

Oil prices surged as vaccine news drove the hope that we finally have                                                                                                                                                                Fig. 2: US Oil Inventories Normalization Has Slowed
a path towards normal mobility levels. However, that optimism must
be tempered amid key near term risks: OPEC and a COVID Winter                                                                                                                                                                     600,000
Wave                                                                                                                                                                                                                              550,000
• WTI prices had a historic month with a +25% rally in the prompt
   contract that pushed the curve flatter (Fig. 1) with mild backwardation                                                                                                                                                        500,000

                                                                                                                                                                                                                     000's bbls
   creeping into the picture                                                                                                                                                                                                      450,000
• However, we are still observing overall high levels of inventory despite
   the progress made to date with US commercial stockpiles running                                                                                                                                                                400,000
   right at their 5-yr range top (Fig. 2)                                                                                                                                                                                         350,000
• The outlook is also pressured by OPEC indecision on whether to
                                                                                                                                                                                                                                  300,000
   maintain the current supply cuts: The market is convinced another 3-
                                                                                                                                                                                                                                            Jan   Feb Mar Apr May   Jun Jul Aug   Sep Oct     Nov Dec
   months is needed, but Gulf states are now wary about supporting the
   return of US shale and are dealing with large domestic budget deficits                                                                                                                                                                     5yr Range       5yr Avg         2020            2019
• All of this and we may face yet more lockdowns as COVID cases
   surge…oil price volatility remains high and with good reason (Fig. 3)                                                                                                                                  Sources: Bloomberg, EIA

       Fig. 1: WTI Curve Backwardated Near the Front, Backs Stay Flat                                                                                                                                                                Fig. 3: Volatility Remains Elevated at 47%
             $50.00                                                                                                                                                                                                            360
             $48.00                                                                                                                                                                                                            335
                                                                                                                                                                                                                               310
             $46.00                                                                                                                                                                                                            285

                                                                                                                                                                                                            Vol % Annualized
 WTI $/bbl

             $44.00                                                                                                                                                                                                            260
                                                                                                                                                                                                                               235
             $42.00                                                                                                                                                                                                            210
             $40.00                                                                                                                                                                                                            185
                                                                                                                                                                                                                               160                                                           47.37%
             $38.00                                                                                                                                                                                                            135
             $36.00                                                                                                                                                                                                            110
                                                                                                                                                                                                                                85
             $34.00                                                                                                                                                                                                             60
                      Nov-20

                                                          Nov-21

                                                                                              Nov-22

                                                                                                                                  Nov-23

                                                                                                                                                                      Nov-24
                               Feb-21
                                        May-21
                                                 Aug-21

                                                                   Feb-22
                                                                            May-22
                                                                                     Aug-22

                                                                                                       Feb-23
                                                                                                                May-23
                                                                                                                         Aug-23

                                                                                                                                           Feb-24
                                                                                                                                                    May-24
                                                                                                                                                             Aug-24

                                                                                                                                                                               Feb-25
                                                                                                                                                                                        May-25
                                                                                                                                                                                                 Aug-25

                                                                                                                                                                                                                                35
                                                                                                                                                                                                                                10

                                    Today                                      1-Month Ago                                                 3-Months Ago

    Sources: Bloomberg, ATB Financial Markets                                                                                                                                                               Sources Bloomberg

                                                                                                                                                                                                                                                                                     ATB Capital Markets | 13
Canadian Crude Outlook
 Differentials Remain Strong

Canadian Crude differentials continue to see stable pricing                               Fig. 2: Canadian Crude Differentials to WTI (US/bbl)
environment as US imports recover.
                                                                                 $10.00
• The demand for Canadian heavy oil from US refiners remains strong               $5.00
   and shipments into the US have improved slowly but surely since the
                                                                                  $0.00
   market bottomed in May
                                                                                 -$5.00
• The 7-week average of US imports is sitting just below 3.3 million            -$10.00
   barrels per day, which is isn’t too far from the levels seen prior to the    -$15.00
   market crash earlier this year                                               -$20.00
• Egress out of the WCSB continues to be favourable given the                   -$25.00
   increased capacity on the Mainline due to lower overall volumes…the          -$30.00
   call on crude by rail has plummeted as a result (Fig. 3)
• Rail shipments were running less than 100k bpd during September,
   the last month for which data is available – this compares to over 400k
   bpd pre-COVID…                                                                                                   WCS        MSW      C5 CFT
• At the current run rate, Canadian differentials should remain strong
   over the near term despite demand headwinds                                 Sources: Bloomberg, ATB FMG

Fig. 1: US Imports of Canadian Crude Improving, Not Fully Recovered                       Fig. 3: Crude by Rail Volumes Plunged, Supporting WCS Diffs
             4,300                                                                $0.00                                                                            450,000
             4,100                                                                                                                                                 400,000
             3,900                                                              -$10.00                                                                            350,000
                                                                                                                                                                   300,000
  bbls/day

             3,700
                                                                                -$20.00                                                                            250,000
             3,500
                                                                                -$30.00                                                                            200,000
             3,300
                                                                                                                                                                   150,000
             3,100
                                                                                -$40.00                                                                            100,000
             2,900                                                                                                                                                 50,000
             2,700                                                              -$50.00                                                                            0

                      US Imports Canadian Crude bpd   7-Week Avg                                  WCS Differential (US$/bbl)         Crude By Rail Exports (bpd)

     Sources: Bloomberg, DOE, ATB FMG                                              Sources: Baker Hughes, ATB FMG

                                                                                                                                               ATB Capital Markets | 14
Natural Gas

Section V
Natural Gas Outlook
 Inventories Elevated, Winter Weather Missing

Natural gas prices plunged in November as warmer weather kept                                                                                                                                                Fig. 2: US Inventories Still Elevated at +6.8% to the 5yr avg
demand on the backfoot
                                                                                                                                                                                                        4,500
• The outlook for natural gas prices remains fundamentally strong as
                                                                                                                                                                                                        4,000
  low capex/drilling + lower associated gas out of the Permian has
                                                                                                                                                                                                        3,500
  shifted inventories across North America and created conditions
  where we could see significant price appreciation in the medium term                                                                                                                                  3,000
                                                                                                                                                                                                        2,500
• But for now we are missing one key ingredient…winter weather

                                                                                                                                                                                                Bcf
                                                                                                                                                                                                        2,000
• Above seasonal temperatures were not on the radar this year as La                                                                                                                                     1,500
  Nina was expected to usher in a cooler than average winter                                                                                                                                            1,000
• Thus far we are seeing heating demand below average for November                                                                                                                                        500
  (Fig. 3) which has pushed the curve much lower in the fronts over the                                                                                                                                     0
  last month (Fig. 1)                                                                                                                                                                                           Jan    Feb Mar Apr May     Jun     Jul Aug      Sep Oct        Nov Dec
• US inventories are still ~7% above the 5-yr average (Fig. 2)…so we
                                                                                                                                                                                                                       5yr Range        5yr Avg               2020             2019
  need something to break soon or else the downward pressure on
  prices will remain
                                                                                                                                                                                            Sources: Bloomberg, EIA

         Fig. 1: Nymex Pricing Took a Hit in the Front                                                                                                                                         Fig. 3: Res-Comm Demand Below Seasonal Averages for November
$3.60                                                                                                                                                                                                   70
$3.40                                                                                                                                                                                                   60
$3.20                                                                                                                                                                                                   50
$3.00

                                                                                                                                                                                                Mcf/d
                                                                                                                                                                                                        40
$2.80
                                                                                                                                                                                                        30
$2.60
                                                                                                                                                                                                        20
$2.40
                                                                                                                                                                                                        10
$2.20
                                                                                                                                                                                                         0
                 Apr-21
                          Jul-21
                                   Oct-21

                                                     Apr-22
                                                              Jul-22
                                                                       Oct-22

                                                                                         Apr-23
                                                                                                  Jul-23
                                                                                                           Oct-23

                                                                                                                             Apr-24
                                                                                                                                      Jul-24
                                                                                                                                               Oct-24

                                                                                                                                                                 Apr-25
                                                                                                                                                                          Jul-25
                                                                                                                                                                                   Oct-25
        Jan-21

                                            Jan-22

                                                                                Jan-23

                                                                                                                    Jan-24

                                                                                                                                                        Jan-25

                                                                                                                                                                                                              Jan     Feb Mar Apr May     Jun     Jul   Aug     Sep Oct       Nov Dec

                                                                                                                                                                                                                       5yr Range        5yr Avg               2020             2019
                                                                Today                                 1-Month Ago
  Sources: Bloomberg, Baker Hughes
                                                                                                                                                                                              Sources Bloomberg, ATB FMG

                                                                                                                                                                                                                                                                     ATB Capital Markets | 16
Natural Gas Outlook (cont’d)
 Inventories Elevated, Winter Weather Missing

A bright spot for prices recently has been US LNG exports, which                         Fig. 2: US LNG Exports Have Surged to Record Highs (Bcf/day)
have surged to a new record this month at +11Bcf/d – quite the
recovery from a meagre 2bcf/d back in the summer                                              12

• Strong TTF and Asia pricing has helped drive demand and the                                 10
   arbitrage for US producers remains favourable
                                                                                              8
• This is a bright spot given the weak domestic res-com demand profile

                                                                                Bcf per day
   highlighted on the 1st page – if we do get seasonal winter weather and                     6
   continued LNG demand in the 9-11bcf/d range then the conditions
   are ripe for a sustained rally until spring injection season                               4
• Drilling activity in the US remains low, with Canadian rig counts                           2
   rebounding much faster as AECO surged past C$3.00/Gj
• That dynamic may help Nymex outperform AECO this winter in                                  0
   addition to recent lower than contracted flows at Eastern gate
• However, the AECO basis has proven resilient thus far and is still
   stronger than it was in October running at -US$0.75/mmBtu for
   January                                                                  Sources: Bloomberg, EIA

 Fig. 1: Canadian Gas Rig Counts Have Rebounded Faster than the US              Fig. 3: US Weather Outlooks: 6-10 Day (Left) and 8-14 Day (Right)

 140
 120
 100
  80
  60
  40
  20
   0

                                     Canada   US

  Sources: Bloomberg, Baker Hughes

                                                                                                                                     ATB Capital Markets | 17
                                                                                Sources Bloomberg, ATB FMG
ATB FMG Forecasts

Section VI
ATB Capital Markets Pricing Outlooks
USDCAD Outlook and Energy Price Deck

                                                                        ATB FMG USDCAD Forecast

 1.42
 1.40
                                                                                                        ATB USDCAD Forecast
 1.38
 1.36                                                                                         Q4 20                      1.32
 1.34                                                                                         Q1 21                      1.29
 1.32
 1.30
                                                                                              Q2 21                      1.27
 1.28                                                                                         Q3 21                      1.28
 1.26
                                                                                              Q4 21                      1.28
        Q4 19   Q1 20    Q2 20       Q3 20   Q4 20   Q1 21    Q2 21   Q3 21     Q4 21
                                                                                             As of October 2020
                 Actual Historical            Median            ATB FINANCIAL

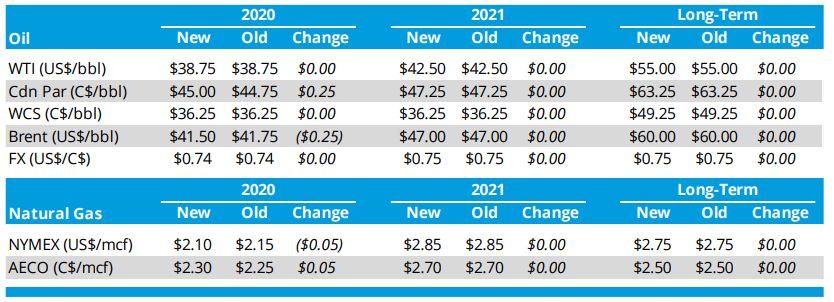
                                                                ATB Capital Markets Energy Price Deck

                    Sources: Bloomberg, ATB Capital Markets                                                       As of September 2020   ATB Capital Markets | 19
ATB Financial Markets Contacts
FMG Desk Contacts

                                   Rob Laird
                              Managing Director
                          ATB Financial Markets Group
                                 403-974-3582
                                rlaird@atb.com

Foreign Exchange                                        Commodities                                     Interest Rates
Janek Guminski, CFA            Chris Fricke, MBA        Shane Hawryluk             CJ Hilling, MBA      Mark Johnson, MBA
Sr. Director FX Sales          Director FX Sales        Director Commodity Sales   Associate Director   Director Interest Rates Sales
403-974-3580                   403-974-3580             403-974-3582               403-974-3582         403-974-3582
jguminski@atb.com              cfricke@atb.com          shawryluk@atb.com          chilling@atb.com     mjohnson@atb.com

Cynthia Chan                   Mike Gee, MBA
Associate Director FX Sales    Director ATBFX
780-392-7070                   403-869-8526
cchan@atb.com                  mgee2@atb.com

Bill Dahmer
Director FX Initiatives
780-408-7237
wdahmer@atb.com

Trading                                                 Analyst                                         Business Management

Bennett Cheung, CFA           Mark Engelking, CFA       JP Dore                                          Kim Campbell                   Dan Noble
Director FX Trading           Director FX Trading       Analyst, FMG                                     Sr. Business Manager           Director Trade Desk Solutions
403-974-3583                  403-974-3583              403-888-5342                                     403-554-3963                   403-973-3694
bcheung@atb.com               mengelking@atb.com        jdore@atb.com                                    kcampbell2@atb.com             dnoble2@atb.com

                                                                                                                                            ATB Capital Markets | 20
You can also read