NUMERICAL AND EXPERIMENTAL INVESTIGATION OF LOOSE SAND-SCRAP TIRES MIXTURE STIFFNESS
←
→
Page content transcription
If your browser does not render page correctly, please read the page content below
International Journal of GEOMATE, April., 2021, Vol.20, Issue 80, pp. 1-8
 ISSN: 2186-2982 (P), 2186-2990 (O), Japan, DOI: https://doi.org/10.21660/2021.80.j2080
 Geotechnique, Construction Materials and Environment

 NUMERICAL AND EXPERIMENTAL INVESTIGATION OF LOOSE
 SAND-SCRAP TIRES MIXTURE STIFFNESS

 Sherif Adel Akl 1, Ahmed Fathi Zidan 2, and * Kamal Ghamry Metwally 3

 1
 Faculty of Engineering, Cairo University, Egypt;
 2,3
 Faculty of Engineering, Beni-Suef University, Egypt

 *Corresponding Author, Received: 10 Jan. 2021, Revised: 27 Jan. 2021, Accepted : 10 Feb. 2021

ABSTRACT: Rubber-sand mixtures have many applications in geotechnical engineering. Considerable
literature exists on the mechanical behavior of dense sand shredded rubber mixtures, but up to the author’s
knowledge, there are no such studies on sand-filled used whole car tires. The latter is ubiquitously used in
developing countries to create cheap and quick backfill. The paper presents results from three-dimensional
finite element models and plate load tests on layers of loose sand and whole tire mixtures in a steel tank. The
finite elements program ANSYS is used to compare between a true 3D realization of the tire shape and a
homogenized representation of the mixture. Numerical and laboratory results show how interpreted stiffness
values depart from literature and physical laws of mixing soft and stiff components because the whole tire is
used instead of shredded chips. The paper applies the equivalent thickness method to interpret the plate load
test results and compute mixture stiffness for different thicknesses and shows good agreement with numerical
back analysis. The application of plate load tests in the field and using the proposed approximate method is
recommended to assess mixture stiffness rather than using assumed values from the literature. The paper
presents an empirical correlation between the normalized layer thickness and the mixture stiffness for first-
order predictions.

Keywords: numerical back analysis; plate load tests; rubber sand mixture; equivalent thickness; cheap
reinforced backfill

1. INTRODUCTION of fine powder. The effective use of waste tires as
 geomaterial has advanced greatly in the United
 The applications of sand rubber mixtures are States during the first half of the 1990s. In Egypt,
ubiquitous in geotechnical engineering. Initially, the automobile industry generates about 20 million
they have been used to induce settlement above on scrap tires every year, 88% of which is recycled.
ground tunnels and underground conduits to invoke Half of the recycled tires in Egypt are burned for
the imperfect ditch conditions [1–3]. Rubber has fuel which causes significant pollution; hence,
high elastic compressibility which can withstand using old tires would be a more environmentally
considerable differential settlement. The conscious method of consumption (Galaa, pers.
compressibility of the rubber mobilizes soil comm.).
movement above the conduit which reverses the A cheap and easy way to create the mixture in
Marston effect and causes positive arching action. developing countries is to fill whole tires with sand
The placement of such layers have to carefully or aggregates and lay them within the backfill or the
consider the possible settlements at ground surface. embankment. The technology of shredding tires
Then, it has been used behind retaining walls, and might not be readily available for small scale works,
in bridge approaches or road embankments [4–7]. or the quality control process might not be easily
Rubber soil mixture is considered a light and cheap applied to guarantee a uniform mix of natural soil
backfill which is easily and quickly constructed. and tire chips. In Egypt, in many situations backfill
Later on, due to the high vibration - absorption is hastily laid to support failing structures or
capacity and temperature isolation potential of the inadequate side support systems. There will be
rubber, the mixture has been used as earthquake- limited time to compact the sand properly but whole
resistant reinforcement [8] and as absorption tires can be used to reinforce the loose sand.
bearings underneath structures [9]. In other The whole tire soil mixture layer is often
situations, the mixture is used to improve the represented as a homogenous continuum in design
strength of fill and reinforce pavements [10–13]. procedures and numerical analyses. The equivalent
 Most importantly, using tires as the rubber stiffness of the layer can be assumed based on
component is considered a safe way to consume element tests on shredded rubber sand mixture with
non-biodegradable waste. The mixture could be a similar volume proportions [9]. Another approach
combination of natural soils and whole tires or is to study the embankment behavior if the
fragments of tires which could be even in the form embedded mixture layer is assigned a range of

 1
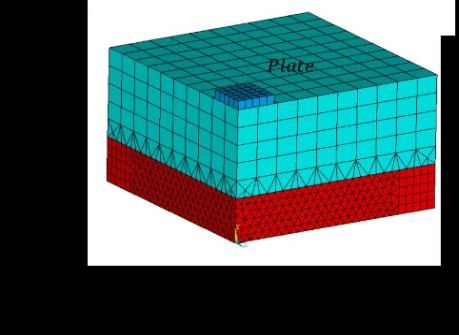
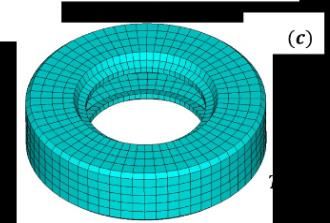
International Journal of GEOMATE, April., 2021, Vol.20, Issue 80, pp. 1-8

possible stiffness values [14]. A stiffness ranging also the model can be recreated in a laboratory large
from 10 MPa to 40 MPa is considered based on the scale test.
thickness of the embedded mixture layer. Fig. 2 shows the finite element mesh. The
 A design value for the stiffness and permeability contact behavior between tires and sand is
of the mixture is easily controlled when shredded represented by surface-to-surface contact elements.
tires are used. There is sufficient literature on the These elements are assigned in pairs for 3D surfaces,
engineering properties of these rubber soil mixtures where stiffer surfaces are considered the target
[15, 16]. On the other hand, defining mechanical (TARGE170) and more ductile surfaces are
properties of whole tires in the mixture poses two considered the contact (CONTA174). These
considerable challenges: elements are placed between the surfaces in contact
 • Assessing the stiffness of the mixture layer such that the geometry and node ordering is
 becomes impossible with element tests. The preserved. The sand is represented in the model
 layer must be tested in the field or large scale with the Mohr-Coulomb material model. This is the
 model tests. simplest constitutive model available and does not
 • The deformation mechanism of a whole tire accurately capture the non-linear behavior of the
 filled with sand is completely different from sand. However, this model would not add to the
 thoroughly mixed rubber and soil. The tire is complexity of the numerical analysis which is
 expected to confine the sand within an arching already burdened by several contact elements. Also,
 action around this unit prevents uniform the goal of the analysis is to investigate single
 distribution of the stress on top of the layer. An values of stiffness chosen for the mixture layer
 assumption to homogenize a whole soil-filled which can be used in hand calculations; hence, the
 tire is not straightforward. Mohr-coulomb model is sufficient.
 The paper presents simulations using the finite
element software ANSYS to compare between
realizing the actual shape of the tire and considering
the mixture as a uniform layer with one value for
stiffness. The paper presents the measured load
settlement measurements from a physical model of
several layers of tires embedded in loose sand filling
a steel tank, using plate load tests; and the back
analysis of stiffness using numerical analysis.
Finally, the paper discusses different analytical and
empirical methods to predict the mixture stiffness,
and the use of plate load test results to assess this
stiffness.

2. HOMOGENIZING SAND-TIRE
 Fig.1 Schematic diagram and boundary conditions
 MIXTURE
 of the finite element model.
 Three-dimensional simulations of a plate load
test are simulated using the general-purpose finite
element code ANSYS. A single layer of sand filled
tires is embedded in a body of the same sand. The
actual shape of the tire is manifested in the model
as shown in Fig. 1 using SOLID185 elements which
are 8-node brick elements with trilinear shape
functions for displacements and 3 degrees of
freedom at each node. The outer diameter of the tire
is 400mm and inner diameter is 200mm. The
thickness of the tire is 100mm and the wall
thickness is 10mm. This constitutes 36.7% of the
entire volume filled by the tire and the sand in it.
The sand is similarly represented by 3-D solid
elements (SOLID65) . The figure also shows the Fig.2 Finite element mesh: a) the combined
boundary conditions of the model due to symmetry components, b) the tire and the surrounding sand, c)
where only the quarter-space of the sand and tires is the 3D shape of the tire.
modeled. The dimensions to the other boundaries of
the model provide enough distance such that Table 1 lists the Mohr-Coulomb parameters
compression inside the model is not affected, and used to represent sand behavior. The rubber of the

 2
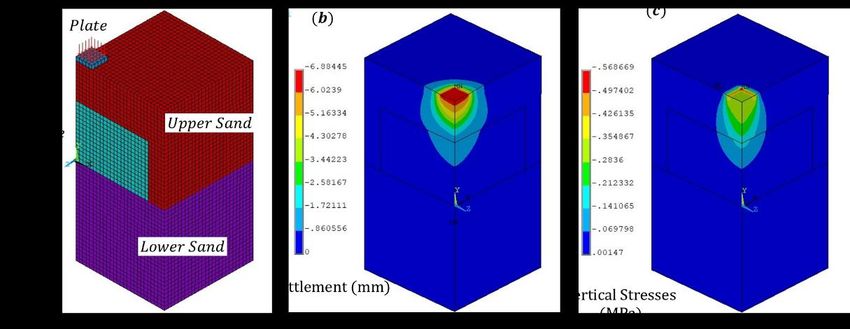
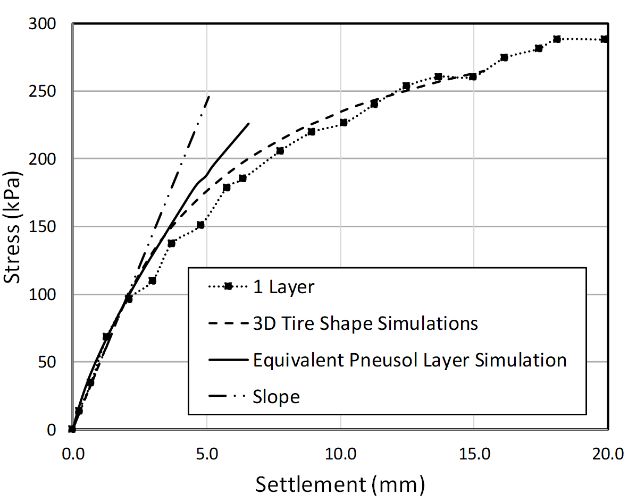
International Journal of GEOMATE, April., 2021, Vol.20, Issue 80, pp. 1-8 tire is represented by a linear elastic model where tests are performed to ensure a relative density of Young’s Modulus, E is 50 MPa, and Poisson’s ratio, 40% (E = 10 MPa, =300) which is consistent with ν is 0.45. Friction between sand and rubber is also non-compacted Giza Sand properties. The first modeled using the Coulomb relationship, where stage fills the bottom 500 mm of the tank. The sliding occurs when the shear stress exceeds the second stage places the tires and fills within and sliding resistance with coefficient, μ is 0.4. The around the tires, as shown in Fig. 4b. Four tires are values representing the tire and the sand are chosen laid side by side to a thickness of 100 mm. The from typical values for used car tires in Egypt and stiffness of the used tires is 50 MPa as considered loose sand often available in Giza, Egypt [17]. in the numerical analysis. The representation of the mixture layer as a A 200 mm x 200 mm square steel plate is placed homogenized body with a single value of stiffness on the sand and tire mixture as shown in Fig. 4c. is also recreated in the numerical simulation Then, the loads are applied via a system comprising considered as isotropic elastic material. This single a hydraulic jack and reaction and loading frame. stiffness value is determined by trial and error until Initially, a seating load of 0.35 kN for leveling. The the initial slope of the plate pressure settlement settlement of the plate is measured for each curve coincides with the observed in the detailed 3D increment of stress by two dial gauges with 0.01 analysis as shown in Fig. 3. The figure shows the mm accuracy. The dial gauges are attached to a steel variation of contact pressure beneath the plate and bar mounted on the tank sides to maintain a the plate settlement. The dimensions of the plate are horizontal position. The load is measured by a 200 mm x 200 mm which are the typical dimensions calibrated proving ring and the average of the dial of a loading plate in the market. This approach has gauge measurements gives the settlement. Hence, a been employed in using plate load tests to assess the plate pressure settlement curve in Fig. 3 is stiffness of constructed stone columns by numerical constructed for comparison. back analysis [18]. The results of a full-scale plate load test performed in the sand-filled tank with an actual single layer of a whole tire – loose sand mixture is included in the figure. The curve from the detailed numerical analysis (Tire - sand) agrees well with the one observed in the experiment verifying the numerical model conditions. The curve from the numerical analysis considering the equivalent layer matches the other curves in its initial slope when the equivalent Young’s modulus used is 15 MPa and Poisson’s ratio is 0.35. This value is higher than the range observed in element tests [16]. Table 1. Mohr-Coulomb Parameters for the sand material used in the analysis. Parameter Value Fig. 3. Comparison between the homogenized and Unit Weight, ( / ) 18 detailed simulation of whole tire sand mixture with experiment results. Cohesion, c (KPa) 0 Friction Angle, 33 Dilation Angle, 0 Young’s Modulus, E (MPa) 10 Poisson’s Ratio 0.3 The plate load tests are conducted in the Soil Mechanics and Foundations Research Laboratory of the Faculty of Engineering in Beni-Suef University, as shown in Fig. 4a. The whole analog tire – the loose sand mixture is set up in a steel tank with dimensions of 1000 mm x 1000 mm x 1000 mm. The tank is filled with siliceous sand in two stages only to preserve a loose structure. Sand cone Fig. 4. Laboratory set up for the plate load test experiments. 3
International Journal of GEOMATE, April., 2021, Vol.20, Issue 80, pp. 1-8

3. EFFECT OF HOMOGENIZED LAYER experimental setup for the multiple layers. The back
 THICKNESS analyses for the 2 and 3 tire layers results are done
 using only the homogenized representation in the
 Two more plate load test experiments are numerical model. Fig. 6 shows the back analyses for
performed to investigate the performance of two these results. The initial slopes match 2- and 3-
and three layers of tires on top of each other. Each layers curves at Young’s moduli, 20 MPa and 45
layer comprises four side by side tires as shown in MPa, respectively. The same Poisson’s ratio
Fig. 4b. Fig. 5 shows a schematic diagram of the (ν=0.35) is used in all the analyses.

Fig. 5. Schematic diagram of the lab set up for multiple layers (dimensions are in mm).

Fig. 6. Back analysis of the mixture layer stiffness for a) 2 layers of tires, and b) 3 layers of tires.

 Fig. 7 shows the finite element (FE) mesh at the plate edges. However, at relatively small
representing three layers of sand filled tires as a depths inside the sand, the stress distribution
homogenized body. The figure also shows the becomes uniform and propagates with an
contours of settlement and vertical stresses inside approximate slope of 2V:1H. The distribution of
the sand and the mixture layers. These distributions vertical deformations shows that most of the
are computed at a vertical plate pressure of 400 kPa. compression occurs in the top sand layer, and the
Directly underneath the plate, the stress distribution mixture layer exhibits a stiffer response.
is not uniform and shows high-stress concentrations The back analyzed stiffness values of the

 4
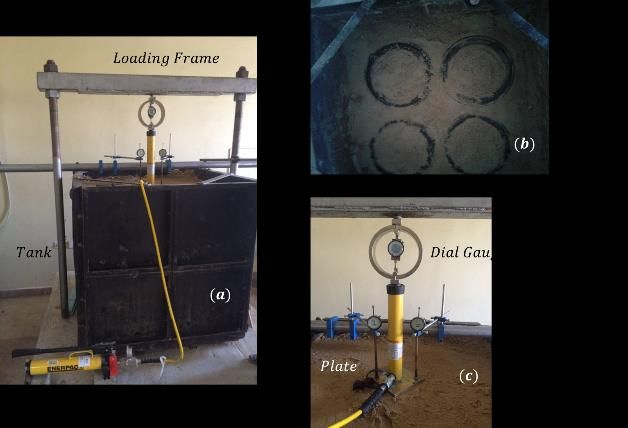
International Journal of GEOMATE, April., 2021, Vol.20, Issue 80, pp. 1-8

homogenized layer from numerical analysis are and isostrain cases, and the variation of the Voight
compared with those calculated using the averaging and Reuss average stiffnesses (EMix) with the
laws of the mixture. Research shows that the possible percentage of rubber tires (Ptire).
stiffness of a mixture of material ranges between the
isostress case (Reuss average of stiffness) and the = ∗ + ∗ ( − ) (1a)
isostrain case (Voight average of stiffness) [19, 20].
The isostrain case, where stiff and soft components
 = − (1b)
are equally strained, produces higher stiffness
 +

values as shown in Eq. 1a. The isostress case, where
stiff and soft components are subjected to equal
stresses, gives the lower bound of possible
stiffnesses. Fig. 8 shows schematics of the isostress

Fig. 7. Numerical analysis of homogenized mixture layer, a) FE mesh, b) Settlement contours, c) Vertical stress
distribution.

 Fig. 8. Values of back analyzed stiffness of the
homogenized layer compared with the isostress and
isostrain averages.

 In the experiments, the percentage of rubber to
sand in a single sand-filled whole car tire is 36.7 %.
This percentage does not change when more tires
are added laterally or vertically. Fig. 8 shows that
the Reuss average act as a lower bound to possible
values of the mixture stiffness. Fig. 9. Redistribution of vertical stresses around
 the tire.

 5
International Journal of GEOMATE, April., 2021, Vol.20, Issue 80, pp. 1-8

 However, the increase in tire layers leads to an In this scenario, the stiffness of the strong layer,
increase in the mixture stiffness even beyond the E2 is a representative value of the rubber tire and the
Voight average (the typical upper bound). The sand confined within. By trial and error, an
logical explanation for this is when the mixture appropriate value of E2 is chosen so that the slope,
thickness increases, and the distance between the ΔP/S matches the initial slope observed in the
mixture and the plate decreases, the mechanism experiments. Table 2 shows the E2 values that when
departs from both isostress and isostrain cases. The used in the above equations similar slopes to those
bodies of the tires attract more stresses without indicated in Fig. 3 and Fig. 6 are produced. The
being constrained with the same strains as the sand. values are close to those back analyzed from
 Fig. 9 is an excerpt of the vertical distribution in numerical analysis with a difference of ±5 MPa.
the numerical model realizing the actual shape of
the tire. The contour lines show that the edge of the
tire is loaded with higher stresses (approximately 3
times) than the surrounding area where only sand
exists. This arching action voids our ability to use
the typical average laws to calculate mixture
stiffness.

4. STIFFNESS OF THE MIXTURE
 Fig. 10. A schematic diagram showing the a) actual,
 A single value of stiffness representing a
 and b) modified dimensions of the double layer
homogenized mixture of sand and whole tires
 system.
cannot be inferred from theoretical methods or
using the element tests in the literature. A plate load
test can be easily and quickly applied in the field, Table 2. Values of mixture stiffness back analyzed
but the 3D numerical analyses needed for the back from numerical analyses and calculated from the
analysis of its results is cumbersome and not equivalent thickness method.
regularly available. Hand calculation methods
typically used to investigate the load-settlement Number Numerical Back Equivalent
performance of improved grounds [21] can be used of Layers Analysis Thickness Method
to interpret plate load test results instead. One of the (MPa) (MPa)
most important methods to analyze a double layer
system where a weak layer is underlain with a 1 15 20
stronger one is the equivalent thickness method [22].
 2 20 25
This method is a suitable representation for the
considered case herein where the loose sand is 3 45 40
reinforced with tires of rubber at a certain depth
from the surface subjected to the plate load. As
presented in Fig. 10, an equivalent thickness for the
top weak layer, H1e is calculated as a function of the In order to come up with a method to give a first-
Young’s Modulus and Poisson’s ratio of the weak order value for the mixture stiffness before
Layer (E1 and ν1), and of the strong layer (E2 and ν2) construction, the results of the aforementioned plate
as in Eq. 2. load tests are used in a curve fitting process. This
 1
 empirical correlation computes the mixture stiffness
 1 (1− 22 ) 3
 1 = ( ) (2) from numerical and semi-analytical back analyzed
 2 (1− 12 )
 values. Eq. 4a is an exponential relationship
 The relationship between plate contact stress, between the EMIX-Ratio and H, the normalized
ΔP, and settlement, S can be calculated using Eq. 3. thickness of the mixture layer (H = thickness/depth
An approximate method assumes that stress of the layer). The R2 correlation factor is 0.9997,
propagates through both layers with the same slope and the EMIX_Ratio is defined in Eq. 4b. The
(1V:2H) after modifying the thickness of the weak relationship is a clear exponential one indicating the
layer as shown in Eq. 3a [21]. The equivalent combined effect of increasing thickness and a
pressure causing both layers to compress, ΔPe is that decreasing distance between mixture and load
acting at the middle of the layer with modified (weak layer thickness).
dimensions (Eq. 3b) as also shown in Fig. 10.
 1 _ = 0.1413 1.1693 (4a)
 = Δ ( 2 + 1 ) (3a) −
 2 _ = (4b)
 Δ −
 Δ = + (3b)
 +( 1 2 )
 2

 6
International Journal of GEOMATE, April., 2021, Vol.20, Issue 80, pp. 1-8

 the load is decreased. An empirical correlation
 between mixture stiffness and normalized
 thickness is proposed to help designers
 determine first order stiffness values before
 using plate load tests.

 6. REFERENCES

 [1] Jean, P. A., & Long, N. T., “Creation of arching,
 pneusol and other techniques.”, In Proceedings
 of the International Conference on
 Instrumentation of Geotechnical Engineering,
 (Geotechnical Instrumentation in Practice,
 Purpose, Performance and Interpretation) (pp.
 663–670) 1990.
Fig. 11 Predicting mixture layer equivalent stiffness [2] Long, N. T., "Utilization of used tyres in civil
from its thickness and depth. engineering-the Pneusol’Tyresoil", In
 Proceedings of the Second International
5. CONCLUSIONS Congress on Environmental Geotechnics,
 Osaka, Japan. (pp. 5–8) 1996.
 In developing countries, whole tires rather than [3] Akl, A., Rahman, A., & Hosny, H., “Structural
processed rubber are mixed with sand to create assessment of cracked large diameter sewer
cheap and quick backfill. This backfill can be used pipes: Proc 2nd International Conference on
in many applications starting from quickly Foundations and Tunnels, London, 19–21
supporting and excessively deforming side support September 1989 V2, P189-194. Publ
systems to vibration absorbents around sensitive Edinburgh: Engineering Technics Press, 1989.",
structures. Typically, the numerical analysis Journal of Rock Mechanics and Mining
considers the mixture as a homogenized body and Sciences and Geomechanics Abstracts, Vol. 28,
assigns stiffness values based on an existing No. 6, pp. A360, 1991.
database of element tests. This paper presents a set [4] Lee, J. H., Salgado, R., Bernal, A., & Lovell, C.
of numerical and physical experiments using plate W., "Shredded tires and rubber-sand as
load tests on whole tire loose sand mixtures from lightweight backfill", Journal of Geotechnical
which the following conclusions are drawn: and Geoenvironmental Engineering, Vol. 125,
a. A simple plate load test can be used to interpret No. 2, pp. 132–141, 1999.
 a representative stiffness of the whole tire sand [5] Humphrey, D., "Tire derived aggregate as
 mixture. An approximate method is proposed lightweight fill for embankments and retaining
 using the equivalent thickness method and an walls", In Proceedings of the International
 average distribution of stresses to interpret plate Workshop on Scrap Tire Derived
 load test results. The mixture layer stiffness is Geomaterials–Opportunities and Challenges,
 inferred with acceptable accuracy when Yokosuka (pp. 59–81) 2007.
 compared with advanced 3D numerical [6] Youwai, S., & Bergado, D., "Numerical
 simulations. analysis of reinforced wall using rubber tire
b. Using a uniform homogenized layer to represent chips–sand mixtures as backfill material",
 the whole tire sand mixture gives the same initial Computers and Geotechnics, Vol. 31, No. 2, pp.
 stiffness in the linear portion of the load 103–114, 2004.
 settlement curve. At large values of [7] Bosscher, P. J., Edil, T. B., & Kuraoka, S.,
 deformations, a single value of stiffness cannot "Design of highway embankments using tire
 be assessed because of the possible plastic chips", Journal of Geotechnical Engineering,
 strains computed in the model. Vol. 123, No. 4, pp. 295–304, 1997.
c. Results from FE analyses show that contact [8] Hazarika, H., Sugano, T., Kikuchi1, Y.,
 stresses directly beneath the loading plate is Yasuhara, K., Murakami2, S., Takeichi, H., …
 irregular. However, the stresses become uniform Mitarai, Y., "Flexibility and Stability
 and propagate with a slope (2V:1H) similar to Enhancement of Structures during Earthquakes
 the assumption used in the approximate methods. using a Novel Geosynthetic Material",
d. The isostrain average stiffness is considered a Engineering Geosynthetics Journal, Vol. 21, pp.
 lower bound value for the mixture layer. 125–130, 2006.
 However, the arching around tire edges lead to [9] Tsang, H. H., "Seismic isolation by rubber-soil
 an exponential increase in mixture stiffness mixtures for developing countries", Earthquake
 when the thickness is increased and depth from

 7
International Journal of GEOMATE, April., 2021, Vol.20, Issue 80, pp. 1-8

 Engineering and Structural Dynamics, Vol. 37, Geotechnical Testing Journal, Vol. 17, No. 4, pp.
 No. 2, pp. 283–303, 2008. 453–464, 1994.
[10] Kikuchi, Y., Nagatome, T., & Mitarai, Y., [16] Masad, E., Taha, R., Ho, C., & Papagiannakis,
 "Engineering property evaluation of cement T., “Engineering properties of tire/soil mixtures
 treated soil with tire chips using X-ray CT as a lightweight fill material”, Geotechnical
 scanner", In 5th ICEG Environmental Testing Journal, Vol. 19, No. 3, pp. 297–304,
 Geotechnics: Opportunities, Challenges and 1996.
 Responsibilities for Environmental [17] Akl, S. A. Y., "Dynamic Characterization of
 Geotechnics: Proceedings of the ISSMGE’s Giza Sand Using The Resonant Column
 fifth international congress organized by the Device."Cairo University, 2005.
 Geoenvironmental Research Centre, Cardiff [18] Fatahi, B., Basack, S., Premananda, S., &
 University and held at Ca 2006. Khabbaz, H., "Settlement prediction and back
[11] Mitarai, Y., Yasuhara, K., & Kikuchi, Y., analysis of young’s modulus and dilation angle
 "Application of the cement treated clay with of stone columns", Australian Journal of Civil
 added tire chips to the sealing materials of Engineering, Vol. 10, No. 1, pp. 67–80, 2012.
 coastal waste disposal site", In 5th ICEG [19] Sone, H., & Zoback, M. D., "Mechanical
 Environmental Geotechnics: Opportunities, properties of shale-gas reservoir rocks - Part 1:
 Challenges and Responsibilities for Static and dynamic elastic properties and
 Environmental Geotechnics: Proceedings of the anisotropy", Geophysics, Vol. 78, No. 5, pp.
 ISSMGE’s fifth international congress D381–D392, 2013.
 organized by the Geoenvironmental Research [20] Sone, H., & Zoback, M. D., "Mechanical
 Centre, Cardiff University 2006. properties of shale-gas reservoir rocks — Part 2:
[12] Abdesssemed, M., Kenai, S., & Bali, A., Ductile creep, brittle strength, and their relation
 "Experimental and numerical analysis of the to the elastic modulus", Geophysics, Vol. 78,
 behavior of an airport pavement reinforced by No. 5, pp. D393–D402, 2013.
 geogrids", Construction and Building Materials, [21] Hirai, H., "Settlements and stresses of multi-
 Vol. 94, pp. 547–554, 2015. layered grounds and improved grounds by
[13] Gu, F., Luo, X., Luo, R., Lytton, R. L., Hajj, E. equivalent elastic method", International
 Y., & Siddharthan, R. V., "Numerical modeling Journal for Numerical and Analytical Methods
 of geogrid-reinforced flexible pavement and in Geomechanics, Vol. 32, pp. 523–557, 2008.
 corresponding validation using large-scale tank [22] Palmer, L. A., & Barber, E. S., "Soil
 test", Construction and Building Materials, Vol. displacement under a loaded circular area",
 122, pp. 214–230, 2016. Proceedings of the Highway Research Board,
[14] Akl, S. A., & Metwally, K. G., "Optimizing Vol. 20, pp. 279–286, 1940.
 arching creation for Abou Muharik Tunnel in
 Egypt using numerical analysis", KSCE Copyright © Int. J. of GEOMATE. All rights reserved,
 Journal of Civil Engineering, Vol. 21, No. 1, pp. including the making of copies unless permission is
 160–167, 2017. obtained from the copyright proprietors.
 [15] Edil, T., & Bosscher, P., "Engineering
 Properties of Tire Chips and Soil Mixtures",

 8
You can also read