Forest Glen / Montgomery Hills Market Analysis - September 4, 2018
←
→
Page content transcription
If your browser does not render page correctly, please read the page content below
Forest Glen / Montgomery Hills
        Market Analysis

         September 4, 2018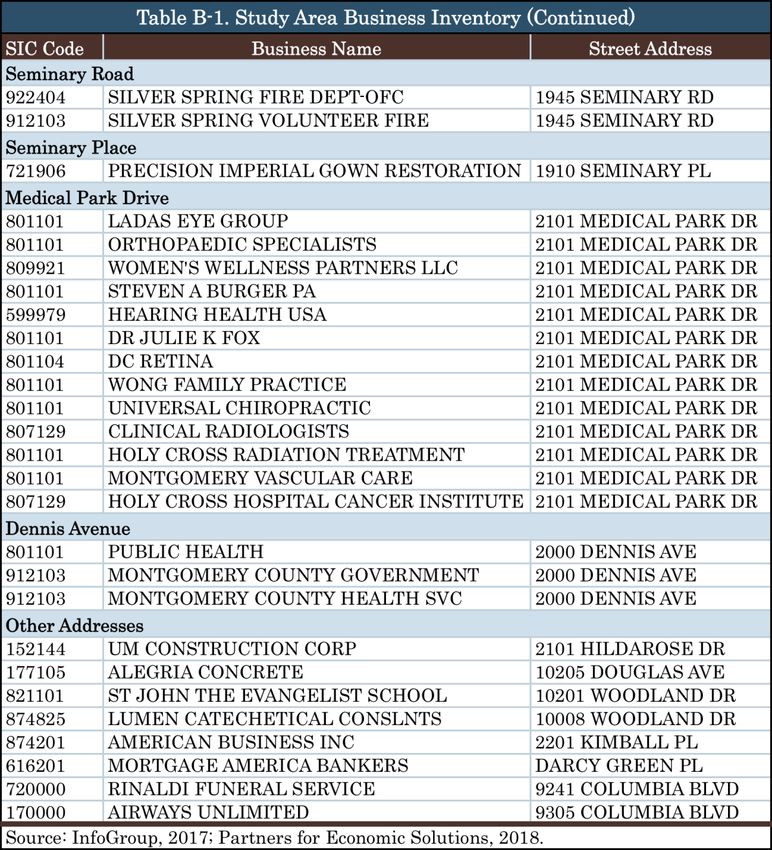
Contents
Executive Summary .............................................................................................................. iii
I. Introduction ....................................................................................................................... 1
   Planning Framework ......................................................................................................................1
   Report Organization .......................................................................................................................3
II. Existing Conditions Assessment ......................................................................................... 5
   Land Use Profile .............................................................................................................................5
   Stakeholder Input ..........................................................................................................................6
   Demographic Profile.......................................................................................................................7
III. Commercial Market Potential ......................................................................................... 13
   Retail Market ............................................................................................................................... 13
   Office Market ............................................................................................................................... 19
IV. Residential Market Potential .......................................................................................... 24
   Rental Housing ............................................................................................................................. 24
   For-Sale Housing .......................................................................................................................... 27
   Senior Housing ............................................................................................................................. 28
   Residential Conclusions ................................................................................................................ 29
V. SWOC Analysis ................................................................................................................ 32
   Strengths ..................................................................................................................................... 32
   Weaknesses ................................................................................................................................. 33
   Opportunities............................................................................................................................... 33
   Challenges ................................................................................................................................... 34
VI. Opportunity Analysis ...................................................................................................... 35
   Dynamic Shifts in the Marketplace................................................................................................ 35
   Constraints on Redevelopment ..................................................................................................... 41
   Opportunity Site Development Scenarios...................................................................................... 42
VII. Recommended Strategies .............................................................................................. 50
   Land Use and Regulatory Changes ................................................................................................ 50
   Public Investment ........................................................................................................................ 50
   Economic Incentives ..................................................................................................................... 51
   Business Support .......................................................................................................................... 51

                                                                         i
Appendices
 Appendix A- Stakeholder Feedback Overall Themes
 Appendix B. Business Inventory
 Appendix C. Data Tables
 Appendix D. Real Estate Trends Tables

                                             ii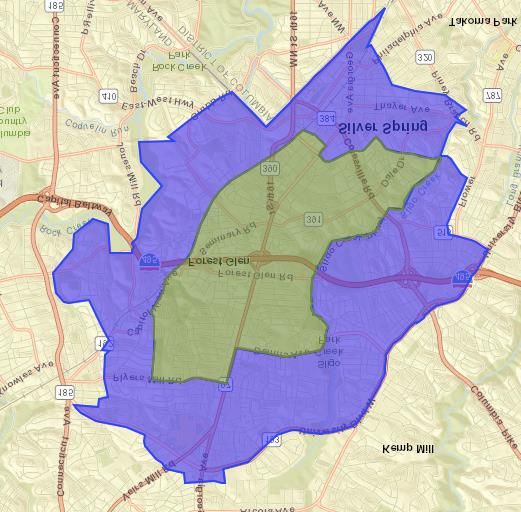
Executive Summary

The Forest Glen/Montgomery Hills Study Area, which incorporates frontage properties
along Georgia Avenue from the northern edge of Downtown Silver Spring to Dennis
Avenue, comprises a range of strip commercial and office uses. The surrounding
neighborhoods (the Primary Market Area (PMA) include a mix of single-family houses,
townhouses, condominiums and apartments that benefit from access to one of the county’s
primary thoroughfares, the Forest Glen Metro station and the Beltway (I-495). Compared
to countywide residents, PMA residents are slightly older, living in somewhat smaller
households with higher incomes, slightly less likely to own their homes, and much more
focused in white-collar professions.

Holy Cross Hospital provides an important anchor for economic activity. The Study Area
has an estimated 6,800 employees in addition to roughly 4,300 staff at Holy Cross. As of
the time of this report, the Study Area includes 176 businesses with 46 percent in offices
(primarily healthcare providers), 38 percent providing personal and business services and
16 percent retailers, including 16 restaurants.

The State Highway Administration (SHA) is evaluating alternative packages of
improvements to reduce traffic conflicts and improve traffic flow while greatly enhancing
provisions for pedestrians and bicyclists. Current plans include wider sidewalks, a cycle
track, a pedestrian underpass to create a second Metro station entrance on the east side of
Georgia Avenue, better crosswalks, upgraded pedestrian lighting and other streetscape
improvements.

Commercial Market Conditions and Potentials

Montgomery Hills is most competitive for convenience/neighborhood retail (e.g., grocery
stores and drugstores), restaurants and local services. It lacks the critical mass of stores to
compete for shoppers goods retailers, those that sell apparel, furniture, home furnishings
and other goods typically sold in department stores. The recent replacement of Staples
with Aldi’s provides a strong draw for area customers, and Snider’s Super Foods has a loyal
customer base. Area restaurants offer a variety of ethnic cuisines as well as pizza,
delicatessen fare, bagels and ice cream. Some of the businesses are in aging buildings that
could use physical upgrades to better meet the needs of modern retailers. However, there
are few vacancies.

Given the vast array of competitive retailers from Downtown Silver Spring to Westfield
Wheaton shopping center, market area residents seem able to meet most of their shopping
needs through existing retailers. Unmet demand that might be available to new Study
Area retailers include a small pharmacy or wellness retail operation and a fast casual
restaurant. Accommodating a fast casual restaurant would be difficult today given the lack

                                              iii
of frontage properties with sufficient land to provide the vast amounts of parking required
by such operations.

On-line retailing, over-leveraged retail chains with excessive debt levels and changing
consumer tastes are disrupting traditional retailing. Introduction of self-driving vehicles
will further facilitate home delivery, probably accelerating the move to on-line retailing. In
the midst of these shifts, the most successful bricks-and-mortar retail stores are those that
can provide convenience, customer service and/or an experience not available on-line.
Eating and drinking places have a particular advantage in today’s retail world.

The Study Area office market is dominated by medical office space attracted by Holy Cross
Hospital’s presence. The 16 office buildings with 198,000 square feet of space were built
almost exclusively prior to 1970 with a few renovated or built in the late 1970s or early
1980s. In spite of the aging stock, vacancy rates are quite low. Nationally, physicians are
shifting from independent practices to working directly for hospitals or other major
healthcare organizations, reducing the demand for space in independent medical office
buildings, which may require a re-purposing of some of the existing medical office space
over time. New models emphasize clinics and wellness centers focused on preventative
healthcare.

Other office tenants in the Study Area tend to focus on neighborhood services such as
insurance and real estate agents. The non-medical office space is leased on the strength of
its accessibility and low rents; some owners are reporting challenges in filling vacancies due
to the condition of some of the older commercial structures and the lack of dedicated
parking. Technology is allowing some local-population-serving businesses to operate
without traditional office space, somewhat reducing the office demand.

There is limited opportunity for new office space in the Study Area. The one potential
would be for a small co-working space where tenants share access to conference rooms,
office equipment and other technology.

Residential Market Conditions and Potentials

Though focused on commercial properties, this analysis also considered residential
development opportunities due to the drive toward mixed-use development. The wider
market area that includes both Downtown Silver Spring and Downtown Wheaton have
shown rapid development of multi-family apartments over the past decade, adding 1,757
new units in 2014 alone. Absorption/occupancy of the apartment stock has kept pace with
new construction, evidencing the demand for well-located apartments with access to Metro
stations. Opportunities exist for new rental housing, including accessory dwelling units
developed on lots with existing single-family houses. Development of new for-sale housing
has been more limited, due primarily to the lack of developable sites. The rapid price

                                              iv
escalation among existing units demonstrates the strong demand for ownership housing.
Future market potentials are summarized in the following table.

                              Residential Demand, 2017-2037
                                               Near-Term       Long-Term
                                               2018-2027       2028-2037
                    For-Sale
                    Single-family attached             275             250
                    Condominiums                        75               50
                      Subtotal                         350             300
                    Rental
                    Apartments                         450             350
                    Age-restricted units               250             300
                    Accessory units                     50               50
                      Subtotal                         750             700
                         Total                       1,100           1,000
                    Note: Production may be constrained by site availability.
                    Source: Partners for Economic Solutions, 2018.

Development Opportunities

The proposed SHA roadway, pedestrian and bicycling infrastructure improvements would
greatly enhance the public realm, providing a setting for mixed-use development. Land and
building acquisitions to allow right-of-way expansion may disrupt four properties, creating
redevelopment opportunities. The right-of-way widening also may significantly impact
existing businesses by taking away storefront parking that they depend on for attracting
convenience shoppers. Business owners expressed concerns that the loss of parking could
force them to relocate or close, particularly in the west side of the 9300 block of Georgia
Avenue, but also in the Tudor-style shopping center at Seminary Road and on the east side
of the 9400 block of Georgia Avenue. Mitigation strategies will be needed to support these
businesses.

The shifts in retail and office markets would suggest long-term redevelopment
opportunities; however, there are many reasons why property owners may not consider
redevelopment in the near to mid term:

    •   site constraints, including shallow frontage lots;
    •   the high costs of new development;
    •   the opportunity costs of lost rent in tearing down existing leased buildings;
    •   the owners’ appetite to take on the multitude of development risks;
    •   lack of development expertise and financial resources; and

                                               v
•    a difficult development approvals process that lacks certainty and predictability.

Though old and not suited to the needs of modern retailers, several of the area’s older
buildings still have viable uses and additional useful life before they will be redevelopment
candidates.

In the near term, the best redevelopment candidates are:

   •       the Forest Glen Metro station, which could be redeveloped for 300 to 400 residential
           apartments at a much higher density than current zoning allows in order to fund
           replacement of commuter parking; and
   •       9801 Georgia Avenue, the Forest Glen Medical Center, which could be replaced with
           various combinations of ground floor retail, residential, a modest amount of office,
           and quality open space/common areas or dense townhouse or multi-family
           residential development.

In the longer run—and assuming implementation of the SHA plan— redevelopment
opportunities could include the east side of the 9500 block of Georgia Avenue if the right-of-
way widening requires taking the existing office building, and the Seminary Road
properties, including Snider’s Super Foods and possibly other properties in the adjacent
Tudor-style shopping center depending on future shifts in retailing. The 9500 block would
be suitable for a three- to four-story apartment building or possibly a single-tenant office
building.

Recommended Strategies

Strategies recommended to encourage private reinvestment and a transition to more
sustainable mixed-use development in a pedestrian-friendly environment include:

   •       re-zoning of key opportunity sites for greater density to take advantage of Metro
           accessibility;
   •       public investments in public realm improvements led by the SHA transportation
           upgrades;
   •       low-interest loans and small grants for architectural services to incentivize façade
           improvements;
   •       small business technical assistance;
   •       construction-period strategies to support local businesses during the SHA
           construction; and
   •       marketing and advocacy efforts undertaken by a business association and nearby
           residents.

                                                 vi
I. Introduction
The Montgomery County Planning Department is embarking on a detailed plan for the
Forest Glen/Montgomery Hills portion of the Georgia Avenue corridor. This market
analysis is intended to inform that planning process as to market conditions, future
prospects, real estate opportunities and economic issues facing area stakeholders.
Planning Framework
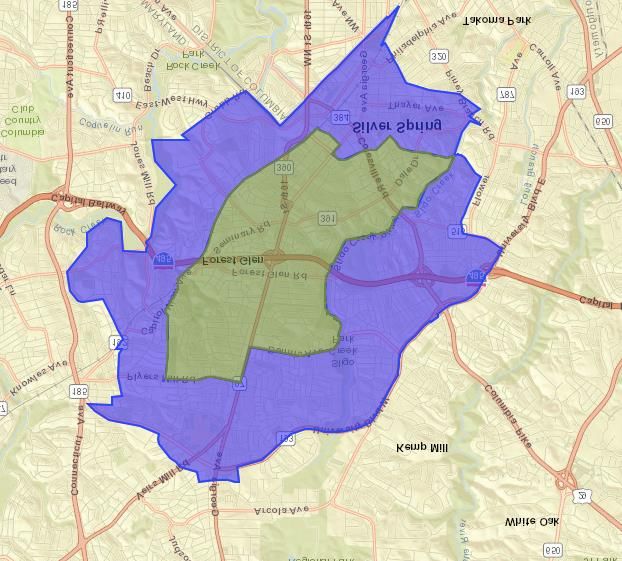
The Study Area incorporates primarily frontage properties extending 2.1 miles along
Georgia Avenue (MD 97) from Spring Street on the northern edge of Downtown Silver
Spring to Dennis Avenue in Wheaton (Map 1).
MapForest
1. Forest
Glen / Glen / Montgomery
Montgomery Hills Sector Plan
Hills Sector Plan
Georg
ia
Aven
Evans Drive Dennis Avenue
ue
495
Forest Glen Road
495
Roc
Se
k
m
in
ar
d
y
Blv
Creek
Road
bia
um
Linden Lane l
Co
Highland
D ri
ve
ad
Ro
CS
d
X
Roa
le
Ra
vil
ilro
ok
ad
16th
Bro
sville
Cole
Ge
o
rg
re e
St
t
ia
Av
en
ue
Parkland
Sector Plan Boundary
The southern portion of the corridor – between Spring Street and 16th Street – is primarily
residential and institutional. North from the 16th Street intersection to the Capital Beltway
0 1500'
(I-495), the corridor is dominated by neighborhood- and auto-oriented retail and office
1
development with a relatively new townhouse development in the southwest quadrant of
the Beltway interchange. North of the Beltway are the Forest Glen Metro station with a
Park-and-Ride lot and residential development along the west side. The east side includes
five medical office buildings and four churches. Although outside of the Study Area, Holy
Cross Hospital is a large employer located five blocks to the east on Forest Glen Road.

To date, the corridor has been shaped almost exclusively to meet the needs of automotive
traffic. MD 97 is one of the county’s most heavily traveled major highways, linking Olney,
Glenmont and Wheaton to Silver Spring and the District of Columbia. Carrying over
70,000 vehicles per day, the corridor is a major commuting route. Accommodating the
heavy volume of traffic entering and exiting the Beltway generates significant weaving and
the potential for multiple accidents. The Beltway ramps accessed from northbound and
southbound Georgia Avenue generate significant back-ups and conflicts. Left turns are
restricted on Georgia Avenue during rush hours, creating inconveniences for shoppers and
other patrons of local businesses.

Roadway Improvement Plans
The North and West Silver Spring Master Plan (2000) and the Forest Glen Sector Plan
(1996) both adopted vision statements that called for conversion of Georgia Avenue to “a
landscaped urban boulevard with a center median and wide, unobstructed, tree-lined
sidewalks.” The Maryland State Highway Administration (SHA) is currently analyzing
potential design alternatives to create a better sense of place for Montgomery Hills while
enhancing, pedestrian and bicyclist mobility and safety.

SHA presented multiple alignments and cross sections to the community and the Planning
Board. The response was to prioritize pedestrian comfort and safety over vehicular
throughput. The preferred alternative to the Planning Board (5b) includes four travel lanes
southbound, three to four travel lanes northbound and a 17-foot-wide grass median to
replace the existing reversible center turn lane. See SHA information on the following link:
http://apps.roads.maryland.gov/WebProjectLifeCycle/ProjectInformation.aspx?projectno=M
O2242115

Wider sidewalks on both sides of Georgia Avenue and a new signal at Flora Lane would
better accommodate bicyclists and pedestrians. Left turns would be included at four
intersections. The ramp to southbound 16th Street would shift south to the signalized
intersection with northbound 16th Street. Sidewalks would be provided on both sides of
Georgia Avenue. The preferred alternative presented to the Planning Board estimated
impacts to businesses on either side, which could affect available street and on-site parking,
gas station pumps and existing buildings.

                                              2
In 2016, the Montgomery County Planning Department recommended and the Planning
Board demonstrated support for Alternative 5b with some additional suggestions including
the following: a new traffic signal at Flora Lane; a two-way separated bike lane on the west
side of Georgia Avenue; a 10-foot shared-use path on Forest Glen Road, the Forest Glen
pedestrian tunnel under Georgia Avenue, and aesthetic upgrades to the infrastructure.
Conceptually, this alternative could include dislocation of five buildings, including an office
building at Flora Lane, three gas stations and a car wash. The Planning Board selected
this as the preferred alternative, but the State Highway Administration continues to review
all alternatives and has not selected a preferred alternative. On-going planning efforts are
considering ways to reduce the alternative’s impacts on existing businesses. Also impacted
in Alternative 5b would be on-street parking spaces along the east side of the 9400 block of
Georgia Avenue in front of Silver Spring Jewelry and La Casa del Mofongo. The property
acquisitions, coupled with the upgraded appearance and performance of the roadway and
public realm, may offer the opportunity for long-term redevelopment of portions of existing
structures.
Urban Design Framework
The Georgia Avenue Study: An Urban Design Framework (2008) reviewed the full length of
Georgia Avenue to provide a cohesive urban design approach and strategy. The study calls
for 1) focusing major growth at Metro station areas, 2) reinforcing the corridor as a housing
resource, 3) focusing on transit and non-motorized mobility, and 4) creating an attractive
green boulevard through design excellence and sustainability. Concentrating development
near the Metro stations allows the interstitial areas to remain healthy residential
communities that provide a clear edge and separation between mixed-use centers.
Report Organization
This analysis explores the market support for existing and future land uses to provide
guidance to the Sector Plan. Coupled with detailed review of study area properties and
discussions with business and property owners, this analysis forms the basis for land use
concepts and implementation strategies.
The remainder of the report is organized in five sections:
• Existing conditions, including an inventory and evaluation of existing businesses
and land uses in the corridor as well as an evaluation of existing land use conditions;
• Commercial market conditions and potential by land use;
3• Residential market conditions and potentials;
• Strengths, Weaknesses, Opportunities and Challenges (SWOC);
• Opportunities analysis for new development/redevelopment in the study area;
• Strategies and recommendations for redevelopment, preservation and growth.
4II. Existing Conditions Assessment
The Study Area encompasses 229 acres within two central communities: Montgomery Hills
and Forest Glen. Montgomery Hills and Forest Glen residential communities consist of
strong, affluent single-family neighborhoods with a few higher-density apartment
complexes north of the Beltway. These two communities, separated by the Beltway,
consist of several commercial nodes of activity serving many local residents and drawing
customers from other sections of Montgomery County and beyond.
Land Use Profile
The Montgomery Hills storefronts are near full occupancy with many long-time businesses.
These highly visible commercial properties include multiple owners on small, shallow
parcels with space not currently configured for modern retailing. Many of the commercial
properties were constructed in the 1960s and 1970s with varying degrees of reinvestment
and renovation. Properties along the eastern side of Georgia Avenue south of the Beltway,
struggle with inadequate parking for customers and users. Western Georgia Avenue
businesses battle with traffic congestion due to backups and left-turn restrictions.
Both Montgomery Hills and Forest Glen offer competitive locations for businesses along
Georgia Avenue. At the time of this report, the roughly 176 businesses consist of 46 percent
office space users (including 42 percent in healthcare), 38 percent or 62 service businesses
and the remaining businesses include general retail with 16 restaurants (inventory in
Appendix A). The established base of businesses south of the Beltway in Montgomery Hills
include Snider’s, Goldberg’s Bagels, Woodside Deli, Tropical Ice Cream and Mayflower.
Chain retailers include CVS, Armand’s Chicago Pizzeria, and several auto-oriented gas /
service stations. As would be expected, businesses providing day-to-day services are the
area’s mainstay, consisting of Citibank, five dry cleaners, UPS, six hair/nail salons and two
beer and wine stores. In total, Study Area businesses employ 1,400 workers with the
majority (53 percent) in the healthcare industry1. Some of the stores could benefit from
new signage and/or façade upgrades.
Holy Cross Hospital has a major influence in the Forest Glen community, occupying not
only a 14-acre campus but also satellite operations. The hospital employs roughly 4,300
staff with a total of 1,575 community-based physicians throughout Montgomery County.
Within the Forest Glen community, Holy Cross’s presence includes the hospital, physician
1 Source: Quarterly Census of Employment and Wage data for 2017.
5office building, radiation treatment center and community resource center. This large
institutional anchor has led to a clustering of approximately 80 medical and other health-
related businesses.
Access to reliable and frequent transit service creates an asset many communities use to
transform market dynamics. For the Forest Glen community, the more limited impact of
the eight-acre Metro station reflects the hidden nature of the station, lack of good
pedestrian connections, impact of the nearby Beltway and limited supply of nearby land for
new development. The Forest Glen Metro station is nestled into a residential community
with minimal visibility from Georgia Avenue. Data from WMATA shows lower than typical
daily usage with average daily ridership estimates of 2,181 and only 80 percent utilization
of the roughly 600 parking spaces.
The high volume of traffic along Georgia Avenue provides visibility for businesses from
drive-by commuters, but the road width and traffic speed impede local pedestrian and
bicycle access to shopping and service operators. The public realm is relatively harsh and
sterile with narrow sidewalks and utility poles interfering with pedestrian and bicycle
movements. The Beltway bifurcates the neighborhood with some pedestrians reluctant to
use the existing walkway under the Beltway.
Stakeholder Input
PES reached out to nearly two dozen property and business owners along the Montgomery
Hills / Forest Glen corridor to engage the business community and understand specific
concerns about existing conditions. PES discussed customer base, tenancy trends, general
business climate, potential for future investment and proposed public sector improvements
incorporating State Highway Administration plans. This outreach included a series of face-
to-face interviews with business operators at their business location, telephone interviews
and email exchanges. These businesses included the retail and service sectors: restaurants,
neighborhood goods, shoppers goods, personal and business service providers. A cross
section of property owners responded to outreach efforts, offering another perspective on
the business environment.
In general stakeholders reported a stable business environment with high visibility and
accessibility as the critical site selection criteria. Property owners detailed concerns about
parking constraints impacting leasing potential for both first floor retail and second floor
commercial use. Business and property owners along the east side of Georgia Avenue used
the alley access for loading as well as employee parking when available and reported less
concerns about congestion. Along the west side of Georgia Avenue this feedback suggested
6more concerns with morning commuter and off-peak traffic and access to properties.
Finally, all restaurants reported local patronage as well as regional patrons.
Demographic Profile
In considering the demographics of nearby residents, the analysis focuses on two areas: the
immediately surrounding neighborhoods – the Primary Market Area (PMA); and the
Secondary Market Area (SMA) – the next ring of neighborhoods (shown on Map 2). The
demographic profile provides relevant information for the
residential and commercial analysis. The Primary Market Area Meleket owner- Abe Bayu
residents represent between 40 to 60 percent of the corridor’s “Our customers come from as
business base, depending on the type of business. While pass-by far away as Virginia and from
traffic delivers customers to several auto-oriented businesses, a few blocks away in the
most of the retailers interviewed for this analysis point to the neighborhood.”
nearby neighborhoods as their primary customer base. These residents have relatively
easy access to the corridor’s businesses, often using local roads to avoid Georgia Avenue’s
congestion. It should be noted that some businesses cater more to drive-thru traffic (gas
stations, car washes, etc.) while many of the food and beverage providers attract regional
and local customers. Those businesses able to attract from a larger trade area may have
higher sales per square foot and longevity in the marketplace. Shown on Map 1, the
market area boundaries are defined by drive times of less than 10 minutes, access routes
and neighborhood/Census tract boundaries.
7Map 2. Primary and Secondary Market Area
LEGEND
Primary Market Area
Secondary Market Area
The SMA includes neighborhoods beyond the PMA that also provide retail and service
customers to study area businesses but at a lower rate. SMA boundaries are influenced by
drive times and the geographic patterns of competitive retail and business districts. These
neighborhoods’ proximity to other commercial centers makes the residents more likely to
split their patronage between study area businesses and other competitors. The SMA is
limited in its reach to the north and west by the presence of major retail centers in
Wheaton and Bethesda.
8Average Annual Popula on Growth
Rates, 2000-2017
2.0%
Average Annual Change
1.5%
1.0%
0.5%
0.0%
Primary Secondary Montgomery Metro Area
Market Area Market Area County
2000-2010 2010-2017
The PMA encompasses just under 21,000 residents in 8,600 households2; another 55,600
residents inhabit the SMA in 23,900 households. The PMA population base has grown
more slowly than that of the county as a whole due to its built-up nature and limited supply
of land for development. In contrast, the SMA population has expanded more rapidly,
growing by 11 percent from 2010 to 2017 with the addition of 2,500 new households, as
shown in Table C-1. This reflects primarily the extensive apartment development occurring
in downtown Silver Spring.
The PMA residents are slightly older with a median age of 40.5 years as compared with
39.5 years in the county as a whole and 37.0 years in the Washington Metro Region, as
shown in Appendix C-2. SMA residents with a median age of 36.4 years include a much
higher share of 25- to 44-year olds. Residents aged 65 and over represent 15.8 percent of
the PMA households, a somewhat higher rate than in the county and much higher than in
the region or the SMA. ESRI projects that this portion of the county population will
increase from 15.3 percent of the county’s population in 2017 to 17.4 percent in 2022 with
the aging of the “baby boom” generation. (See Appendix Table C-3.)
2 Estimated by ESRI, a national demographics provider.
9Montgomery County Residents Aged
65+, 2010-2022
120,000 10.0%
Number of Residents
8.8%
100,000
80,000 6.4%
5.1%
60,000 3.9% 4.2%
40,000 2.0% 2.3% 2.3%
20,000
-
2010 2017 2022
65 to 74 Years 75 to 84 Years 85+ Years
PMA households are relatively small with an average of 2.4 persons as compared with 2.7
persons countywide. This reflects the relatively larger share of persons living alone who
account for almost one-third of households along with another 31 percent with two persons,
as shown in Appendix Table C-4. Only 8.4 percent of PMA households have five persons or
more despite the large number of single-family houses in the area. SMA households are
even smaller with an average of 2.33 persons.
Primary Market Area Households by Size, 2010
5+ People
8%
4 People
13%
1 Person
33%
3 People
15%
2 People
31%
10Just over three-fifths of PMA households own their own homes, a significant decline from
the 64.1 percent of owners in 2010. (See Appendix Table C-5.) The ratio is reversed in the
SMA with 63.2
Households by Income, 2017 percent of
households renting.
100%
$150,000 or more PMA households
80% have a median
$100,000 to $149,999
60%
household income
$75,000 to $99,999
of $99,100, equal to
40% $50,000 to $74,999 97 percent of the
20% $35,000 to $49,999 county’s median
$25,000 to $34,999 income and 104
0% percent of the
Primary Market Secondary Montgomery Less than $25,000
Area Market Area County
region’s median, as
shown in Appendix
Table C-6. Given the high share of renters and younger households among SMA
households, the median income is $76,400. Apartment construction has expanded the
renter share of households across the region.
Fifty-three percent of PMA households were headed by individuals aged 45 to 74 in 2015
(Appendix Table C-7) as compared with 45 percent of SMA households and 54 of county
households. Three-quarters of these households were homeowners, based on 2010 data
(Appendix Table C-8). That compares with 60 percent of SMA households in the same age
range. Appendix Table C-9 provides information on the share of owner households by
income. As one would expect, the data show that the share of owners increases directly
with household income, from 34 percent of PMA households with incomes between $50,000
and $75,000 to 68 percent of those with incomes between $100,000 and $150,000 and 89
percent of households with incomes of at least $150,000.
By occupation PMA residents are overwhelming concentrated in white-collar occupations
(78 percent of all employed residents), as shown in Appendix Table C-10. By industry, 63
percent of employed residents work in the Services industry, which ranges from personal
and household services to medical, educational and legal services (Appendix Table C-11).
In terms of commutation patterns, many more PMA residents used public transit (31
percent) than did county residents (16 percent) in 2015. Sixty percent commuted by
automobile or truck, including 54 percent who drove alone in 2015. Fully 6.5 percent of
PMA residents worked at home, as shown in Appendix Table C-12.
11Means of Transport to Work for Primary Market
Area Residents, 2015
Bicycle, Worked at
Walked or Home
Other 7%
3%
Public
Transport Drove Alone
31% 54%
Carpooled
5%
12III. Commercial Market Potential
In assessing the potential for future commercial development, the following section focuses
on both the retail and office market including medical office space.
As with many aging strip shopping centers and retail districts, Montgomery Hills has been
shaped by its historic patterns of commercial development along its major thoroughfares.
Though parts of the local retail offerings were developed as cohesive shopping centers
under single management, other facilities were developed piecemeal with multiple
landowners and business tenants. Those patterns – retail development on relatively small
and shallow lots held by multiple owners and constrained by nearby residential uses – will
continue to influence future uses and redevelopment potentials. Though some of the older
buildings do not offer the space configurations and parking that today’s retailers and office
tenants are seeking, the disparate interests of different owners will likely complicate land
assembly and redevelopment of modern spaces.
Retail Market
The success of retail in any market area depends on the income levels and spending
patterns of the area residents, workers and visitors. It is crucial to understand the dollars
available and how area customers spend their disposable income. Such indicators
determine the need for specific types of retail and services based on consumer preferences.
Retail analysis breaks retailers into three main categories:
• Neighborhood goods and services, which includes grocery stores and drugstores;
• Shoppers goods, which includes the type of merchandise typically sold in a
department store – general merchandise, apparel and accessories, furniture and
furnishings, electronics, sporting goods, books, and other miscellaneous types of
retail (also known as GAFO); and
• Eating and drinking, which includes the full range of fast food, carry-outs and sit-
down restaurants and bars.
Customers choose retail opportunities based on convenience not only as it relates to their
place of residence but also where they work. Customers are mobile and will travel to
locations with multiple shopping alternatives and a cluster of stores to meet their retail
needs. Typically, neighborhood shopping areas have very limited offerings of general
merchandise, apparel and accessories, furniture and home furnishings, and other shoppers
13goods. These are goods for which most consumers like to comparison shop, considering
choices from several clothing stores, for example. This desire for convenient comparison
shopping was the driving force in the creation of downtown business districts and then
shopping malls. Few neighborhood business districts can support the number and variety
of stores required to offer that comparison-shopping opportunity. Both Wheaton and
Downtown Silver Spring offer major clusters of shoppers-goods retailers and regular and
discount department stores, preempting the potential for any significant shoppers goods
retailers in Montgomery Hills and Forest Glen.
Given that reality, this analysis focuses on the area’s retail opportunities in convenience
goods and eating and drinking. While there may be opportunities for individual stores
selling general merchandise, apparel and accessories, furniture and furnishings, or other
shoppers goods, those opportunities depend on the individual retailer’s marketing strength
and reputation rather than the size of the market.
The Montgomery Hills commercial node blends convenience retail, restaurants, a few
boutique retail operations, and other established businesses. A review of key anchor stores
provides a measure of the potential success. For Montgomery Hills, the opening of the new
Aldi’s grocery store provided a new anchor for the existing cluster of businesses at the
Seminary Place shopping center. Aldi’s attracts price-conscious shoppers from a wide
swath of Montgomery County and close-in District of Columbia. Other anchors that attract
customers from beyond the immediate area include the long-time Goldberg’s Bagels,
Academy Dog Training, Woodside Deli, La Casa del Mofongo and other restaurants.
The stores along Seminary Place and on the eastern side of Georgia Avenue are in
structures dating from the 1920s through the 1960s. The small shops serve the local
population primarily selling carry-out food, liquor,
Academy Dog Training owner cellphones, jewelry, hair styling and urban fashion.
reports a desire to stay in the Churches occupy at least two storefronts. Some of these
community with the potential retailers are under-capitalized and operating in buildings
to expand kennel operations that are in only fair condition with inadequate options for
in nearby industrial areas. loading. These inadequacies limit the buildings’ ability to
attract national/regional retailers.
Competitive Environment
Historically, the retail offerings in Montgomery Hills served as the center of the community
and provided a wide range of merchandise. The suburbanization of retail and the
development of regional shopping centers, such as Westfield Mall, in the 1960s expanded
residents’ options for stores offering clothing, accessories, furniture, and other shoppers
14goods, leaving primarily independent stores that cater to the day-to-day needs of nearby
residents along Georgia Avenue south of the Beltway and some with a unique draw that
attracts customers from a broader geography. Other large clusters with clothing,
accessories and restaurants opened in urban locations like nearby Silver Spring.
Map 3. Major Competitive Retail Centers
LEGEND
Wes ield Mall (1.6 million SF)
Downtown Silver Spring (440,000 SF)
Ellsworth Place (350,000 SF)
Retail Demand
PES analyzed retail demand to consider the current and future potentials for retail space
within the Montgomery Hills and Forest Glen communities. The demand for retail facilities
relates to the ultimate sales potential, estimated based on expenditures by residents and
workers within reasonable proximity as well as commuters and other customers from
beyond the market areas. Baseline data on total retail demand by retail category for the
PMA and SMA are shown in Appendix Table C-13 and C-14. These tables show annual
expenditures by residents of the two market areas.
Montgomery Hills retailers “capture” only a share of residents’ expenditures as actual sales.
The amount of expenditures captured in the Montgomery Hills retail node varies by
15category of retail goods based on the competition and the strength of the existing stores.
Capture rates measure the share of potential expenditures that come to an individual store
or shopping area from each market source (i.e., residents, workers or commuters). Local
retailers generally capture a relatively high share of PMA residents’ spending on
neighborhood goods (e.g., drugstore items and groceries) because most consumers do not
need to travel far to find the types of food and goods they are seeking. Consumers need to
purchase such goods more frequently and value convenience.
The 6,8003 employees in the study area represent an additional market for area retailers.
The International Council on Shopping Centers frequently conducts surveys of how much
office workers spend during the day while at or near work. In general, most office workers’
spending near their offices is on groceries, eating and drinking and health and personal
care. Most of their other shopping occurs near their homes, in major shopping centers and
on vacation.
Commuters and other travelers along Georgia Avenue also shop with Montgomery Hills
retailers. Retailers interviewed along the west side of Georgia Avenue estimated a higher
percent of their business is generated by commuters, though that is somewhat constrained
by the ban on left turns at most intersections. Aside from gas stations, most retailers
along the eastern side of Georgia Avenue did not indicate reliance on commuter customers.
A few of the area’s restaurants have a regional reputation that draws customers from
beyond the PMA and SMA. The potential expenditures of people who do not live or work in
the area are termed “inflow” and are measured as an incremental amount based on total
sales to residents.
The following table details the total amount of demand from these PMA and SMA
residents, local office workers and inflow from commuters and patrons from outside the
area by retail category that can be captured in the Montgomery Hills retail node. The
underlying capture rates are shown in Appendix Tables C-15 and C-16. They consider the
nature and market appeal of study area retailers in comparison with competitive shopping
areas where residents might otherwise shop.
3This count excludes Holy Cross Hospital employees because they generally have limited time to go
out at lunch and are not within easy walking distance of Montgomery Hills retailers.
16Table 2. Retail Demand by Category, 2017
Total
Residential Worker Inflow Expenditure
Retail Category Demand Demand Demand Potential
Neighborhood Goods & Services $98,817,100 $4,140,980 $10,921,500 $113,879,580
Eating and Drinking $8,315,000 $1,630,440 $2,861,700 $12,807,140
General Merchandise $2,045,100 $12,578 $139,500 $2,197,178
Subtotal Expenditure Potential $109,177,200 $5,783,998 $13,922,700 $128,883,898
Source: ESRI, Retail Marketplace Profile: ICSC; Partners for Economic Solutions, 2018.
Table 3 compares total potential expenditures from residents, workers and visitors
captured by area retailers (i.e., total demand) with actual sales by local retailers to identify
opportunities for additional retail space by category. If the total demand exceeds the
corridor retail sales, the result is an unmet demand or “retail gap”. It should be noted
however, that the unmet demand may be insufficient to support a new store based on store-
specific criteria. Table 3 excludes general merchandise categories as the study area has
minimal appeal for such retailers due to the lack of the opportunity for comparison
shopping.
Table 3. Unmet Retail Demand by Category, 2017
Current Retail
Industry Group Total Demand Sales Retail Gap
Neighborhood Goods and Services
Grocery Stores $84,251,200 $27,997,200 $56,254,000
Specialty Food Stores $569,700 $473,700 $96,000
Beer, Wine & Liquor Stores $3,552,000 $1,500,000 $2,052,000
Health & Personal Care Stores $25,506,700 $15,717,200 $9,789,500
Total Neighborhood Goods and Services $113,879,580 $45,688,100 $68,191,480
Eating and Drinking
Restaurant and Eating Places $12,637,000 $9,547,500 $3,089,500
Special Food Services $101,600 $1,644,000 -$1,542,400
Drinking Places - Alcoholic Beverages $68,500 $0 $68,500
Total Eating and Drinking $12,807,100 $11,191,500 $1,615,600
Source: ESRI, Retail Marketplace Profile; ICSC; Partners for Economic Solutions, 2018.
Overall, there is demand for neighborhood goods and services not being met by existing
retailers. The 2017 grocery sales data do not reflect the new Aldi’s, which is now meeting
17an estimated $11 million of the unmet demand.4 Other than groceries, the most significant
category of unmet need is health and personal care stores. There is also some limited
unmet demand for restaurants. However, at least in the near term, trends for the
redevelopment of shopping centers highlight the preferences to shop at centers that also
offer fast-casual dining and carry-out options. While the ability of these small commercial
nodes to capture this retail potential is constrained by the limited availability of land in the
near term, opportunities to facilitate high impact retail infill listed below may be key.
New unmet demand exists in the following store types:
• Small pharmacy or wellness retail operation 14,000 sf
• Fast casual dining within existing shopping centers 3,000 sf
The PMA has the requisite demographics to support and attract additional chain retailers
and restaurants. However, it does not offer the physical sites and parking typically
required by chain restaurants. A typical Panera5, for example, would require 75 parking
spaces (roughly equal to the number of spaces provided for Aldi’s). They also prefer
outparcels with visibility to the street. On the west side of Georgia Avenue, those
outparcels are occupied by a gas station and car wash, preempting key parcels.
It is important to remember that retailers’ site selection criterion reflect specific factors,
including items such as population density, educational attainment and an adequate site or
building space. At this time, credit retailers find both Montgomery Hills and Forest Glen
area meet some of their site selection requirements but those new retailers tend to be
drawn to the western side of Georgia Avenue with deeper lots and more modern retail
configuration.
Montgomery Hills also has the competitive disadvantage of sitting between two strong
restaurant clusters in Downtown Silver Spring and Downtown Wheaton. These business
districts have much better daytime activity and lunchtime demand. Traffic congestion also
dissuades some potential retailers and restaurants from locating in the Study Area.
4 Statista, “Sales per store of the leading supermarkets in the United States in 2017 (in million U.S.
dollars).” Accessed at https://www.statista.com/statistics/197905/2010-sales-per-store-of-
supermarkets-in-the-us/
5 Assumes 5,000 square feet of space, 2,500 square feet of patron space and an 800 square-foot
outdoor space.
18Retail Transition
The retail landscape continues to shift nationally with disruptions to the marketplace
persisting. E-commerce, which represents five percent of the total US retail sales in 2017,
continues to grow as technology improves on-line retailers’ ability to guarantee same-day
delivery. As delivery networks develop and delivery options improve, e-commerce will
likely continue to expand, exerting competitive pressures on most retailers. The
Montgomery Hills Staples store closed in part because of the shift to on-line purchasing.
Convenience goods retailers will likely become more susceptible to competition in the mid-
term as shoppers’ habits continue to change. Shoppers still frequent grocery stores but for
a changing mix of goods that emphasizes fresh and prepared foods. Successful brick and
mortar retailers need to offer more than goods and services by incorporating good customer
service, experiences and solutions to customer problems. Eating and drinking places have a
particular advantage in offering both food and the opportunity for socializing.
Evidence suggests that future retailers increasingly will seed out locations with outside
activity generators and quality public open space. Those retailers able to build on existing
generators within Montgomery Hills and Forest Glen will further benefit from proposed
SHA streetscape improvements. In addition, the possibility to develop more green space
intermittently along the Georgia Avenue corridor could improve the urban retail
environment.6
Office Market
The commercial office market in the Montgomery Hills and Forest Glen section of
Montgomery County offers a good location with great access to transportation networks.
Holy Cross Hospital acts as a key institutional anchor generating demand for medical
office, particularly in Forest Glen. Montgomery Hills’ office space demand reflects
primarily neighborhood office users, such as insurance agents.
The Montgomery County office market consists of 72.7 million square feet of space with a
13-percent vacancy rate, based on CoStar data shown in Appendix Table D-1. Office rents
in the county average $27 to $29 per square foot. Within Montgomery County, negative
absorption of 331,000 square feet of office space since 2013 reflects both the removal of
obsolete inventory, a move toward greater efficiency in space utilization, and limited
demand for new office products over the last five years. While working in traditional office
6World Green Building Council, “Health, Wellbeing and Productivity in Retail: The Impact of Green
Buildings on People and Profit”, 2016.
19space flourished for decades, it is likely the way we work will continue to transition to
informal work environments, constraining the demand for new office space.
The Silver Spring office submarket defined by CoStar uses the Beltway as the northern
border and most accurately represents trends in the central business district of Silver
Spring with more than 7.2 million square feet of space and a vacancy rate of 10 percent.
The Silver Spring submarket mirrors closely Montgomery County trends with similar
rental rates and negative absorption trends of 71,700 square feet over the last five years, as
summarized in Appendix Table C-1.
Based on CoStar data, the Study Area has 16 office buildings with a total of 198,000 square
feet of office space. The majority of this office space is located north of the Beltway
comprised of stand-alone buildings along Medical Park Drive and Forest Glen Road. The
office space south of the Beltway consists primarily of second-floor office space, with retail
storefronts on the ground floor. A review of the 16 buildings shows that more than half –
approximately 55 percent of the office space – was built in the 1960s and another 38
percent constructed prior to 1960, as shown in Appendix Table D-2. Classing of commercial
space helps to properly evaluate existing supply by differentiating buildings by physical
condition and operating performance. Class A represents those buildings that command
the highest rents, and Class C represents those properties in average condition receiving
lower than average rents. As a result of the buildings’ age and limited private investment
in some cases, all offices in the Study Area are classified as Class B or C. Only a few
buildings were renovated or constructed in the late 1970s and early 1980s. No new
construction of office space has occurred in the Study Area in the last three decades.
Medical office space represents the largest share of Study Area office space with roughly
130,000 square feet in five major buildings along Georgia Avenue between Forest Glen
Road and Dennis Avenue. Due to the proximity to Holy Cross Hospital, special zoning
provisions allowed medical office buildings in what were otherwise residential communities.
The remaining space represents space for small, service-type firms, such as tax preparers
and insurance agents.
Vacancies are low at 3.5 percent, compared with the 5-percent standard for healthy
markets. Rents generally range from $16 to $22 per
square foot for non-medical spaces, rents, well below Mr. Ramon- property owner
those achieved in Downtown Silver Spring. The area “Office tenants on the second
offers affordable spaces for small businesses, spaces that floor use the County’s parking
are often difficult to find in larger, newer buildings lot and that helps me keep the
where the emphasis is on attracting large tenants space occupied.”
20needing 5,000 square feet or more. The corridor’s older buildings can offer space at much
lower rents than can newly constructed buildings due to high construction costs. These
prevailing rents do not support the cost of building new office space. Free parking is
available for some tenants, though others depend on County Parking District lots.
Interviews with area property owners noted challenges in filling vacancies due to the
condition of older commercial structures and the lack of dedicated parking. Some of this
downward shift in demand also reflects the waning need for traditional office space and the
ability to conduct neighborhood-related business activities over the Internet.
Healthcare Office Demand
Office tenancy within the Forest Glen community is dominated by local population-serving
businesses, almost exclusively medical and dental services. The presence of Holy Cross
Hospital has attracted medical practitioners who have privileges there, aggregating into
five medical office buildings. Convenience of hospital proximity coupled with the presence
of suitable office space gives the area particular advantages for this market segment. This
is one of three major clusters of medical practices in the county – others are in Bethesda
and Shady Grove for proximity to other hospitals.
Medical office space demand is transitioning as the health care industry shifts from doctors
working in profitable private practices with hospital privileges to hospital employees,
known as hospitalists. These hospitalists work full-time providing acute care for
hospitalized patients in hospitals as opposed to running independent practices and leasing
or owning separate real estate. Over the last decade rapid growth in the use of hospitalists
has impacted the ability for private practices to compete for talented doctors. As a result,
private practices and their demand for independent medical office space near hospitals is
waning somewhat. Exceptions exist for specialists that require immediate access to
hospitals such as orthopedists, but benefit from a separate office space for additional
outpatient care. Holy Cross Hospital recently developed a medical office building to
accommodate such practices on the hospital campus.
The Affordable Care Act and revisions to Medicare / Medicaid compensation practices are
pushing hospitals to control costs by reducing hospital admissions and shortening stays.
The next round of cost controls focuses on reducing the overall costs of care, putting a
premium on preventative medicine and wellness services. These trends impact land use
decisions by large healthcare providers.
21Recent Trends
In recent years some healthcare providers have shifted from traditional real estate campus
options to smaller mixed-use communities in which ambulatory care centers mix with
urgent care, rehabilitation services, and/or women’s health operations in conjunction with
health-related retail operations. Americans increased their use of urgent care clinics by 19
percent and their use of retail clinics for medical care by 76 percent from 2010 to 2015.7
By using a mixed-use model, healthcare organizations provide care delivery within
residential communities or in close proximity to their patients, increasing their outreach.
In Bryn Mawr, Pennsylvania, the Whitehall Community for seniors created a village
setting with hospital clinical services, as well as retail, restaurants, and townhomes in
2012. In many new mixed-use communities, healthcare becomes one component but not the
anchor element and certainly not the owner of the real estate development. Many
healthcare organizations are opting for leases within such mixed-use developments,
particularly in areas where a high share of the population is over the age of 65.
Holy Cross Hospital has a lease in the Elizabeth Square senior development in Silver
Spring, which provides wellness activities and a clinic co-located with County recreational
facilities. Holy Cross Hospital’s potential for expansion in the Forest Glen area would be
limited to smaller outposts of preventative medical service operations as a tenant in a
larger mixed-use project rather than as a single-user owned operation.
Over time, Forest Glen’s medical office space will likely need to transition to accommodate
a wider variety of tenants and activities. Redevelopment opportunities may emerge.
Office Opportunities
In the near term, market demand suggests only slight modifications to existing office space
with renovations to continue support of existing tenant base. The less expensive office
space options for office users in renovated storefronts or second-floor space above the
storefronts represent a key supply for start-up businesses and those price-sensitive office
users interested in close proximity to the residential base and the access provided by the
Beltway and Georgia Avenue.
In Montgomery Hills, shared-use offices that allow tenants to share access to conference
rooms, WiFi, printers, copiers and other technology could be attractive to cost-sensitive
7Bentle, Kyle “Visits to urgent care and retail clinics on the rise” Chicago Tribune, Oct 9, 2015.
Accessed at http://www.chicagotribune.com/ct-visits-to-urgent-care-and-retail-clinics-on-the-rise-
20151008-htmlstory.html
22You can also read