Kamloops Affordable Housing Needs Assessment 2012
←
→
Page content transcription
If your browser does not render page correctly, please read the page content below
Kamloops
Affordable
Housing Needs
Assessment
2012

A partnership project with the Kamloops
Homelessness AcƟon Plan partners & the
Kamloops Housing Board
Report Released May 8th 2013

Researchers
Jennifer Casorso      City of Kamloops
Blake Collins         City of Kamloops
Tangie Genshorek      Kamloops Homelessness Ac on Plan
Jeff Hicks             Student Researcher, Homelessness Ac on Plan
Terry Kading          Faculty, Thompson Rivers University
Tim Norman            Student, Thompson Rivers University
Jayden Riley          Student, Thompson Rivers University

                                                                    CITY OF KAMLOOPS
1 Kamloops Affordable Housing Needs Assessment 2012 Contents Summary p.2 Recommendations p.6 1 Introduction p.7 2 Demographics p.13 3 Shelters p.23 4 Temporary Supported Housing p.32 5 Subsidized Housing p.38 6 Private Market Rental p.48 7 Entry Level Home Ownership p.77 8 Housing Creation p.90 9 Sources p.94 Appendix A Living Wage Information A2 B Rental Market Estimation A5 C Price-to-Rent Ratio A7 D Reference Maps A8 E Low-Income Cut-Off table A 10 F Women's Shelter Summary A 15 G History of Measuring Affordability A 16 H Strata Conversion Policies A 18 I Home Ownership Scenarios A 19 J BC Housing Data A 23 K Housing Starts, Kamloops A 29 L Regression Analysis A 30 M Survey Questions A 31 N Methodology A 33 O Spatial Data A 39 P Kamloops Community Groups A 41 Q Calculations of Housing Need A 44 R Municipal Policies & Actions A 46
Kamloops Affordable Housing
Needs Assessment 2013
Summary
The Kamloops Housing Board is proud to be a part of this community project with the City of
Kamloops, and the Kamloops Homelessness Action Plan. The Kamloops Housing Board was formed in
2010, in partnership with the City of Kamloops and the Homelessness Action Plan, as a body to address
issues related to housing and homelessness in Kamloops. The mandate for the group is as follows:
The primary purpose of the Kamloops Housing Board will be to collect, analyze and
distribute housing information in order to facilitate informed planning to address
housing related issues in the community. Together with the support of the City of
Kamloops and the Social Planning Council, the Housing Board will become an avenue to
discuss recent trends, to evaluate supply and demand, to establish community
priorities in an open forum, and to discuss policy and legislative reform where deemed
necessary.
The purpose of the study is to attempt to understand need and demand for specific types of
housing within Kamloops, with the aim to improve the provision of affordable housing overall. We had
four objectives when we set out on this process.
To inform municipal policy decisions regarding affordable housing in Kamloops
To assist non-profits, businesses, faith groups & other organizations in the development
of affordable housing
To inform the work of the Kamloops Homelessness Action Plan
To provide accurate information to the community related to affordable housing
The Kamloops Housing Board consists of the following representatives as of January 2013, we are very
thankful for their engagement and volunteer dedication. A public call for new members will be issued in
2013.
Jeanie Cardinal White Buffalo Aboriginal Health Centre
Jennifer Casorso Social & Community Development Supervisor
Peter Chau BC Housing Regional Supervisor
Blake Collins City Planner, Development & engineering Services
Nikki Deverell Think Outside the Box Developments
Kelly Fawcett The Kelson Group
Tangie Genshorek Kamloops Homelessness Action Plan Coordinator
Sukh Heer Matonovich TRU Student Engagement & Retention Coordinator
Carmin Mazzotta City of Kamloops, Housing & Homelessness Coordinator
Stefen Reid Trophy Developments
Wendy Sims ASK Wellness
Renee Taylor Citizen at Large
2Who needs Affordable Housing?
Why?
The short answer is that everyone needs
affordable housing. Affordability depends
on income, and everyone should be able
to find housing that matches their income.
The generally accepted measure for
affordability is that no one should pay more
than 30% of their income for their housing,
including utilities and taxes (cmhc.beyond2020.com) In reality many people regularly pay much more
than 30% of their income to housing. Some of the most vulnerable groups in need of affordable housing
include people who are living in poverty, especially those who live in poverty and suffer from mental
health challenges, disabilities, or have dependents to care for. Some of the groups who need affordable
housing include senior citizens, youth, and low income families, particularly those who have a single
parent or a single earner.
When people do not have access to appropriate and affordable housing the result can be extreme for
both the people who are in need, and for the whole community. When people aren’t housed they can
enter into a cycle of poverty that can see them utilizing public resources such as shelters, public housing,
police, ambulance, and hospital services. The Centre for Applied Research in Mental Health & Addiction
estimated that it costs $55,000 a year to provide services to someone who is living on the streets in B.C.,
while it could cost as little as $37,000 a year to keep that same person in supported housing.
(www.carmha.ca)
What is Affordable Housing?
Affordability depends on income, and affordable housing means different things to different people.
The need for affordable housing is as diverse as the people who need it. Generally speaking, for the
purposes of this report we are looking at housing that costs no more than $725.00 per person per
month. We do not measure need for shelter beds because we do not consider them housing. The most
temporary form of housing should be transitional housing that is tied to supports.
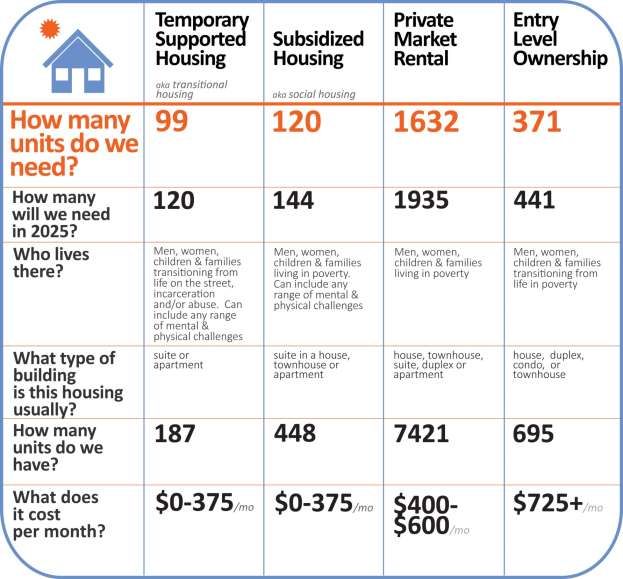
4 Types of Housing
Temporary Supported Housing
Subsidized Housing
Private Market Rental Housing
Entry Level Home Ownership
Many different people use each type of housing, but often Temporary Supported Housing, aka
Transitional Housing, will help people who are moving from incarceration or addictions to integration in
the community. Subsidized Housing is often for those who live with long term disabilities or mental
health challenges, and can also provide temporary housing for people in poverty. Private Rental
Housing can be any rental in any kind of building, and can be utilized by those who collect income
assistance, who do not require some of the more supported types of subsidized housing. Entry Level
Home-Ownership units are used by a wide range of individuals and families depending on a number of
3factors such as availability of a down payment, or presence of debt. The table below begins to
summarize the information we know about affordable housing in Kamloops, showing a total need for
2222 units in Kamloops currently. Please see the full report or Appendix Q for details on the calculations
of the figures below.
Kamloops Affordable Housing Needs Assessment 2012
Affordable Housing in Kamloops
4How Do We Get More Affordable Housing?
Building housing that may not come with a profit is challenging, and we must find new ways to ensure a
diverse range of affordable housing is available in our community. Though we have to find solutions
that work for our community, we can use the collective knowledge of what has worked elsewhere in
Canada to help us on our way. Other communities have found success utilizing some core principles in
ending homelessness.
Core Principles in Ending Homelessness
Housing First
The idea behind Housing First is that everyone deserves and needs a stable, appropriate home. In the
past we sometimes approached the issues of homelessness from a model of ‘housing readiness’ or
movement along a continuum of service. We now understand that the first step towards anyone’s
success is a permanent home.
Evidence Based Practice
Research & evaluation are valuable tools in being able to measure the success of our interventions.
When we develop starting points and goals that come with measurable outcomes, we can make sure
that we are truly making steps towards ending homelessness.
Partnering Across Sectors
Many community members must be at the table to bring knowledge and resources. And new ways of
approaching housing through partnerships must be developed and implemented.
5Kamloops Affordable Housing Needs Assessment 2012
Recommendations
Recommendations for the City of Kamloops
Continue to support the creation of policies that encourage the production and retention of,
and planning for varied types of affordable housing in the community. Policies may include
strategies in the Official Community Plan, strategies in the Kamloops Social Plan, zoning regulations,
bylaws or other areas of municipal governance. Some examples of policies could include but are not
limited to: the development of a healthy vacancy rate standard, limiting conversion or demolition of
affordable rental housing, continued expansion of density bonus systems, and minimum requirements
for affordable units in new multi-dwelling projects.
Incorporate the findings of the Affordable Housing Needs Assessment, and other research
produced by from the Kamloops Housing Board, into the development of the Official
Community Plan and the Kamloops Social Plan. Utilize the results of the Affordable Housing Needs
Assessment to formulate strategies for long-term municipal planning. Plan to update the Affordable
Housing Needs Assessment regularly as new information becomes available, such as Provincial and
National Census data.
Continue to fund, and promote the Affordable Housing Reserve Fund and consider strategies
to encourage Builders, Developers, and other members of the public to contribute to the
fund. Continue to promote and advertise the Affordable Housing Reserve Fund as a resource for the
public to utilize in the creation of new affordable housing.
Encourage the sharing of research and development of information about local affordable
housing with all levels of government and stakeholders. Share information, resources, ideas,
challenges and opportunities regarding Affordable Housing between the City Council, the Province of
British Columbia, the Federal level, with Aboriginal Bands, the business community and other
stakeholders in the community.
Recommendations for the Kamloops Housing Board
Continue to undertake research in partnership with Thompson Rivers University regarding
the specifics of local Affordable Housing need. Some examples of areas of research could include,
but are not limited to: effects of migration on housing in Kamloops, the needs of user groups including
urban aboriginals, seniors and youth, the impacts of changes in industry on local affordable housing, and
the projected need for student housing ongoing.
Work together with community groups, agencies, private landlords, and other stakeholders
to develop awareness of housing needs and opportunities. Continue to share information with
the public to build awareness around the challenges and opportunities, towards the goal of finding
lasting solutions to the issues of affordable housing.
6“Homelessness is not like an illness that
can be treated by specialists, it is a
pervasive & complex issue that can only
be successfully addressed by engaging
the interest, energies & determination of
all parts of the community ...” Doug Sage,
Executive Director, Canadian Mental Health
Association
Kamloops Affordable Housing Needs Assessment 2012
Section One
Introduction
Developing a comprehensive understanding of the local need for specific types of affordable housing in
our community is the first step towards effective policy, well-targeted community services, and a
leadership base that is well prepared to deal with housing issues. The Kamloops Affordable Housing
Needs Assessment has been commissioned by the Kamloops Housing Board, in partnership with the City
of Kamloops, and the Kamloops Homelessness Action Plan to assess affordable housing within the
community. The study was carried out over the summer months of 2012 and completed in January
2013.
This study is the result of a community-wide effort to provide Affordable Housing and end
homelessness. Numerous community agencies, groups, organizations and individuals have been
involved in this work in the community for years. We would like to acknowledge, in particular the
following groups. (A list of the members of each group can be found in Appendix P.) The Kamloops
Housing Board, Changing the Face of Poverty, the Kamloops Working Group on Homelessness, the
Kamloops Homelessness Action Plan Steering Advisory Group and the Kamloops Homelessness Action
Plan Leadership Council.
7We are part of a very large movement all across North America to end homelessness and find solutions
to the affordable housing crisis. The concept of Housing First is at the heart of the movement to end
homelessness.
“Housing First is an approach to ending homelessness that centers on quickly providing homeless
people with housing and then providing additional services as needed. … The basic underlying principle
of Housing First is that people are better able to move forward with their lives if they are first
housed. This is as true for homeless people and those with mental health and addictions issues as it is
for anyone. .. the model is simple: provide housing first, and then combine that housing with supportive
treatment services in the areas of mental and physical health, substance abuse, education, and
employment.” More information about the housing First is available at the Homeless Hub
www.homelesshub.ca/topics/housing-first
Key Points on Homelessness
An estimated 157,000 people are homeless each year in Canada. 99 Street Homeless were
counted in Kamloops last year and 306 in Metro Vancouver. (from annual counts) While 39,000
people who live with severe addictions or mental health concerns are inadequately housed in
BC. (www.sfu.ca/carmha.html)
Approximately 20% of homeless people in Canada remain homeless for more than 3 months,
the chronically homeless, life on the streets and in shelters creates cascading trauma leading to
addiction, abuse and suicide.
Chronic homelessness is deadly, resulting in an estimated 1,350 people in Canada dying each
year which is half the number of Canadians killed in car accidents. The average life expectancy of
a homeless person in Canada is 39 years.
The chronic homeless incur large economic costs – an estimated $1.1 billion or $35,000 cost per
person each year through being inappropriately ‘housed’ in jails and temporary shelters and
using hospital emergency departments.
Escape from homelessness is possible – The Housing First model is gaining momentum and
many programs developed to rapidly house the homeless have been proven to be successful
through quantitative and qualitative evaluation.
Organizations that work with the homeless have the best results when they provide individual
choice, dignity, recovery opportunities, and a sense of community.
1.1. Purpose
The purpose of the study is to attempt to measure the level of need for specific types of affordable
housing within Kamloops. We had four objectives when we set out on this process :
To inform municipal policy decisions regarding affordable housing in Kamloops
To assist non-profits, businesses, faith groups and other organizations in the development of
affordable housing
To inform the work of the Kamloops Homelessness Action Plan
To provide accurate information to the community related to affordable housing
81.2 Defining the Region
The study focus area is the city of Kamloops. While it is undeniable that changes in surrounding markets
will affect the Kamloops affordable housing market, these areas are outside the scope of this
assessment. For the purposes of this study, there are two main geographic definitions used: the Census
Agglomeration of Kamloops and the city of Kamloops. It is impossible to use just one geographic
definition for all the sections, accordingly the geography will be specified throughout the study, using
following terminology:
Census Agglomeration = Kamloops (CA)
City = Kamloops (CY)
Reference maps for both geographies are in Appendix D. As for the relative size of each, Kamloops (CA)
includes rural areas around Kamloops and thus has roughly 13,000 more people than the city proper.
1.3 Defining Housing Type
The varied types of affordable housing include: Emergency Shelters, Temporary Supported Housing,
Permanent Subsidized Housing, Private Market Rentals, and Home Ownership. The idea of a Housing
Continuum is meant to represent the range of affordable housing needs, and the continuum is not
meant to infer that all individuals will, or should, move their way towards home ownership. However,
for those who wish/need to move along the continuum, there must be readily available options.
Emergency Shelters
This category of housing aims to provide immediate housing relief and services for the homeless, and for
women and children fleeing violence. This includes:
Shelters spaces, such as the Emerald Center operated by Canadian Mental Health Association
(CMHA)
Emergency Cold-Weather Shelter response programs such as “Out of the Cold” operated by the
Society of St. Vincent De Paul, supported in part by BC Housing
Women’s Emergency Shelters operated by YMCA
9Temporary Supported Housing
Temporary Supported Housing includes housing types such as Transitional Housing, 2nd Stage housing
and Recovery Homes to name a few. This housing type is defined as housing from 30 days to two or
three years that includes the provision of support services. This category includes:
Dwellings funded and/or operated by Correctional Services of Canada for people transitioning
from incarceration to independent living, aka half-way houses
Residential recovery housing facilities serving people with drug or alcohol addictions, such as the
New Life Mission’s facilities for men and women.
Youth targeted housing and services, such as a set of units operated by Interior Community
Services.
Housing for the “Hard to House” and other demographics at risk of homelessness, such as Henry
Leland House operated by ASK Wellness Centre.
Subsidized Housing
Also known as Social Housing, this category includes versions of both supported and unsupported
housing. This housing has no limit on the length of stay, and often provides ongoing support services to
residents who cannot live independently and who are not expected to become fully self-sufficient for a
variety of reasons. This form of housing is often located in a purpose-built building or scattered site
apartments1. These categories include:
Dwellings designated for families such as the Brock Duplexes funded by BC Housing.
Dwellings designated for couples and individuals such as Hilltop Apartments operated by the
Kamloops & District Elizabeth Fry Society.
Dwellings designated for Urban Aboriginals such as Twin Feathers operated by the Kamloops
Native Housing Society.
Housing designed to accommodate physical and/or mental illness such as Corner House
operated by the Kamloops & district Elizabeth Fry Society
Privately operated housing such as the Weiser House operated by Outside the Box
Developments, and the Carson Crescent Apartments operated by North Star Properties.
Private Market Rentals
This housing includes all housing available on the private rental market that is not directly subsidized.
Individuals may receive rent assistance directly from the government via the Ministry of Social
Development, the Rental Assistance Program, or the Shelter Aid for Elderly Rents (SAFER), but the
housing operators have not received any direct subsidies. This category also includes affordable rentals
for those individuals and families who do not collect any forms of subsidies but who may be earning
below a living wage. This housing includes virtually any building typology.
1
Source: BC Housing. (2012). BC Housing Glossary. Retrieved 05 25, 2012, from BC Housing:
http://www.bchousing.org/glossary
10Home Ownership
This includes all entry-level properties owned or available for ownership; single detached dwellings,
stratified condos and townhomes, and modular mobile homes. This assessment is most interested in
entry-level housing for first time home buyers who are moving out of the rental market, and generally
entering the ownership market at below median housing prices.
1.4 Defining Affordability
Housing Affordability is broadly determined by two factors: income and shelter costs. Higher incomes
and lower shelter costs will both lead to greater affordability. That being said, there are many ways to
define affordability. The typical affordability cut-off for private rental and ownership is a Shelter
Expenditure to Income Ratio (STIR) which states that housing that costs less than 30% of a household’s
total gross income is affordable. This affordability measure is often combined with measures of
suitability and adequacy (ie size, location, condition) to form a measure of Core Housing Need2. Many
transitional housing providers offer rents based off this measure, using a rent-geared to income (RGI)
approach of tailoring rents to 30% of the tenant’s income. The Official Community Plan of Kamloops
uses the same STIR measure for affordability while stipulating that only those households earning 60%
of the area median income represent those in need. 3
This strict definition of affordability is not appropriate for all kinds of housing. When considering seniors
housing, many facilities include complex services and charge on a rent geared to income basis of up to
80% of income. Furthermore, it is a moot point to consider definitions of affordability for emergency
shelters and even some transitional housing which often serve clients with no income. Moreover, the
30% STIR measure is a very broad measure, and a large percentage of Canadians currently pay more
than 30% for their shelter. In Kamloops for example, 7.8% of residents spent more than 30% of their
income in 2006 on shelter. A more specific measure(s) of affordability is thus often times warranted.
Accordingly, this study will use affordability measures specific to each type of housing.
Core Housing Need Defined
A household is said to be in core housing need if its housing falls below at least one of the
adequacy, affordability or suitability standards and it would have to spend 30% or more of its total
before-tax income to pay the median rent of alternative local housing that is acceptable (meets all
three housing standards).
Adequate housing is reported by its residents as not requiring major repairs.
Affordable dwellings cost less than 30% of total before-tax household income.
Suitable housing has enough bedrooms for the size and make-up of resident
households, according to National Occupancy Standard (NOS) requirements.
2
Source: Canada Mortgage and Housing Corporation. (2012)
3
Source: City of Kamloops. (2004). KAMPLAN: Planning for the tournament capital of Canada. Kamloops: City of
Kamloops.
111.5 Ethical Considerations
There are numerous ethical considerations when analyzing a vulnerable population such as the
homeless, or people who live in poverty. Throughout this study, measures have been taken to consider
the data from a variety of perspectives including those of the housing tenants. With regard to
measuring need in the various housing sectors, all waitlists data and client surveys within this report
were non-identifying, to protect the privacy of those applicants.
1.6 Methodology
This study generally follows the 2010 template for housing need and demand studies prepared by BC
Housing with the BC Non Profit Housing Association. Please see Appendix N for a detailed methodology
on each section of the study.
Kamloops Affordable Housing Needs Assessment 2012
Section 1 Summary
Introduction
The purpose of the study is to attempt to measure the level of need for specific
types of affordable housing within Kamloops.
Affordable Housing can be thought of as a range of housing types from
emergency shelter and transitional housing, to private rentals and home
ownership.
Each housing type comes with its own affordability level, and affordability
depends on income.
A household is said to be in core housing need if its housing falls below at least
one of the adequacy, affordability or suitability standards and it would have to
spend 30% or more of its total before-tax income to pay the median rent of
alternative local housing that is acceptable.
12Kamloops Affordable Housing Needs Assessment 2012
Section 2
Demographics
Trends in demographic and economic conditions play a large role in the housing demand. Important
trends include changes to population size and composition, changes to household and family
characteristics, trends in student enrollment, employment, migration, and long term projections. Below
is a preliminary analysis of Kamloops demographics related to demand for affordable housing.
2.1 Population Characteristics
Kamloops’ population has increased by an annual rate of 1.2% from 1991 to 2011. Between 2006 and
2011, Kamloops increased its population by 6.6%, slightly below the 7% increase of British Columbia
during the same period4. Based on 2011 Census counts, Kamloops’ population stands at 85,678
residents5.
Fig.1 Population, Kamloops (CY) from 1991 to 2011
90000
Population
80000
70000
60000
50000
1991 1996 2001 2006 2011
Census Population 67057 76394 77281 80376 85678
Source: Census of Population 2011
The fastest growing segments of the population were; 85 years and older, 60 to 64 and 25 to 29 with
43%, 33% and 26% growth rates from 2006 to 2011 respectively. Population declined amongst those
aged 10 to 19 and 35 to 49. 6
4
Source: Statistics Canada. (2012). Census Profile. Retrieved June 13th, 2012
5
Note: Annual rate calculated using exponential growth formula.
6
Source: Census of Population
13Fig.2 Population Change from 2006 to 2011
Census 2011
0 to 4 years 12% 45 to 49 years -2%
5 to 9 years 0% 50 to 54 years 12%
10 to 14 years -10% 55 to 59 years 9%
15 to 19 years -4% 60 to 64 years 33%
20 to 24 years 6% 65 to 69 years 19%
25 to 29 years 26% 70 to 74 years 12%
30 to 34 years 11% 75 to 79 years 11%
35 to 39 years -6% 80 to 84 years 12%
40 to 44 years -9% 85 years and over 43%
The figure above shows the Kamloops (CY) population breakdown for 20127. The largest segment of the
population is those aged 50 to 54 years. The trend shows clearly the baby-boomer demographic, which
is on the cusp of retirement. This age group will bring with it changing needs for seniors housing, and
support services. Also noticeable is the young adult age group, aged 20-24. This age group is significant
for two reasons. First, this population is typically served by the rental market, as they are mobile and do
not have the savings yet to enter homeownership. Given that, the affordability of the rental market is
extremely prevalent in the standard of living of this population group. Secondly, this age group is likely
to start families over the coming 5 to 10 years, which may mean attempts at moving to home
ownership.
Fig.3 2011 Population
Age Group, Kamloops
80 to 84 years
70 to 74 years
60 to 64 years
50 to 54 years
40 to 44 years
30 to 34 years
20 to 24 years
10 to 14 years
0 to 4 years
0 1000 2000 3000 4000 5000 6000 7000 8000
Male Female
7
Source: Census of Population 2011
14Figures three, four and five outline the projected population changes from 2012 to 2036, calculated by
BC Statistics which applies the Component/Cohort-Survival method to project the population. This
method grows the population from the latest base year estimate by forecasting births, deaths and
migration by age. These forecasts are based on past trends modified to account for possible future
changes and, consequently, should be viewed as only one possible scenario of future population.” 8
Fig.4 Kamloops Projected Population
120,000
100,000
80,000
60,000
40,000
20,000
0
2011
2012
2013
2014
2015
2016
2017
2018
2019
2020
2021
2022
2023
2024
2025
2026
2027
2028
2029
2030
2031
2032
2033
2034
2035
2036
Kamloops Projected Population
Fig.5 Projected Population Growth 2011 to 2036
Population Growth Percentage Growth
0 to 19 2,764 15%
20 to 54 9,632 23%
55+ 14,874 59%
65+ 13,747 103%
Total 27,269 32%
Population Findings
The total population is projected to increase by 27,269 residents to 112, 939 by 2036. This is a
32% increase.
The growth in the seniors’ population (55+ and 65+) far outpaces growth in the younger cohorts.
The population aged 65 and over is expected to increase by 103%, or in other words, it’s
expected to double. This means almost 14,000 additional seniors.
8
Source: BC Stats, Ministry of Labour, Citizens' Services and Open Government. (2012). Custom Data Request:
Population Projections for the city of Kamloops, 2011 to 2036, by 5 year age group and gender. BC Stats
152.2 Seniors Characteristics see forthcoming addendum 2013
Seniors housing demand will be increasing over the next 15 years, along with demand for the support
services required to maintain that housing. The senior population (65 and older), has grown consistently
from 2001 to 2011 and now represents over 15% of the population9. This trend is evident in the
population projections from BC Statistics10.
Fig.6 Population Over 65
Year Total % of Total Population
2001 9470 12.25
2006 11405 14.19
2011 13345 15.58
Fig.7 Seniors Population Projections
45,000
40,000
35,000
30,000
25,000
20,000
15,000
10,000
5,000
0
2012
2013
2014
2015
2016
2017
2018
2019
2020
2021
2022
2023
2024
2025
2026
2027
2028
2029
2030
2031
2032
2033
2034
2035
2036
65+ 55+
9
Source: Statistics Canada. (2012). Census Profile. Retrieved June 13th, 2012
10
Source: BC Stats, Ministry of Labour, Citizens' Services and Open Government. (2012). Custom Data Request:
Population Projections for the city of Kamloops, 2011 to 2036, by 5 year age group and gender. BC Stats
16Fig.8 Projected Population Growth
Year 2011 (Census) 2017 2022 2027 2032
55 to 64 11815 13,757 13,564 12,913 12,341
65 to 69 4010 5,782 6,479 6,638 6,362
70 to 74 3145 4,648 5,429 6,104 6,269
75 to 79 2580 3,291 4,174 4,889 5,522
80 to 84 1870 2,230 2,669 3,406 3,999
85 to 89 1,354 1,572 1,891 2,436
1740
90+ 886 1,105 1,321 1,609
65 and Over 13345 18192 21428 24248 26198
Seniors Findings
The projected population of seniors (65 and older) in 2032 is 26198. This is practically a
doubling of the senior population in the municipality over two decades.
The population of persons aged 85 and over is also expected to double. This will
represent a very large increase on the medical/health support systems that go along
with housing the very elderly.
It is projected that by 2032, seniors will make up 24% of the City’s population. That is one
quarter of the population that is retired, or soon to be retired, and approaching the
point of needing supportive living, assisted living, and complex care.
2.3 Student Characteristics
Student housing constitutes a large portion of the demand for rental stock in Kamloops (CY). During the
2010/2011 academic year, Thompson Rivers University had 7768 full-time equivalent, on-campus
students on the Kamloops campus1112. This is roughly 9% of the Kamloops (CY) population. There is no
measure of exactly how many of those students compete in the rental market each year. An
approximate estimate of the number of students that are not from Kamloops is 5000. This is 5000
students searching for housing each year. There are 1188 dwelling units offered specifically for students
through on-campus housing and Upper College Heights’ off-campus units13. Assuming that all local
students – originating from Kamloops - are housed with family or in ownership tenures, then that leaves
1188 student-specific units to house 5000 non-local students. That leaves 3812 students to compete for
housing in the rental market. This is quite a large segment, as will be clear later in the report.
11
Source: Thompson Rivers University. (2012, June). Institutional Reports. Retrieved from Thompson Rivers
University: http://www.tru.ca/__shared/assets/year_ended_march_31_201125271.pdf
12
Note: At the time of writing, the 2011/2012FTE report was not released.
13
Source: Grigoleit, K. (2012, June 14). IPA Manager. (J. Hicks, Interviewer)
172.4 Aboriginal Housing see forthcoming addendum 2013
2.5 Migration
Migration fluctuations have significant effects on the housing demand in the short and medium run.
Figure 10 shows migration by component part since 1996, for the Thompson Nicola Regional District
(TNRD), while Figure 11 shows total net migration to the TNRD.14
Fig.10 TNRD Net Migration by Type
2,500
2,000
1,500
1,000
500 Intraprovincial
0 Interprovincial
-500 International
-1,000
-1,500
Fig.11 Total Net Migration, TNRD
4000.00
3500.00
3000.00
2500.00
2000.00
1500.00
1000.00
500.00
0.00
-500.00
-1000.00
1986-87
1987-88
1988-89
1989-90
1990-91
1991-92
1992-93
1993-94
1994-95
1995-96
1996-97
1997-98
1998-99
1999-00
2000-01
2001-02
2002-03
2003-04
2004-05
2005-06
2006-07
2007-08
2008-09
2009-10
2010-11
14
Source: BC STATS. (2012, June). Mobility. Retrieved from BC Stats Websites:
http://www.bcstats.gov.bc.ca/StatisticsBySubject/Demography/Mobility.aspx
18The cyclical nature of net migration becomes apparent, with net migration hitting recent highs in the
1990s and mid-2000s. Typically net migration will be influenced by job opportunities, or lack thereof, in
the region, and these fluctuations are very apparent in the vacancy rates in Kamloops (CA), as will be
touched upon in section six. Kamloops has had a positive intra-provincial net migration for 13 of the
past 15 years, while it has had a negative interprovincial net migration for 12 of the past 15 years. This
means that, for the last 15 years, Kamloops has experienced more people moving here from out of the
Province than from within B.C.
People who participated in the Kamloops Homeless Count were asked how long they have been in the
community and where they came from. The following results reflect 92 of the 99 people who
completed surveys during the Homeless Count on Oct 18th and 19th 2012. The majority of respondents
have been living in Kamloops for over a year, with their last place of residence having been in Kamloops.
Fig.12 Length of Time in Kamloops Fig.13 Community of Last
Residence
less than 1 week
Kamloops
1 week to less than a within the Interior
month
1 month to less than 6 within BC
months
outside of BC
6 months to less than 1
year outside of Canada
1 year or more
While it would be helpful to be able to draw conclusions about migration and its effects on
homelessness and demand for affordable housing, we can see, through a brief look at Provincial
Migration, and the migration of local homeless populations, that this is a complex issue that warrants
more investigation.
2.6 Labour Market Profile
Affordable housing is affected by labour market conditions. During times of high unemployment, net
migration declines, which reduces pressure on the rental market. The opposite is also true for times of
low unemployment, high net migration, and low vacancy. This occurs in the private rental market, but
also the entry level ownership market, and the subsidized housing sector. Additionally, labour market
conditions affect incomes which affect housing affordability. For these reasons, it’s important to
understand shifts in the local and regional economy.
19Information from Venture Kamloops, regarding the major employers in Kamloops (CY), in 201015
estimated that through the Interior Health Authority, the School District, and the City of Kamloops,
there were 5630 jobs provided. This constitutes 13.4% of the total jobs, as determined by the number of
employed persons from the 2006 census, provided just through the publicly funded sector.
Fig.14 Major Employers Employees
Interior Health Authority 3000
School District #73 2000
Thompson Rivers University 1725
Highland Valley Copper Mine 1134
New Gold Mine Employees including contractors 674
City of Kamloops 630
Domtar 448
BC Lottery Corporation 433
Safeway 400
Save-On Foods and Cooper's 326
Walmart 322
Arrow Transportation 285
NRI-Distribution 247
Northern Trailer 244
Costco 238
Overlander Extended Care 225
The resource sector plays a large role as well. Highland Valley, New Gold and Domtar account for 2256
jobs, or 5.4% of total jobs (counted in 2006). With the potential introduction of the new AJAX mine, this
trend will continue to play out. Consequently, fluctuations in these two sectors will influence the
housing market in years to come. AJAX mine is projected to create 580 jobs over a two year
construction period, with 380 of those being long-term positions for the estimated 23 year life span of
the mine16. Similarly, the TELUS Information Center is projected to create 200 construction jobs and 75
permanent skilled positions17. Both these developments are large additions to the demand for labour in
Kamloops (CY). Some of this labour will be drawn from outside of Kamloops, bringing new residents
who require housing.
15
Source: Venture Kamloops. (2010). Community Facts.
16
Source: KGHM AJAX Mining Inc. (2012). Ajax Mine.
17
Globe and Mail. (2012, June 29). TELUS Breaks ground on world-leading Kamloops Data Center. Retrieved from
Globe Investor
20As will be demonstrated in Section Six, fluctuations in unemployment rates - which can be viewed as a
proxy variable for the amount of job opportunities available – are highly correlated with net migration
rates and this, in turn, is highly correlated with vacancy rates in the city. Figure 15 below shows the
unemployment rate and participation rates for Kamloops (CY) from 1996 to 201118.
The unemployment rate increased, and the participation rate decreased as the recession came into full
force. Unemployment averaged 9.1% in 2010, a recent high, however not abnormal when compared to
long run trends. The recent decline in unemployment (2011) has been coupled with a decline in the
participation rate, which, deductively, could mean that a large portion of the decrease in unemployment
has come from people leaving the workforce, not from a pick-up in hiring. In turn, net migration to the
TNRD region was negative in 2010 and 2011. To summarize all this, over the past three years,
unemployment has declined, however this was unlikely caused by an increase in hiring. More likely, this
decrease was caused by (a) a decline in the participation rate and (b) a decline in the total labour force
due to outmigration of unemployed persons (assuming Kamloops (CY) net migration is similar to the
broader TNRD region). All this is likely to reduce the pressure on the housing market, which is seen in
rising vacancy rates and declining home sales.
Fig.15 Unemployment & Participation Rates
Kamloops(CY), 1996 to 2011
16.0 72.0
14.0 70.0
Unemployment Rate
12.0 68.0
Participation Rate
66.0
10.0
64.0
8.0
62.0
6.0
60.0
4.0 58.0
2.0 56.0
0.0 54.0
1996 1997 1998 1999 2000 2001 2002 2003 2004 2005 2006 2007 2008 2009 2010 2011
Unemployment Rate Participation Rate
18
Venture Kamloops. (2012, August 20th). 20 Year Economic Indicators. Retrieved from Venture Kamloops:
http://www.venturekamloops.com/20-yeark-kamloops-trends.htm
21Total Income includes employment income, investment income, all government transfers such as
CCTB and OAS, Employment Insurance, CPP, Private Pensions, Workers Compensations, and RRSP
Employment Income includes wages and salaries, commissions from employment, training
allowances, tips and gratuities, self-employment income (net income from business, profession,
farming, fishing and commissions) and Indian Employment Income (since 1999)
2.7 Income Overview
There are three ways that income is typically measured in Canada; by the Census, through the Survey of
Labour and Income Dynamics (SLID), and through Tax Filer Data. This report relies heavily on the 2010
Tax Filer data to assess income levels and their effects on affordability in Kamloops.
Fig.16 Total Income Summary
Kamloops (CA), 2010
Median Total Number of
Family Type Income Number of Families Persons
All Families (CF+LP) $72,800.00 29080 80370
Couple Families (CF) $80,350.00 24660 69100
Lone-parent families
(LP) $34,830.00 4420 11270
Non-family persons $25,300.00 17050 17050
ALL TYPES 46130 9742019
Couple Families have the highest median income, and constitute the largest portion of all families and
persons. On the other hand, Non-Family Persons earn the lowest median income, but constitute the
second largest number of persons.
19
Note: This population count is roughly 1300 persons short of the census count in 2011. This difference is due to
(a) differing reference years and (b) inaccuracy in counting on both sides.
22Fig.17 Employment Income Summary
Kamloops (CA), 2010
Families
Median Families with with no
Family Sub- Employment Employment Employment
Family Type Type Income Income Income
All Families (CF
+LP) $63,090.00 25140 3940
Dual Earner $84,450.00 14610
Single-
earner-male $32,080.00 4200
Couple Families
(CF) Single-
earner-
female $17,520.00 2040
Total 20850 3810
Lone-parent
Families (LP) $28,220.00 3130 1290
Non-family
persons $23,520.00 10750 6300
Totals 34730 11400
While Employment Income is inherently less than total income, it does provide insight into the
conditions of the local labour market. One noticeable fact is the income difference between single-
earner male and single-earner female families, with males earning $14,560 more median income20.
There are 11,400 families (Couple families, lone-parent families and non-family persons which each
count for one family) in Kamloops (CA) not receiving employment income, according to this tax data.
That is almost 25% of the families and non-family persons (unattached individuals). Some of these
families/unattached individuals may be paid “under the table” and thus would not show employment
income on their tax form. 2010 also saw a peak in unemployment, which could play a role.
Also interesting is the difference between total income and employment income. The difference is
assumed to be made up, at least in part, by government transfers. Non-family persons earn a larger
percentage of their total income through employment income than lone parent and couple families, due
in part to the presence of children in families, qualifying them for transfers such as provincial childcare
subsidies.
20
Note: This could be partially the consequence of non-wage factors. It’s unlikely that this differential is caused
solely by women being paid a lower wage.
23Fig.18 Income Growth Rates, Kamloops (CA), 2001 to 2010
Total All Lone- Non-
Median Families Couple parent Family
Income (CF + LP) Families Families Persons
Total
Nominal
Growth
(2001-2010) 35% 31% 46% 32%
Total Real
Growth
(2001-2010) 16% 13% 26% 13%
Annualized
Nominal
Growth Rate 3.34% 3.02% 4.23% 3.07%
Annualized
Real Growth
Rate 1.64% 1.33% 2.54% 1.37%
Median All Lone- Non-
Employment Families CF- Dual CF-Single- CF-Single- parent Family
Income (CF + LP) Earner Earner-Male Earner Female Families Persons
Total
Nominal
Growth
(2001-2010) 25% 27% -5.37% 15% 45% 17%
Total Real
Growth
(2001-2010) 7% 9% -19% -2% 25% 0%
Annualized
Nominal
Growth Rate 2.47% 2.67% -0.61% 1.51% 4.16% 1.75%
Annualized
Real Growth
Rate 0.78% 0.98% -2.31% -0.19% 2.47% 0.05%
24Kamloops Affordable Housing Needs Assessment 2012
Section 2 Summary
Demographics
Total population is projected to increase by 27,269 residents by 2036. (32%) The
growth in the seniors’ population far outpaces growth in the younger cohorts.
The population aged 65 and over is expected to double.
The majority of jobs in Kamloops are provided through the resource sector or
through The Interior Health Authority, the School District, and the City of
Kamloops. Changes for these major employers will mean changes in need for
housing.
Kamloops has a population of 85,678, with a median annual income of
approximately $25,500 for singles and up to $63,000.00 for 2 parent couple
families. A total of 11,400 households in Kamloops reported having no
employment income in the last census.
*see section 2 for sources
25Kamloops Affordable Housing Needs Assessment 2012
Section 3
Shelters
3.1 Supply of Emergency Shelters
In total, 111 emergency beds exist in Kamloops (CY) (When the Out-of the-Cold Shelter is operational) to
serve the homeless and at-risk of homeless populations21. These are short term stays, ranging from a
single night to a 30 day period. Shelters in the community have been in flux recently with the former
Men’ Christian Hostel transitioning into the Emerald Hostel, and now the Emerald Centre. While there
was an overall loss of shelter beds for men when the new Emerald Centre was opened, there has been
an increase in beds for women and children. Shelter beds are a real necessity, particularly during times
of extreme weather. However, it is important to remember that shelters are not permanent housing,
and guests are typically allowed to stay no more than 30 days.
Fig.19 Emergency Shelters
Shelter Number of Beds Mandate
Out of the Cold: 28 Emergency shelter for homeless at risk when
Extreme Weather weather is extreme; -10 degrees Celsius, heavy
Emergency Shelter rain, wind or snow conditions or conditions
Program deemed sever enough to present a substantial
threat to the life or health of homeless persons.
Emerald Center 36 Shelter Beds Emergency shelter for homeless at risk and safety
for women fleeing violence.
Street Services 4 Single Room Units To house homeless youth
YWCA Women 6 rooms with three beds Battered women/children experiencing or at risk
Shelter 2 rooms with 2 beds of violence, or when possible women in other
21
Source: Kamloops Homelessness Action Plan. (2011). Kamloops Non-Profit Housing Inventory 2011.
26crisis situations.
3.2 Attendance & Turn-Away Data
In order to measure demand, or need, various attendance data has been collected from BC Housing and
directly from the shelters.
Canadian Mental Health Association (CMHA) Emerald House & Emerald Hostel
BC Housing has collected usage data from two CMHA shelter facilities, Emerald House and Emerald
Hostel (now combined in the Emerald Center, new shelter data to be included in an addendum to this
report in 2013), and from the YWCA Women’s Shelter. Figure 20 details the information for the
2010/11 and the 2011/12 fiscal year for the CMHA shelters.
Fig.20 CMHA Shelter Attendance Information22
2010/11 2011/12
Emerald Emerald Emerald Emerald
Hostel House Total Hostel House Total
Adult Male (19+) 9,065 - 9,065 11,320 - 11,320
Adult Female (19+) 2 2,951 2,953 8 2,564 2,572
Adult Transgender (19+) - 1 1 - - -
Minor Male - - - 45 - 45
Minor Female - 78 78 - 39 39
Minor Transgender - - - - - -
Children - 3 3 - - -
Others 38 54 92 90 2 92
Total Number of Stays in
Reporting Period 9,105 3,087 12,192 11,463 2,605 14,068
Total Beds Funded by BC
Housing Opened in
Reporting Period 13,870 2,920 16,790 13,908 2,928 16,836
Average Annual %
Occupancy 66% 106% 73% 82% 89% 84%
Number of Unique Clients
During Reporting Period 743 186 929 657 210 866
22
Source: Custom Data Tabulation from: BC Housing, Homelessness Service System. (2012). Emergency Shelter
Program Annual Occupancy Report. BC Housing.
27Summary of CMHA data
In the most recent fiscal year, there were 866 unique clients that spent at least one night at the
Hostel or House. 657 were male and 210 were female. In total, this means that more than 1% of
the Kamloops (CY) population stayed at the shelters for at least one night in 2011/1223.
These individuals accounted for 14,068 “bed stays”. This represents an average annual
occupancy of 84%.
84 of the “bed stays” were minors. It’s difficult to say how many “unique” minors attended. To
demonstrate the issue, 84 bed stays could mean that 84 different minors stayed for one night
each. Alternatively, it could also mean that one minor stayed 84 nights. The truth is likely
somewhere in the middle.
The Average Annual Occupancy was up by 11% in 2011/12 from 73% to 84%. On the other hand,
the number of unique individuals was down by 63. These two facts mean the fewer individuals
were staying for noticeably longer periods in 2011/12.
YWCA Women’s Shelter
YM-YWCA has been operating the women’s shelter since 1974, providing safe housing for women and
children for up to 30 days. Figure 21 shows similar information for the YWCA Women’s Shelter2425:
Fig.21 YWCA Women's Shelter Attendance
Information
2010/11 2011/12
Women 2,808 3,230
Children 1,919 1,885
Total Number of Stays in Reporting
Period 4,727 5,115
Total Beds Funded by BC Housing
Opened in Reporting Period 8,395 8,418
Average % Occupancy 56% 61%
23
Source: Note: It’s very possible that a certain amount of double counting has taken place, which would lead to a
slight over-count. Even so, 866 is a very large amount.
24
Source: BC Housing, Homelessness Service System. (2012). Emergency Shelter Program Annual Occupancy
Report. BC Housing
25
Source: YWCA Women's Shelter. (2012). YWCA Women's Shelter Attendance Reporting . Kamloops
28Number of Unique Clients during the
Reporting Period N/A 480
Referrals Reason for Referral
Women 519 Abuse 321
Children 220 Homeless 161
Total 739 Unknown 36
Number of nights the shelter was Upon departure, where did the women
full/above capacity go after the transition house
April - June 2011 18 Other 84
July - September 2011 0 Private Market Housing 72
October - December 2011 13 Unknown 45
January - March 2012 46 Shelter 17
Another Transition House 6
Subsidized Housing 5
Alcohol/Drug Recovery Services 4
YMCA Findings
The YWCA Shelter sheltered 480 unique individuals during the 2011/2012 fiscal year; 318
women and 162 children.
Those 480 unique clients accounted for 5115 bed stays. This resulted in an average annual
occupancy rate of 61%. This number should be interpreted with caution. Beds are often left
empty due to family sizes. For example, a room may have 4 beds. Said room may have a family
of three, leaving one bed open. This room is now unable to be used for other families, despite
having one bed open. And thus, the average annual occupancy will be lower .
Despite the low average annual occupancy, the shelter had 77 nights throughout the fiscal year
where the shelter was full or over capacity.
There were 739 referrals made to the shelter, of which 519 were adult women. Abuse was the
reason for referral for 319 of the women, homelessness the reason for 161.
From informant interviews with the shelter director, one major problem cited was transitioning
the families to housing after their stays at the shelter. Figure 21 states where the outgoing
clients found housing. 17 of the clients ended up at other, more short term shelters. 72 found
market housing, while only 5 found subsidized housing.
29Extreme Weather Response Program
The Out of The Cold Program is operated on a volunteer basis by the St. Vincent De Paul Society. The
shelter is open on Wednesday and Sunday evenings, run on a volunteer basis by the kind folks from the
St. Vincent De Paul Cathedral. The 28 bed shelter is also opened on nights when temperatures are
below minus ten degrees Celsius with sponsorship through the BC Housing Extreme Weather Response
Program. Because the Out of the Cold is partially a program for extreme weather, the number of nights
open is dependent upon the weather. As shown in Figure 22 26below, the average annual occupancy for
the past two fiscal years has been 51%. The majority of the people who stay at the shelter have been
male in the past. Recent reports from the shelter staff point to new demographics of guests who are
both older and younger than guests in the past.
Fig.22 Cold Weather Shelter Program
Reporting Year (Fiscal) 2010/11 2011/12
Adult Male (19+) 292 193
Adult Female (19+) 48 21
Adult Transgender (19+) 0 0
Malereport methodology was based on a similar study performed in 2009 for the Greater Metro Vancouver
area27. The SPARC study performed 1000 telephone surveys & several interviews with key stakeholders
to understand and estimate the hidden homeless population in Kamloops.
Hidden Homelessness Findings
Between 37 and 352 individuals were in a state of hidden homelessness on the day that they
were called.
Over the previous year, between 808 and 1631 individuals, experienced hidden homelessness at
some point.
24% of the survey respondents indicated a lack of affordable housing as the primary reason for
hidden homelessness.
Fig.23 Reasons for being hidden Kamloops (CY) 2010
homeless
Lack of Available Housing 24%
Transition (Moving/Stranded) 18%
Being in School 15%
Low Income/Can’t Afford Available Housing 15%
Lack of Income/Lack of Employment 12%
Source: SPARC BC
3.4 Homeless Count 2012
In October 2012, Kamloops conducted a homeless count in which the provincial protocol was utilized.
The homeless count measures the number of people sleeping rough and sleeping in shelters28: 99
persons in total were counted homeless. 54 were sleeping in shelters, and 45 were sleeping rough. 54 of
these persons were male, 24 were female, and there were 9 children counted. 73% reported that the
main reason for their homelessness was due to either housing cost or availability, while 35% reported
they had been homeless for 1 - 6 months.
Section 3 Summary Shelters
While shelters are not formal housing, they are a necessity, particularly when the
weather is extreme.
Kamloops has 111 Shelter beds in total.
Anecdotal evidence from shelter managers show that guests are coming from
new demographics such as seniors and youth.
27
Source: Eberle, M., Kraus, D., & Serge, L. (2009). Results of the pilot study to estimate the size of the hidden.
Vancouver: Mustel Research Group, marketPOWER Resarch inc.
28
Source: Kamloops Homelessness Action Plan. (2012). Kamloops Homeless Count Results. Kamloops: HAP
31How do we improve the housing
situation? “More affordable housing,
obviously, and more supportive
housing to help the clients have
better success, allowing them to go
on to free market housing”
Erin Thompson, Kamloops Aboriginal Friendship
Centre
Kamloops Affordable Housing Needs Assessment 2012
Section 4
Temporary
Supported
Housing
Temporary Supported Housing includes Transitional Housing, 2nd Stage Housing, Half-Way Houses, and
Recovery Homes and is defined as housing from 30 days to two or three years in stay, that includes
supports and programming, on or off-site, to help people move towards independence. Transitional
housing is never meant to be permanent, but is meant to provide short term housing and the support
services required for the residents to move on to permanent housing. In order to stay in transitional
housing clients must be enrolled in programming. Some examples of temporary supported housing in
our community include; the New Life Mission recovery programs for men and women, as well as
housing at Georgian Court and the Henry Leland House.
324.1. Supply of Temporary Supported Housing
The following table lists the current supply of transitional housing29. This table does not elaborate on the
varied support services provided by each housing operator.
Fig. 24 Temporary Supported Housing Supply
Housing Agency Partners Units Eligibility
Site / Funders
Canadian Mental BC Housing 11 Transitional Any low income
Emerald
Health Units – Currently individuals including
Center Association unavailable, men, women, children
estimated and youth
available in
2013/2014
John Howard Corrections Services 2 One Bedroom In conflict with law,
Fairview
Society Canada units women-only. Designed
Apart 2 Two Bedroom to support women
units transitioning from
ments custody/incarceration
and reintegrate into
society.
John Howard Forensic Psychiatric 5 One Bedroom Require help with
Formen
Society Services Commission, units medication, support
House Interior Health Authority, due to mental illness,
Ministry of Children and or are in conflict with
Family Development the law. Men only.
John Howard Corrections Services 48 One Bedroom Based on need:
Georgian
Society Canada, BC Housing, units homeless or at risk of
Court Interior Health Authority homeless. Individuals,
persons with mental
illness, students,
aboriginal singles, or
persons in-conflict with
the law. Two year
maximum.
ASK Wellness BC Housing, United Way 15 Bachelor and Persons with
Henry
Centre TNC, Canadian Mental Studio units addictions and
Leland Health Association 13 One Bedroom possibility mental
units illness, no youth or
House children allowed. 2
year maximum.
29
Kamloops Homelessness Action Plan. (2011). Kamloops Non-Profit Housing Inventory 2011. Kamloops: Kamloops
HAP
33New Life Mission na 8 units totalling Faith Based, Long term
House of
14 beds residential recovery.
Ruth Women only, must
complete detox prior
to entry. Residence
includes meals.
Kamloops Safe City of Kamloops, Federal 6 Single Room Persons with
Kamloops
Housing Society Funding, Private Units addictions (minimum
Safe Donations, St. Paul’s 28 days clean). Must
Cathedral be a compatible fit
House with other residents.
Men only, two year
maximum stay.
Abstinence based
housing.
John Howard Corrections Services 7 One Bedroom In-conflict with the
Linkage
Society Canada units law, men only,
House aboriginal singles.
Duration of stay
depends on the
residential
requirements of the
National Parole Board.
John Howard BC Housing, Corrections 18 Bachelor and In conflict with the law,
Light
Society Services Canada, Studio units men only, persons with
house Forensic Psychiatric addictions(dry/not
Services Commission, actively using) and
Interior Health Authority mental illness.
New Life Mission na 28 beds Faith Based, Long term
Men’s
residential recovery.
Outreach Men only, must
complete detox prior
Center to entry. Residence
includes meals.
Interior BC Housing 24 Units (a This building serves
Seymour
Community portion of which youth in transition in
Apart Services are dedicated to addition to providing
youth) permanent supported
ments and unsupported
housing.
The above table accounts for 187 units of transitional for housing for varying demographics. A large
portion of the housing units are for people who are in-conflict with the law, or suffering from addictions
and/or mental illnesses. The John Howard Society is the largest provider of this type of housing,
34You can also read