GUN VIOLENCE: An issue of public health and public safety - Safe Tennessee Project
←
→
Page content transcription
If your browser does not render page correctly, please read the page content below
Safe Tennessee Project
Working together for a safer Tennessee

                      TENNESSEE
                        GUN              VIOLENCE:
                              An issue of public health
                                     and public safety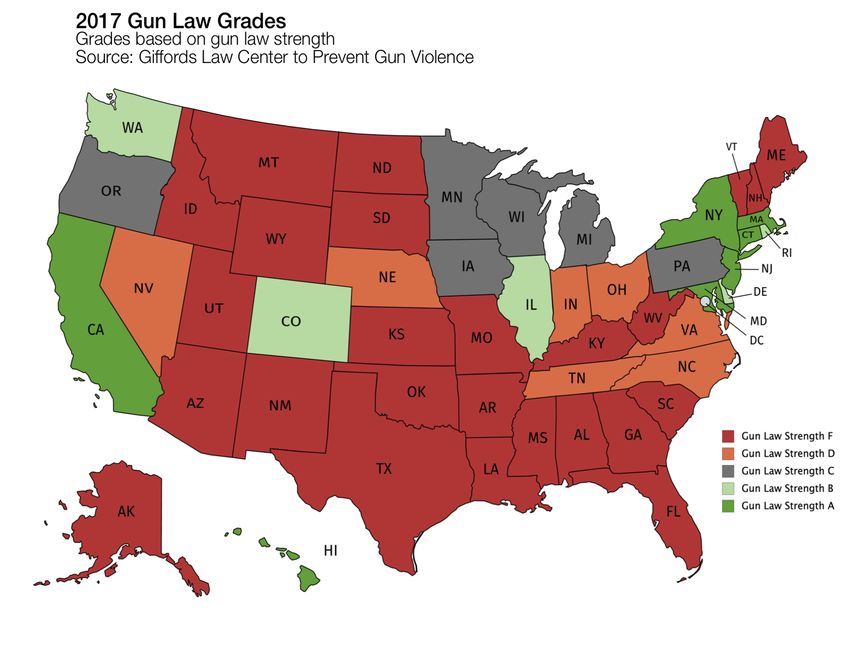
Table of
Contents:
Introduction…………………………………………………………………….1
1
US Gun Violence………………………………………………………………2
2
Tennessee Gun Violence……………………………………………………..3
4
Cities with Highest Homicide Rates…………………………………………4
5
Tennessee Firearm Mortality: 2007 - 2017………………………………….
6
Tennessee Firearm Homicide: 2007 - 2017………………………………..7
Tennessee Firearm Injury Data: 2007 - 2017………………………………8
Tennessee Firearm Fatalities by County…………………………………..10
Tennessee Firearm Injury by County………………………………………12
Guns and Domestic Violence………………………………………………..
14
When Men Murder Women in Tennessee: 2007 - 2017………………….15
Youth Gun Violence………………………………………………………..…16
Tennessee Youth Gun Deaths: 2007 - 2017……………………………….17
Homicide in Communities of Color…………………………………………20
Black Homicide Victimization in Tennessee: 2006 - 2016……………….21
Child Access Prevention……………………………………………………..
22
When Tennessee Kids Pull the Trigger………………………………………
23
Firearm Suicide………………………………………………………………..
25
Firearm Suicide in Tennessee: 2007 - 2017……………………………….26
Mass Shootings……………………………………………………………….
28
Mass Shootings in Tennessee: 2014 - 2019………………………………29
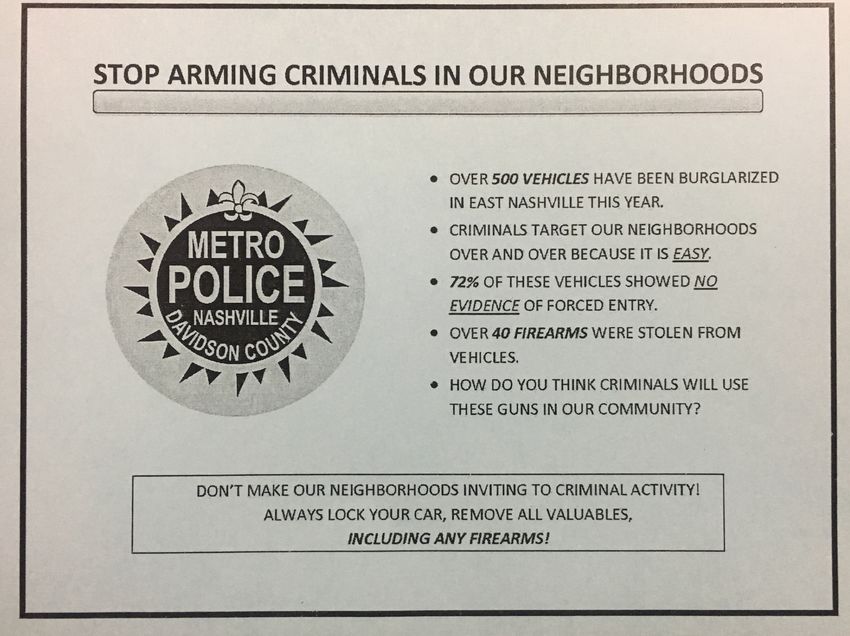
Gun Thefts from Cars in Tennessee………………………………………..30
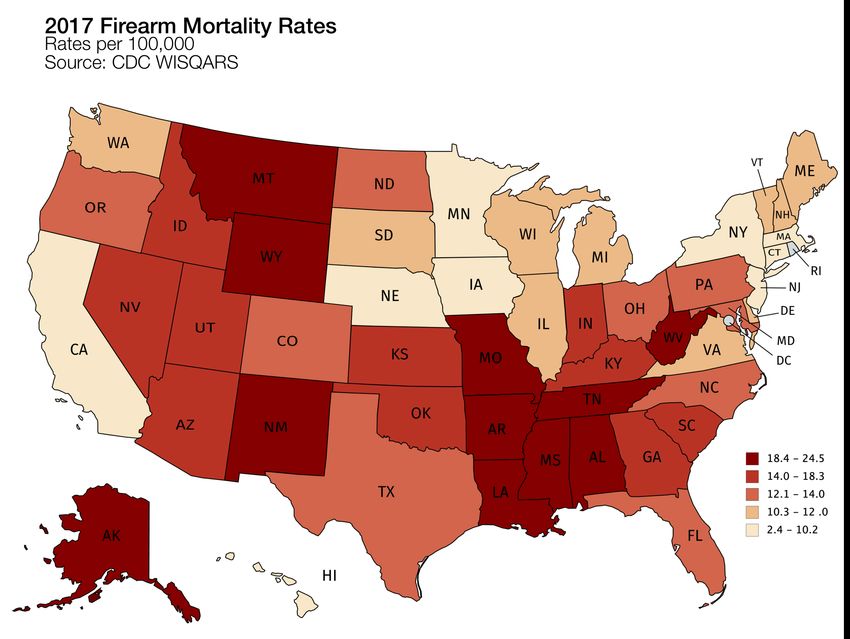
Firearm Mortality Rates and Gun Law Grades…………………………….
35
Academic Research on Relationship Between
Gun Laws and Gun Death……………………………………………………36
Policy and Program Recommendations to Reduce Gun Violence………
39
Expanded Background Checks……………………………………………..
40
Extreme Risk Protection Orders……………………………………………..
46
Strengthen Firearm Dispossession………………………………………….
53
MaKayla’s Law…………………………………………………………………
58
Guns in Vehicles……………………………………………………………….
65
Investing in Intervention: Interrupting Cycles of Violence………………..66
Investing in Prevention: Public Service Announcements…………………
67
Investing in Research: Understanding the Problem………………………68
APPENDIX
Tennessee Gun Permit Data……………………………………………… 70
Data contained in this report comes from The Centers for Disease Control, The Tennessee Department of Health, FBI
Supplemental Homicide Reports, the Tennessee Bureau of Investigation, The Gun Violence Archive, and the Tennessee
Department of Safety, as well as The Giffords Law Center to Prevent Gun Violence, the Coalition to Stop Gun Violence and
the Education Fund to Stop Gun Violence
The Safe Tennessee Project is a nonpartisan nonprofit organization made up of physicians, academics, public health
researchers, domestic violence advocates, suicide prevention experts, attorneys, and concerned citizens who view gun
violence as a public health issue and who advocate for evidenced-based solutions to reduce the number of
Tennesseans injured and killed with firearms.
Gun violence is a public
health issue
In 2017, nearly 40,000 Americans died from gun violence —
109 every single day. In 2017, 1,246 Tennesseans died from
gun violence, 3.4 people every day.

 Americans are 25 times more likely to die by firearm-related
homicide and eight times more likely to die by firearm-
related suicide compared to other economically developed
nations.

If an illness were killing our friends, family, and neighbors at
such an alarming rate, we would not hesitate to label it a
crisis.

And that’s what gun violence is. It’s a public health crisis.

Public health encompasses any threats to a person’s life and wellbeing that can be prevented, contained or
treated.

For far too long, gun violence has been a leading cause of injury and death in our country, our state and our
city, but it can be prevented through focused interventions for individuals who need them the most.

This approach is not new; the U.S. dramatically decreased injury rates from car accidents for adults, children
and babies by engaging in robust study of the issue, and ultimately making vehicles safer, making car seats
safer, passing laws requiring seat belts, lowering speed limits, and passing DUI laws.

The public health approach to gun violence reduction does not replace nor is it at odds with law
enforcement. Its focus is just different: not deterrence but prevention by addressing the root causes of gun
violence.

Communities around the country and world integrate public health into public policy challenges.

Our country - and our state - should do the same.

SAFETENNESSEEPROJECT.ORG                                                                                    "1
U.S. Gun
Violence                                                                             ONE MILLION
                                                                                     Americans have been shot
                                                                                     in the last decade.
On average, 100 Americans are killed with guns every day.

Over 36,000 Americans are killed by guns each year, and 100,000 are shot and
injured.                                                                             GUN VIOLENCE IN
                                                                                     AMERICA

The overall gun death rate has remained relatively stable for more                   Americans are 25 times
than a decade, with decreases in gun homicides offset by increases in                more likely to be killed in a
gun suicides.                                                                        gun homicide than
                                                                                     residents of other high
But that is starting to change.
                                                                                     income countries.
In 2017, gun deaths reached their highest level in at least 40 years, with 39,773
deaths that year alone.
                                                                                     Women in the U.S. are 21
Gun deaths increased by 16% from 2014 to 2017. Nonfatal firearm injuries are also    times more likely to be
on the rise.                                                                         killed with a gun than
                                                                                     women in peer nations.
National gun violence rates obscure the true levels of violence in certain places,
particularly in underserved communities of color.
                                                                                     Americans are ten times
                                                                                     more likely to die by gun
                                                                                     suicide than people in other
Gun violence has an outsized economic impact on Americans beyond
                                                                                     high income countries.
the devastating human toll it wreaks on society.

Economists estimate that gun violence costs the American economy at least $229       Across 29 high income
billion every year, including $8.6 billion in direct expenses.                       countries, 93 percent of
                                                                                     kids ages 0-14 years old
Gun violence costs each American roughly $700 every year.                            killed with guns are from
                                                                                     America.

SAFETENNESSEEPROJECT.ORG                                                                                   "2
DOMESTIC VIOLENCE
For the millions of American women and their children affected by domestic violence every year, guns in
the hands of domestic abusers pose a serious and lethal threat.

• Each year, 600 women in America are shot and killed by an intimate partner, and millions of women have
  been nonfatally shot or threatened with a gun by an intimate partner.
• When an abuser has access to a gun, a domestic violence victim is five times more likely to be killed.

YOUTH GUN VIOLENCE
Beyond the young lives cut short and debilitating injuries, exposure to gun violence can cause lasting
trauma, psychological distress, and decreased potential among children.

• Each year, nearly 1,500 minors are killed by guns, and three million children are directly exposed to gun
  violence.
• Young children are most affected by gun homicides in the home—often related to domestic or family
  violence. Older children are at increased risk of gun suicide and gun homicides.

BLACK HOMICIDE VICTIMIZATION
The gun violence epidemic hits underserved communities of color particularly hard. Gun homicide rates
in these neighborhoods have reached a crisis point.

• Gun homicides are concentrated in cities, and within cities, gun violence is further clustered among racially
segregated, economically disenfranchised neighborhoods.
• Black Americans are 10 times more likely than white Americans to die by gun homicide.

CHILD ACCESS PREVENTION
Millions of homes contain unsafely stored guns, and few states require safety training for handling
firearms, contributing to unintentional shooting injuries and deaths, particularly among young people.

• The majority of unintentional shooting deaths involve people under 24, who are most often shot by
  someone else, usually someone their own age.
• The vast majority of unintentional firearm deaths among children are related to child access to firearms —
  either self-inflicted or at the hands of another child.

FIREARM SUICIDE
The majority of gun deaths are self-inflicted. The easy availability of firearms to those in distress makes
suicide attempts far more likely to result in death.

•   More than half of all suicides in the United States are carried out with a firearm.
•   White men comprise 74% of gun suicide victims.
•   Gun suicides also have a disproportionate impact on young adults, older Americans, and veterans.
•   Access to a gun triples the risk of suicide death.

MASS SHOOTINGS
While mass shootings with high casualty numbers gain the most media attention, most mass shootings
are related to domestic violence, workplace violence or are the result of an altercation.

• In the past few years, the U.S. has averaged one mass shooting (four or more people shot in a single
  incident) every one to two days.
• So far in 2019, there have been more mass shootings than days.

SAFETENNESSEEPROJECT.ORG                                                                                       "3

TENNESSEE IS
Tennessee                                                                                 RANKED:
Gun Violence
                                                                                          3rd most dangerous state,
                                                                                          according to the FBI
On average, 3.4 Tennesseans are killed with guns every day.                               Uniform Crime Report

Last year, 1,246 Tennesseans were shot and killed - the highest number on record.
                                                                                          11th in firearm mortality,
                                                                                          according to CDC data

The rate of gun death in Tennessee is significantly higher than the U.S.
average.                                                                                  7th in firearm homicide,
The single greatest increase in both the number of firearm fatalities and the rate of     according to CDC data
gun death occurred between 2016 and 2017.

After experiencing a slight decrease in 2014, Tennessee gun deaths have spiked.           5th for women murdered
                                                                                          by men, according to the
                                                                                          Violence Policy Center
The growing gun violence in Tennessee is a strain on law enforcement

In 2017, the Tennessee Bureau of Investigation published Firearm Violence in              4th for firearm mortality,
Tennessee: 2013 - 2016. Director Gwyn noted:                                              ages 0-19, according to
                                                                                          CDC data
“I am deeply concerned with the findings of this report reflecting a substantial
increase in firearm related crimes in our state This increase puts an additional strain
on Tennessee’s law enforcement and poses a serious threat to public safety.”
                                                                                          4th for firearm homicide,
                                                                                          ages 0-19, according to
                                                                                          CDC data
Gun violence impacts Tennessee economically.

The Giffords Law Center to Prevent Gun Violence estimates that gun violence costs         8th for black homicide,
Tennessee taxpayers $6 billion per year. The costs come from emergency care and           according to the Violence
other medical care, as well as, court and prison costs, and indirect costs which
                                                                                          Policy Center
include impacts on productivity and quality of life for victims and their communities

Gun violence costs each Tennessean approximately $928 every year.                         19th in firearm suicide,
                                                                                          according to CDC data

                                                                                          12th in firearm suicides,
                                                                                          ages 0-19, according to
                                                                                          CDC data

SAFETENNESSEEPROJECT.ORG                                                                                      "4
Rates of Homicide
in U.S. Cities
There is no city more synonymous with violence in the United States than Chicago. To be sure, Chicago has a high
number of murders: the city often records the highest absolute total killings each year. But, the data tells us that
Chicago’s murder rate is nowhere near the nation’s worst. On a per-capita basis — murders per 100,000 residents — the
city regularly experiences fewer killings than places whose murder rates get far less national attention, including
Memphis.

                     TOP TWENTY CITIES WITH THE HIGHEST HOMICIDE RATES: 2017
                                             SOURCE: FBI UNIFORM CRIME REPORT

     St. Louis                                                                                         66.1
    Baltimore                                                                           55.8
       Detroit                                                         39.8
 New Orleans                                                           39.5
  Kansas City                                                   30.9
    Cleveland                                            27.8
    Memphis                                             27.7
      Newark                                            27.1
     Chicago                                     24.1
    Cincinnati                                  23.4
 Philadelphia                            20.1
   Milwau kee                           19.8
   Pittsburgh                           18
  Indianapolis                     17.9
    Stockton                       17.8
        Tulsa                     17.3
         D.C.                    16.7
       Atlanta                   16.4
   Columbus                      16.3
     Nashville                   16.3

                 0          10                  20                30          40   50             60            70

• Memphis broke a 20-year homicide record in 2016

• Knoxville broke a 19-year homicide record in 2017

• Nashville saw a nearly 160 percent increase in homicides between 2013 and 2017

SAFETENNESSEEPROJECT.ORG                                                                                             "5
Tennessee Firearm
Mortality: 2007 - 2017
Firearm mortality includes all forms of fatal gun violence: all violence-related fatal shootings, including
homicides, fatal domestic violence shootings, and legal intervention, as well as firearm suicides, unintentional
shootings, and shootings where the intent or motive is undetermined.

• Based on this data, on average, 3.4 Tennesseans die every day from gun violence, or one person every 7.1
  hours

• In 2017, Tennessee ranked 11th in the nation for firearm mortality

• Between 2007 and 2017, firearm mortality in Tennessee increased 20 percent

                                                               TN FIREARM MORTALITY RATES: ALL INTENTS, ALL AGES
 TN FIREARM MORTALITY RATES:                                                      2007-2017

 ALL INTENTS, ALL AGES                           20.0

                         TN    US
  Year      Deaths
                        Rate  Rate               18.0
  2007        924       14.74 10.24
  2008        985       15.46 10.23              16.0
  2009        966       15.06 10.05
  2010        932       14.42 10.07
                                                 14.0
  2011        948       14.40 10.16
  2012        995       14.95 10.45
  2013       1030       15.41 10.37              12.0

  2014       1016       15.11 10.26
  2015       1075       15.95 11.02              10.0
  2016       1148       16.99 11.71
  2017       1246       18.45 11.95               8.0
 Rates are per 100,000 people                           2007    2008   2009   2010   2011    2012   2013   2014   2015   2016   2017

                                                 Data Source: CDC                       TN          US

SAFETENNESSEEPROJECT.ORG                                                                                                               "6
Tennessee Firearm
Homicide: 2007 - 2017
Firearm homicide includes any murder committed with a firearm, whether the murder is the result of an
altercation, a domestic situation, a road rage shooting, or committed during the commission of a criminal act,
such as an armed robbery or retaliatory shooting.

• In 2017, Tennessee ranked 7th in the nation for firearm homicide

• Between 2007 and 2017, firearm homicide in Tennessee increased 24 percent

 TN FIREARM HOMICIDE RATES:                                              TN FIREARM HOMICIDE RATES: ALL AGES
 ALL AGES                                                                             2007-2017
                         TN                    US    8.5
  Year      Deaths
                        Rate                  Rate
  2007        343       5.61                  4.20   7.5
  2008        346       5.48                  4.03
  2009        347       5.56                  3.78
                                                     6.5
  2010        293       4.67                  3.62
  2011        309       4.96                  3.59
  2012        327       5.17                  3.76   5.5

  2013        309       4.89                  3.60
  2014        315       4.96                  3.53   4.5
  2015        363       5.72                  4.14
  2016        434       6.73                  4.59   3.5
  2017        467       7.40                  4.60
 Rates are per 100,000 people
                                                     2.5
                                                           2007   2008   2009   2010   2011    2012   2013   2014   2015   2016   2017

 TN FIREARM HOMICIDE: 2007 - 2017                    Data Source: CDC                     TN          US
 COUNTIES WITH HIGHEST RATES

  County            Deaths               Rate
  Shelby         1,493                  14.55
   Clay           11                    12.71
Hardeman          28                     9.46
Lauderdale        25                     8.35
 Madison          100                    8.17
Rates are per 100,000 people
Data Source: Tennessee Department of Health

SAFETENNESSEEPROJECT.ORG                                                                                                                 "7
Tennessee Firearm
Injury Data: 2007 - 2017
Below is data from the Tennessee Department of Health reflecting firearm injury data, including firearm injury
data from all intents, firearm injury data from assaults, and firearm injury data from unintentional shootings.

 TN FIREARM INJURY RATES: ALL                                           TN FIREARM INJURY RATES
                                                                               2007 - 2017
    Year         Injuries        Rate            50.00

   2007           2,539          41.69           48.00

   2008           2,532          41.21           46.00
   2009           2,337          37.68
                                                 44.00
   2010           2,269          35.75
   2011           2,377          37.12           42.00
   2012           2,397          37.13
                                                 40.00
   2013           2,405          37.02
   2014           2,503          38.22           38.00
   2015           2,683          40.65
                                                 36.00
   2016           2,752          41.38
   2017           3,192          47.53           34.00

 Rates are per 100,000 people                    32.00

                                                 30.00
                                                         2007   2008   2009   2010   2011   2012   2013   2014   2015   2016   2017

 TN FIREARM INJURY RATES: ASSAULT                                 TN FIREARM ASSAULT INJURY RATES
                                                                             2007 - 2017
    Year         Injuries        Rate            18.00

   2007            907           14.89           17.00
   2008            991           16.13
   2009           1,044          16.83
                                                 16.00
   2010            825           13.00
   2011           1,002          15.65
                                                 15.00
   2012            964           14.93
   2013            905           13.93
                                                 14.00
   2014           1,076          16.43
   2015            991           15.01
                                                 13.00
   2016            899           13.52
   2017           1,046          15.58
                                                 12.00
 Rates are per 100,000 people

 TN FIREARM INJURIES - ASSAULT:                  11.00
                                                         2007   2008   2009   2010   2011   2012   2013   2014   2015   2016   2017
 2007 - 2017
 COUNTIES WITH HIGHEST RATE
  County         Injuries        Rate
   Shelby         4,254          41.45
 Davidson         2,388          33.86
  Madison          318           29.51
 Hardeman           73           24.67
 Hamilton          907           24.25
 Rates are per 100,000 people

SAFETENNESSEEPROJECT.ORG                                                                                                              "8
TN FIREARM INJURY RATES: TN UNINTENTIONAL FIREARM INJURY RATES
UNINTENTIONAL SHOOTINGS 2007 - 2017
Year Injuries Rate 30.00
2007 1,179 19.36 28.00
2008 1,134 18.45 26.00
2009 896 14.45
24.00
2010 941 14.83
2011 962 15.02 22.00
2012 1,021 15.81
20.00
2013 1,008 15.52
2014 1,053 16.08 18.00
2015 1,251 18.95
16.00
2016 1,503 22.60
2017 1,836 27.34 14.00
Rates are per 100,000 people 12.00
10.00
TN FIREARM INJURIES - 2007 2008 2009 2010 2011 2012 2013 2014 2015 2016 2017
UNINTENTONAL SHOOTINGS:
2007-2017
COUNTIES WITH HIGHEST RATE
County Injuries Rate
Lauderdale 119 39.76
Shelby 3,479 33.90
Grundy 42 27.66
Johnson 53 26.70
Cocke 100 25.59
Rates are per 100,000 people
Data Source: Tennessee Department of Health, Office of Vital Records and Statistics, Death Statistical System 2007-2017.
Data Source: Tennessee Department of Health, Division Population Health Assessment, Hospital Discharge Data System 2007-2017.
Data Source: Tennessee Department of Health, Division Population Health Assessment; based on interpolated data from the U.S. Census, Annual
Estimates of the Resident
Data Source: Tennessee Department of Health, Division Population Health Assessment; based on interpolated data from the U.S. Census, Annual
Estimates of the Resident
Produced By: Tennessee Department of Health, Office of Population Health Surveillance, Injury Surveillance Program
SAFETENNESSEEPROJECT.ORG "9Tennessee Firearm Fatalities by County:
Years 2009-2011; 2012-2014; 2015 -2017
TOP FIVE COUNTIES WITH HIGHEST RATES OF FIREARM FATALITIES: 2015-2017
County Deaths Rate
Clay 13 55.95
Lewis 15 41.92
Scott 22 33.41
Benton 14 29.08
Polk 14 27.84
Rates are per 100,000 people
FIREARM FATALITIES
2009-2011 2012-2014 2015-2017
Count Rate Count Rate Count Rate
Anderson 36 16.05 29 12.80 32 14.04
Bedford 20 14.67 12 8.69 23 16.11
Benton - - - - 14 29.08
Bledsoe - - - - 11 25.07
Blount 33 8.94 53 14.11 49 12.70
Bradley 35 11.85 37 12.09 41 13.05
Campbell 13 10.60 14 11.61 15 12.59
Cannon - - - - 11 26.12
Carroll 16 18.51 - - 15 17.89
Carter 25 14.36 30 17.48 21 12.39
Cheatham 27 22.73 19 16.03 31 25.84
Chester - - - - - -
Claiborne 27 28.03 22 23.18 23 24.18
Clay - - - - 13 55.95
Cocke 22 20.51 15 14.10 23 21.71
Coffee 26 16.35 29 18.10 21 12.81
Crockett - - - - - -
Cumberland 30 17.98 41 23.77 40 22.73
Davidson 263 14.19 267 13.52 378 18.40
Decatur - - - - - -
DeKalb 17 30.10 - - 11 18.84
Dickson 23 15.55 21 13.89 38 24.28
Dyer 12 10.44 14 12.24 13 11.50
Fayette 16 13.97 15 12.89 21 17.68
Fentress 16 29.74 - - - -
Franklin 23 18.52 19 15.41 15 12.02
Gibson 27 18.19 26 17.50 28 18.93
Giles 17 19.20 21 24.23 18 20.54
Grainger - - - - - -
Greene 33 16.08 33 16.06 29 14.08
Grundy - - - - - -
Hamblen 33 17.56 21 11.12 31 16.19
Hamilton 136 13.69 152 14.54 185 17.23
Hancock - - - - - -
Hardeman 19 22.83 14 17.76 14 18.28
Hardin 15 19.12 22 28.26 11 14.23
Hawkins 32 18.63 26 15.28 25 14.75
Haywood - - - - - -
SAFETENNESSEEPROJECT.ORG "10Henderson 14 16.87 - - 16 19.14
Henry 22 22.70 27 27.90 25 25.79
Hickman 14 18.90 - - 11 14.96
Houston - - - - . .
Humphreys 16 28.69 13 23.79 - -
Jackson 11 32.19 - - - -
Jefferson 21 13.59 18 11.47 16 9.96
Johnson - - 15 27.83 - -
Knox 174 13.49 184 13.79 202 14.75
Lake - - - - - -
Lauderdale 17 20.45 15 18.09 15 18.99
Lawrence 27 21.46 16 12.67 20 15.50
Lewis - - 11 30.75 15 41.92
Lincoln 12 11.97 - - 16 15.82
Loudon 17 11.83 16 10.60 18 11.63
McMinn 24 15.17 23 14.61 28 17.68
McNairy 16 20.46 15 19.09 15 19.22
Macon - - 14 20.53 19 26.88
Madison 42 14.24 57 19.28 52 17.75
Marion 15 17.72 11 12.93 15 17.57
Marshall 21 22.97 13 13.94 13 13.49
Maury 43 17.64 37 14.72 35 12.97
Meigs - - - - - -
Monroe 24 17.74 21 15.49 21 15.22
Montgomery 71 14.14 90 16.11 115 19.51
Moore - - - - - -
Morgan 20 31.09 12 18.33 12 18.56
Obion 11 11.45 14 14.99 14 15.28
Overton - - 19 28.66 14 21.16
Perry - - - - - -
Pickett - - - - - -
Polk - - - - 14 27.84
Putnam 24 11.13 29 13.13 43 18.85
Rhea 13 13.69 17 17.46 19 19.45
Roane 25 15.43 35 21.98 26 16.39
Robertson 30 15.09 35 17.29 29 13.95
Rutherford 88 11.36 89 10.54 100 10.82
Scott - - 13 19.66 22 33.41
Sequatchie - - - - - -
Sevier 33 12.38 32 11.38 42 14.47
Shelby 503 18.01 592 21.00 695 24.74
Smith - - - - - -
Stewart 13 32.40 17 42.58 - -
Sullivan 53 11.32 70 14.88 70 14.87
Sumner 40 8.33 64 12.61 94 17.42
Tipton 13 7.12 22 11.90 37 20.05
Trousdale - - - - - -
Unicoi - - 13 23.97 11 20.62
Union - - 15 26.18 16 27.75
Van Buren - - - - - -
Warren 16 13.23 18 15.03 23 18.91
Washington 43 11.80 48 12.74 45 11.79
Wayne 11 21.52 - - - -
Weakley 19 18.33 18 17.37 23 22.82
White 20 25.98 14 17.81 16 20.01
Williamson 40 7.35 57 9.55 49 7.46
Wilson 24 7.06 39 10.65 53 13.31
Counts and rates based on counts less than eleven are suppressed. These are indicated with a '-'.
''.' indicates a count and rate of zero.
Data Source: Tennessee Department of Health, Office of Vital Records and Statistics, Death Statistical System 2007-2017.
Data Source: Tennessee Department of Health, Division Population Health Assessment, Hospital Discharge Data System 2007-2017.
Data Source: Tennessee Department of Health, Division Population Health Assessment; based on interpolated data from the U.S. Census, Annual Estimates of the Resident
Data Source: Tennessee Department of Health, Division Population Health Assessment; based on interpolated data from the U.S. Census, Annual Estimates of the Resident
Produced By: Tennessee Department of Health, Office of Population Health Surveillance, Injury Surveillance Program.
SAFETENNESSEEPROJECT.ORG "11Tennessee Firearm Injuries by County:
Years 2009-2011; 2012-2014; 2015 -2017
TOP FIVE COUNTIES WITH HIGHEST RATES OF FIREARM INJURIES: 2015-2017
County Injuries Rate
Shelby 3,132 111.47
Lauderdale 68 86.09
Madison 200 68.28
Haywood 36 67.37
Davidson 1,341 65.27
Rates are per 100,000 people
FIREARM INJURIES
2009-2011 2012-2014 2015-2017
Count Rate Count Rate Count Rate
Anderson 40 17.83 40 17.66 41 17.99
Bedford 29 21.28 25 18.10 33 23.11
Benton 18 36.37 - - 15 31.16
Bledsoe 16 40.98 11 27.82 18 41.03
Blount 48 13.00 61 16.24 43 11.14
Bradley 49 16.59 53 17.32 69 21.96
Campbell 35 28.54 30 24.88 26 21.83
Cannon 12 28.98 12 29.02 19 45.12
Carroll 25 28.92 13 15.25 21 25.04
Carter 39 22.39 34 19.82 39 23.02
Cheatham 24 20.20 27 22.77 38 31.68
Chester 13 25.62 14 26.99 - -
Claiborne 32 33.22 27 28.45 22 23.13
Clay - - - - 12 51.65
Cocke 55 51.28 28 26.31 34 32.10
Coffee 29 18.24 30 18.72 43 26.22
Crockett - - - - 24 55.19
Cumberland 34 20.38 43 24.93 41 23.30
Davidson 1146 61.84 1065 53.92 1341 65.27
Decatur 11 31.49 - - 12 34.10
DeKalb 18 31.87 23 40.11 24 41.10
Dickson 31 20.96 34 22.48 33 21.08
Dyer 44 38.26 48 41.95 64 56.60
Fayette 51 44.52 20 17.19 42 35.35
Fentress 24 44.62 21 39.12 11 20.35
Franklin 20 16.11 27 21.90 27 21.64
Gibson 62 41.78 38 25.58 62 41.91
Giles 21 23.72 20 23.07 25 28.53
Grainger 12 17.51 24 35.17 - -
Greene 59 28.75 50 24.34 41 19.90
Grundy 23 54.83 18 44.41 19 47.30
Hamblen 31 16.49 26 13.77 19 9.92
Hamilton 402 40.48 484 46.30 583 54.31
Hancock - - - - - -
Hardeman 35 42.05 53 67.24 45 58.76
Hardin 20 25.49 24 30.83 41 53.05
Hawkins 57 33.18 26 15.28 34 20.06
Haywood 25 43.99 25 45.76 36 67.37
Henderson 24 28.91 23 27.36 24 28.71
SAFETENNESSEEPROJECT.ORG "12Henry 21 21.67 18 18.60 27 27.86
Hickman 21 28.35 16 21.97 17 23.12
Houston - - - - - -
Humphreys 11 19.73 - - 16 29.10
Jackson - - - - - -
Jefferson 17 11.00 20 12.74 25 15.57
Johnson 16 29.15 19 35.25 16 30.05
Knox 322 24.96 377 28.25 318 23.22
Lake - - - - - -
Lauderdale 57 68.55 44 53.08 68 86.09
Lawrence 33 26.23 20 15.83 25 19.37
Lewis - - - - - -
Lincoln 19 18.95 28 27.78 22 21.75
Loudon 22 15.30 22 14.57 14 9.05
McMinn 29 18.33 34 21.60 44 27.78
McNairy 16 20.46 21 26.72 22 28.19
Macon 17 25.29 30 43.99 - -
Madison 140 47.47 207 70.03 200 68.28
Marion 20 23.62 35 41.13 30 35.14
Marshall 21 22.97 24 25.73 25 25.93
Maury 72 29.54 42 16.71 71 26.31
Meigs 15 42.19 11 31.37 - -
Monroe 35 25.87 37 27.28 29 21.02
Montgomery 145 28.88 144 25.78 196 33.26
Moore - - - - - -
Morgan 26 40.41 29 44.31 17 26.29
Obion 23 23.94 15 16.06 28 30.57
Overton 16 24.50 12 18.10 15 22.67
Perry - - - - 11 46.08
Pickett - - - - - -
Polk - - 16 31.95 17 33.80
Putnam 30 13.91 22 9.96 37 16.22
Rhea 26 27.38 15 15.40 25 25.60
Roane 29 17.90 20 12.56 32 20.17
Robertson 96 48.30 80 39.53 79 38.00
Rutherford 157 20.27 171 20.25 243 26.30
Scott 26 38.82 - - 11 16.70
Sequatchie 11 26.20 - - - -
Sevier 35 13.13 49 17.43 37 12.75
Shelby 2255 80.73 2649 93.97 3132 111.47
Smith 16 27.70 13 22.74 24 41.14
Stewart 14 34.90 - - - -
Sullivan 79 16.88 83 17.64 95 20.19
Sumner 61 12.70 63 12.41 105 19.46
Tipton 55 30.12 55 29.74 81 43.89
Trousdale - - - - - -
Unicoi 15 27.59 - - - -
Union 11 18.87 - - 15 26.02
Van Buren - - - - - -
Warren 32 26.47 18 15.03 42 34.53
Washington 51 14.00 50 13.27 76 19.92
Wayne - - 14 27.51 - -
Weakley 21 20.26 18 17.37 27 26.79
White 13 16.89 22 27.98 16 20.01
Williamson 49 9.00 38 6.36 63 9.59
Wilson 78 22.95 66 18.02 105 26.37
Counts and rates based on counts less than eleven are suppressed. These are indicated with a '-'.
''.' indicates a count and rate of zero.
Data Source: Tennessee Department of Health, Office of Vital Records and Statistics, Death Statistical System 2007-2017.
Data Source: Tennessee Department of Health, Division Population Health Assessment, Hospital Discharge Data System 2007-2017.
Data Source: Tennessee Department of Health, Division Population Health Assessment; based on interpolated data from the U.S. Census, Annual Estimates of the Resident
Data Source: Tennessee Department of Health, Division Population Health Assessment; based on interpolated data from the U.S. Census, Annual Estimates of the Resident
Produced By: Tennessee Department of Health, Office of Population Health Surveillance, Injury Surveillance Program.
SAFETENNESSEEPROJECT.ORG "13Guns and
Domestic Violence 5th
Tennessee is ranked 5th in
Firearms and domestic violence are a lethal combination – injuring and killing the nation for women
women, children, and bystanders every day in the United States. The deadly murdered by men,
intersection between guns and domestic violence is an all too common according to The Violence
occurrence and a uniquely American problem. Policy Center.
The presence of a gun in a domestic violence situation increased the risk of
81%
homicide for the woman by 500%.
Even when a weapon is not discharged, abusers often use the mere presence of
a gun to coerce, intimidate and terrorize victims, inflicting enormous psychological of Americans support
damage. Abusers use guns to threaten and control their victims even if they never legislation that keeps guns
pull the trigger, and these forms of abuse have severe effects on survivors. away from domestic
abusers
A paper published in 2017 noted that:
600
“The fear of a firearm threat is significantly associated with post-traumatic stress
disorder (PTSD). It’s stronger even than the link between physical or sexual abuse
and PTSD.”
women in America are shot
Despite the clear risk domestic violence presents, state and federal laws still make and killed by an intimate
it far too easy for abusers to obtain firearms, or to regain access to guns they partner - that’s one woman
have dispossessed to someone else. every 16 hours, according
to FBI Crime Reporting
Existing loopholes in federal and state law leave guns in the hands of dangerous
domestic abusers and stalkers, often with deadly results. Protecting the lives of data.
women and their children requires that lawmakers take steps to make it as
55%
difficult as possible for dangerous abusers and stalkers to gain access to
firearms.
Across the country, a number of states have adopted stronger domestic violence of intimate partner
laws. A robust body of research shows that these laws are associated with homicides are committed
significant reductions in intimate partner homicides. with firearms, according to
FBI crime reporting data.
4.5million
Women in America have
been threatened with a gun
by an intimate partner, and
nearly 1 million women alive
today have survived being
shot by an intimate partner.
SAFETENNESSEEPROJECT.ORG "14When Men Murder Women
in Tennessee: 2007 - 2017
Tennessee is one of the most dangerous states for women.
When Men Murder Women is an annual report prepared by the Violence Policy Center detailing homicides
committed by males against females in single victim/single offender incidents. The study analyzes the most
recent Supplementary Homicide Report (SHR) data submitted to the Federal Bureau of Investigation. The
data below is from the years 2007 - 2017, the last year for which data was available.
While not all homicides were committed with firearms, the majority of Tennessee women were shot and
killed. Tennessee has consistently ranked as a state with extremely high rates of women murdered by men,
ranking in the top ten every year but 2007 when the state ranked 12th. Tennessee’s rate far outpaces the
U.S. average
TENNESSEE WOMEN MURDERED BY MEN: 2007 - 2017
TN Rate US Rate per Black White % Killed with % Victims Who
Year Rank Deaths
per 100k 100k Victims Victims Guns Knew Offender
2017 5 69 2.01 1.29 22 47 76 90
2016 5 65 1.91 1.20 30 35 52 95
2015 4 71 2.10 1.12 27 44 71 96
2014 9 53 1.58 1.08 16 36 69 96
2013 6 55 1.65 1.09 21 33 63 98
2012 10 53 1.60 1.16 21 31 50 100
2011 6 59 1.80 1.17 25 33 56 93
2010 3 62 1.91 1.22 16 45 51 98
2009 5 59 1.83 1.25 19 39 52 98
2008 5 63 1.97 1.26 28 35 56 95
2007* 12 59 1.87 1.3 n/a n/a n/a n/a
TENNESSEE WOMEN MURDERED BY MEN PER 100K
2007 - 2017
2.2
2
1.8
1.6
1.4
1.2
1
2007 2008 2009 2010 2011 2012 2013 2014 2015 2016 2017
TN US
POLICY RECOMMENDATIONS:
Expand background checks for all gun sales
Strengthen firearm dispossession laws and procedures
Implement extreme risk protection orders
Provide funding for research to study key drivers of gun violence in Tennessee
SAFETENNESSEEPROJECT.ORG "15Youth Gun
Violence
4th
Tennessee is 4th in the
nation for firearm mortality
for young people between
In 2017, over American 3,400 children and teens (ages 0 to 19) were shot. And the ages of 0 and 19,
the effects of gun violence extend far beyond those struck by a bullet: an
according to data from the
estimated three million children witness a shooting each year, according to
research published in JAMA Pediatrics. Gun violence shapes the lives of the CDC.
children who witness it, know someone who was shot, or live in fear of the next
shooting.
A recent study published in the the Journal of the American College of Surgeons
found that firearm-related injuries are the second leading cause of pediatric death
2,462
American school age
in the U.S.
children were killed with
In 2018, JAMA Pediatrics published a study that noted the wide racial disparity in firearms in 2017, compared
firearm homicides. Despite the fact that only 13 percent of Americans are black, with 144 police officers and
56 percent of American children killed in gun homicides are black. around 1,000 active duty
military, according to a
According to CDC data, guns are the leading cause of death for black children
study published in The
and teens in America, and they are 15 times more likely than their white
counterparts to die by firearm homicide. Black children are 10 times more likely to American Journal of
be hospitalized for a firearm assault than white children. Hispanic children and Medicine.
teens are three times more likely to die by firearm homicide than their white peers.
When we talk about child gun deaths, we tend to think about teenagers, and for
36x
good reason. According to CDC data, teens account for 85 percent of children
killed with guns.
The odds that a child will
But younger children are in no way immune. Between 2000 and 2017, 1,704 kids
be killed with a gun are 36
younger than six years old died from gunshot wounds, the CDC data shows.
times higher in the US than
A slight majority — 59 percent — of annual child gun deaths are homicides. But in other high income
every year, over 8,000 children take their own lives with guns, over 1,800 kids die countries.
in accidental shootings, and over 400 are killed by guns in ambiguous or
undetermined situations.
When it comes to firearm suicides, the overwhelming number of kids using a gun
to take their own lives are white. Between 2000 and 2017, 88 percent of children
4.6million
Kids in America reside in a
under 18 who committed suicide with a gun were white.
household where at least
one gun is kept loaded and
unlocked, according to a
study published in The
Journal of Public Health
SAFETENNESSEEPROJECT.ORG "16Tennessee Youth
Gun Deaths: 2017
According to the most recent data from the Centers for Disease Control and Prevention, Tennessee has one
of the highest rates of firearm mortality and one of the highest rates of firearm homicides for young people.
The rate of firearm suicides for Tennessee young people is also much higher than almost all other states in
the country.
TENNESSEE FIREARM MORTALITY AGES 0-19: 2017
Rank State Deaths Rate per 100k
1 Alaska 25 13.27
Between 2007 and 2017, firearm
2 Louisiana 121 10.13
mortality increased 53 percent
3 District of Columbia 12 8.18
for ages 0-19
4 Tennessee 129 7.65
5 Arkansas 59 7.50 In 2007, there were 61 firearm
6 Missouri 113 7.25 fatalities in this age group; in
7 Mississippi 58 7.14 2017, there were 129
8 Alabama 84 6.70
9 Illinois 215 6.49
10 Kentucky 73 6.42
TENNESSEE FIREARM HOMICIDE AGES 0-19: 2017
Rank State Deaths Rate per 100k
1 District of Columbia 11 7.50
Between 2007 and 2017,
2 Louisiana 87 7.29
firearm homicide increased 47
3 Illinois 174 5.25
percent for ages 0-19
4 Tennessee 74 4.39
5 Alabama 55 4.37 In 2007, there were 40 firearm
6 Missouri 61 3.92 fatalities in this age group; in
7 Arkansas 30 3.81 2017, there were 74
8 Mississippi 30 3.68
9 Maryland 50 3.28
10 South Carolina 41 3.23
TENNESSEE FIREARM SUICIDE AGES 0-19: 2017
Rank State Deaths Rate per 100k
1 Alaska 18 9.63
2 Idaho 20 4.12
Between 2007 and 2017,
3 Montana 10 3.97
firearm suicide increased 55
4 Utah 31 3.19
percent for ages 0-19
5 Oklahoma 33 3.15
6 Arkansas 23 2.92 In 2007, there were 19 firearm
7 New Mexico 16 2.90 fatalities in this age group; in
8 Missouri 45 2.88 2017, there were 42
9 Kansas 22 2.77
10 Kentucky 30 2.64
11 Nevada 19 2.64
12 Tennessee 42 2.49
SAFETENNESSEEPROJECT.ORG "17Although the rates of gun death for Tennessee young people dramatically outpaced U.S. averages in the last
six years, that has not always been the case. In 2007, they were almost identical.
By 2017, Tennessee’s rate of gun deaths in each category for the 0-19 age group had increased
substantially. More young people in Tennessee lost their life to a bullet in 2017 than in any previous
year on record.
Firearm mortality includes all forms of fatal gun violence: all violence-related fatal shootings, including
homicides, fatal domestic violence shootings, and legal intervention, as well as firearm suicides, unintentional
shootings, and shootings where the intent or motive is undetermined.
• Between 2007 and 2017, firearm mortality in Tennessee increased 53 percent for ages 0-19.
TN FIREARM MORTALITY RATES: TN FIREARM MORTALITY RATES: ALL INTENTS, AGES 0-19
ALL INTENTS, AGES 0-19 2007-2017
TN US 8.5
Year Deaths
Rate Rate
2007 61 3.58 3.53 7.5
2008 69 4.01 3.39
2009 73 4.21 3.22 6.5
2010 63 3.67 3.13
2011 63 3.72 3.16 5.5
2012 68 4.06 3.19
2013 80 4.82 2.94 4.5
2014 70 4.22 3.06
2015 92 5.52 3.38 3.5
2016 95 5.66 3.77
2.5
2017 129 7.65 4.12
Rates are per 100,000 people
1.5
2007 2008 2009 2010 2011 2012 2013 2014 2015 2016 2017
TN US
Firearm homicide includes any murder committed with a firearm, whether the murder is the result of an
altercation, a domestic situation, a road rage shooting, or committed during the commission of a criminal act,
such as an armed robbery or retaliatory shooting.
• In 2007, the rate of firearm homicides involving individuals 0-19 in Tennessee was lower than the U.S.
average. In 2017 it was nearly double the U.S average.
• Between 2007 and 2017, firearm homicide in Tennessee increased 47 percent for ages 0-19.
TN FIREARM HOMICDE RATES: TN FIREARM HOMICIDE RATES: AGES 0-19
ALL INTENTS, AGES 0-19 2007-2017
TN US 5.00
Year Deaths
Rate Rate
2007 40 2.34 2.49 4.50
2008 47 2.71 2.33
2009 50 2.88 2.12 4.00
2010 35 2.03 2.04
2011 45 2.66 1.93 3.50
2012 43 2.57 1.97
2013 48 2.89 1.68 3.00
2014 41 2.47 1.76
2015 58 3.48 1.97 2.50
2016 49 2.92 2.21
2017 74 4.39 2.30 2.00
Rates are per 100,000 people
1.50
2007 2008 2009 2010 2011 2012 2013 2014 2015 2016 2017
TN US
SAFETENNESSEEPROJECT.ORG "18Firearm suicide includes any completed suicide where a gun was used. Firearm suicides are unique in
both their impulsivity and their lethality. Unlike other methods of suicide, firearm suicides take little planning
and are almost always successful.
• The number of young people in Tennessee who take their own life with a gun has more than doubled since
2007 and is significantly higher than the U.S. average.
• Between 2007 and 2017, firearm suicide in Tennessee increased 55 percent for ages 0-19.
TN FIREARM SUICIDE RATES: TN FIREARM SUICIDE RATES: AGES 0-19
AGES 0-19 2007-2017
TN US 3.0
Year Deaths
Rate Rate
2007 19 1.12 0.78 2.5
2008 17 1.00 0.85
2009 19 1.10 0.91
2.0
2010 20 1.16 0.86
2011 15 0.88 0.99
2012 17 1.02 1.02 1.5
2013 27 1.63 1.05
2014 21 1.27 1.12 1.0
2015 26 1.56 1.22
2016 41 2.44 1.32
0.5
2017 42 2.49 1.55
Rates are per 100,000 people
0.0
2007 2008 2009 2010 2011 2012 2013 2014 2015 2016 2017
TN US
Tennessee gun deaths ages 0-19: 2017 by race of victim
TENNESSEE FIREARM MORTALITY TENNESSEE FIREARM HOMICIDE TENNESSEE FIREARM SUICIDE
AGES 0-19: 2017 AGES 0-19: 2017 AGES 0-19: 2017
White (63 Victims) White (18 Victims) White (36 Victims)
Black (65 Victims) Black (55 Victims) Unclear (6 Victims)
POLICY RECOMMENDATIONS:
Implement MaKayla's Law, child access prevention legislation
Implement safe storage laws requiring guns to be secured in locked vehicles to prevent gun theft
Provide funding to community groups and violence interrupters working in communities most
impacted by gun violence
Provide funding for "safe storage" PSAs to address not only unintentional shootings involving minors,
but also tween and teen firearm suicides
Provide funding for "safe storage" PSAs to encourage gun owners to secure guns left in vehicles to
prevent gun thefts
Provide funding for research to study key drivers of gun violence in Tennessee
SAFETENNESSEEPROJECT.ORG "19Homicide in
Communities of Color
The devastation homicide inflicts on black teens and young adults is a national
8th
Tennessee is 8th in the
crisis, yet it is all too often ignored outside of affected communities. nation for black homicide
victimization according to
Each year, there are over 12,000 gun homicides and 67,000 nonfatal gun assaults
in the United States. These numbers are rising, with violence heavily concentrated data from the Violence
in particular communities. Policy Center
Black children and teens are nearly 15 times more likely to be shot to death than
their white peers; the gun homicide rate of young black American men is nearly 20
times the national average. 20x
The gun homicide rate of
In just one year, gun death rate among black Americans rose nearly 11% from young black men is nearly
2015 to 2016. Hispanic men are similarly impacted with a gun homicide rate nearly
20 times the national
five times the national average. In 2016, over 74% of gun-related homicide victims
were men of color. average,
Violence is a cycle: in studies of some urban hospitals, researchers have found that
up to 45% of patients treated for injuries like gunshots were violently reinjured
within five years.
People who have been violently victimized are also at increased risk of retaliating
61%
of US firearm homicide
and becoming perpetrators of violence: being shot, being shot at, or witnessing a victims were men of color,
shooting doubles the probability that a young person will commit violence in the
next two years. according to data from the
CDC
64%
of Tennessee firearm
homicide victims were men
of color, according to data
from the CDC
SAFETENNESSEEPROJECT.ORG "20Black Homicide Victimization
in Tennessee: 2006 - 2016
Black Homicide Victimization is an annual report prepared by the Violence Policy Center representing an
analysis of the unpublished Supplementary Homicide Report (SHR) data for black homicide victimization
submitted to the Federal Bureau of Investigation (FBI).
The data below is from the years 2006 - 2016, the last year for which data was available.
Although not every homicide was committed with a firearm, in any given year, between 70 and 90 percent of
Tennessee homicide victims were shot and killed with guns.
Nationally, in homicides of black victims with an identified weapon, a gun was used 87 percent of the time.
TENNESSEE BLACK HOMICIDE VICTIMIZATION: 2006 - 2016
TN Rate US Rate Difference between TN
Year Rank Fatalities
per 100k per 100k rate & US Rate
2016 8 323 27.72 20.44 7.28
2015 12 265 23.50 18.68 4.82
2014 11 243 21.71 16.38 5.33
2013 12 210 18.97 16.91 2.06
2012 10 246 22.40 18.03 4.37
2011 14 229 21.15 17.51 3.64
2010 18 186 16.65 16.32 0.33
2009 7 244 23.01 17.90 5.11
2008 5 244 22.59 18.07 4.52
2007 11 255 24.71 20.86 3.85
2006 17 228 22.22 20.27 1.95
TENNESSEE BLACK HOMICIDE VICTIMIZATION RATE PER 100K
2006-2016
In 2016,
75%
29
27
of the Tennessee 25
homicides reviewed for
the Black Homicide
23
Victimization report were
the result of an argument
21
and
not related to other 19
felonies.
17
15
2006 2007 2008 2009 2010 2011 2012 2013 2014 2015 2016
POLICY RECOMMENDATIONS: TN Rate US Rate
Expand background checks for all gun sales
Implement extreme risk protection orders
Strengthen firearm dispossession laws for convicted domestic abusers
Implement safe storage laws requiring guns to be secured in locked vehicles to prevent gun theft
Provide funding for community groups and violence interrupters working in communities most
impacted by gun violence
Provide funding for "safe storage" PSAs to encourage gun owners to secure guns left in vehicles to
prevent gun thefts
Provide funding for research to study key drivers of gun violence in Tennessee
SAFETENNESSEEPROJECT.ORG "21Child Access
Prevention 1st
In 2017, Tennessee led the
nation in unintentional
Guns in homes pose a clear risk to the safety of children, especially when guns are
not stored safely or securely. Tragic unintentional shootings and youth suicides shootings involving children
occur far too often. Child access prevention (CAP) laws hold gun owners with access to negligently
accountable for the safe storage of their firearms, which helps prevent guns from stored firearms
falling into young hands.
10x
CAP laws have been shown to be effective at reducing youth suicides and
unintentional shootings:
The rate of unintentional
One 2017 study published in JAMA Pediatrics found that of twelve states where
CAP laws had been in effect for at least one year, unintentional firearm deaths firearm death for US kids
fell by 23% among children under 15 years of age. ages 0-14 is 10x higher
than kids in other
The same study found that CAP laws were associated with an 8.3% decrease in developed nation,
suicides among children ages 14 to 17.
according to a study
A 2018 study published in the Journal of Trauma and Acute Care Surgery found published in the journal
that strong child access prevention (CAP) laws were associated with a Injury Epidemiology
significant reduction in all, self-inflicted, and unintentional pediatric firearm
injuries. Weak CAP laws, which only impose liability for reckless endangerment,
were associated with an increased risk of all pediatric firearm injuries.
Gun Safety Programs
75%
of children reported
knowing the location of
In 2017, the United States Government Accountability Office (GAO) issued a report
their parents’ firearms,
on programs that promote safe storage of firearms. The report found that:
according to the Center for
Children who received instruction in gun safety were no more likely than Injury Research and Policy
those who did not to heed basic rules about what to do if they came
across a gun — like leaving the room, not touching the gun or notifying an
adult. Informational sessions or videos “did not instill consistent safe firearm
habits in young children.” The NRA’s Eddie Eagle program did succeed at
getting children between the ages of 4 and 6 to verbally repeat rules on
40%
Nearly 40% of all
what to do when they encounter a gun. But those same children were not unintentional shooting
significantly more likely than others who hadn’t gone through the Eddie
deaths among children
Eagle training program to actually follow through with those behaviors
when they encountered a gun. 11-14 years of age occur in
the home of a friend,
Teaching children about gun safety is important, but it is in no way a substitution according to a study
for securing guns and making them inaccessible to unauthorized users, especially published in the journal
curious kids.
Injury Epidemiology
SAFETENNESSEEPROJECT.ORG "22When Tennessee Kids
Pull the Trigger
Safe Tennessee began tracking shootings involving children with access to unsecured guns in 2015, using
stories reported in the media and data from The Gun Violence Archive. In each one of these cases, a child
pulled the trigger and injured or killed themselves or another person.
Between January 1, 2015 and September 10, 2019, there have been at least 108 incidents where a
child under 18 gained access to an unsecured firearm and fired it. Of those:
- 37 resulted in a child fatality
- 67 resulted in an injury to a child
- 2 resulted in an injury to an adult
- 2 incidents resulted in no injury
AGE GROUPS OF CHILD SHOOTERS
Shooter data
Age Toddlers (1-3)
- 20 were toddlers (ages 1-3) Unknown 20%
14%
- 8 were preschoolers (ages 4-6)
- 6 were elementary school-aged (ages 7-9)
- 15 were tweens (ages 10-12) Preschools
- 24 were young teens (ages 13-15) (4-6)
Older Teen
- 14 were older teens (ages 16-17) (16-17)
8%
- 14 incidents did not provide an age of the child
14%
Elementary-
aged (7-9)
Incident circumstances 6%
- 18 children killed themselves
- 17 children killed another child
- 31 children injured themselves Tweens (10-
12)
- 30 children injured another child
Young Teens
(13-15) 15%
- 8 children injured an adult 23%
- 2 incidents did not provide details on circumstances
- 2 incidents did not result in any injury
Relationship between shooter and victim
- 49 children shot themselves RELATIONSHIP BETWEEN SHOOTER AND VICTIM
- 18 resulted in death Sibling
- 31 resulted in injury 14% Friend
- 15 shot a sibling 25%
- 10 resulted in death
- 5 resulted in injury
- 27 shot a friend
- 4 resulted in death
- 23 resulted in injury Parent
2%
- 2 shot a parent
- both resulted in injury Other
Relative
- 8 shot a relative other than a parent 7%
- 2 resulted in death Neighbor
2%
- 6 resulted in injury
Relationship
- 2 shot a neighbor Self
45% Unknown
- 1 resulted in death 5%
- 1 resulted in injury
- 5 incidents did not provide details about relationship
SAFETENNESSEEPROJECT.ORG "23Cities with most incidents
- 32 occurred in Memphis
- 19 occurred in Nashville
- 6 occurred in Knoxville
- 4 occurred in Jackson
- 3 occurred in Chattanooga
Incidents by year
2019 Incident Data
(Jan 1 2019 - Sep 10, 2019)
Total Incidents: 20
Injuries to children: 12
Injuries to adults: 2
Fatalities: 5
No Injury: 1
——————————
2018 Incident Data 2016 Incident Data
Total Incidents: 14 Total Incidents: 22
Injuries to children: 5 Injuries to children: 14
Injuries to adults: 4 Injuries to adults: 2
Fatalities: 4 Fatalities: 6
No Injury: 1 No Injury: 0
2017 Incident Data 2015 Incident Data
Total Incidents: 31 Total Incidents: 21
Injuries to children:18 Injuries to children: 12
Injuries to adults: 0 Injuries to adults: 0
Fatalities: 13 Fatalities: 9
No Injury: 0 No Injury: 0
POLICY RECOMMENDATIONS:
Implement MaKayla's Law, child access prevention legislation
Provide funding for "safe storage" PSAs to address not only unintentional shootings involving minors,
but also tween and teen firearm suicides
SAFETENNESSEEPROJECT.ORG "24Firearm Suicide
Suicide is an American public health crisis, and firearms play a large role. In 2017,
59
On average,59
over 23,000 people used a gun to take their own life - over 60 people every single Tennesseans use a gun to
day.
take their own life every
American veterans disproportionately shoulder the burden of our nation’s firearm month - nearly two each
suicide epidemic. Over the last decade, the suicide rate for veterans has been day, according data from
much higher and risen faster than the suicide rate of the general population. the CDC
According to the Veteran’s Administration Suicide Data Report, veterans account
3x
for 20 percent of all adult gun suicides.
Firearms are by far the most common suicide method among veterans. Nearly 70
percent of veteran suicides involve guns. Access to a gun in the
home increases the odds of
Though most people who attempt suicide are struggling with mental illness, suicide more than three-
suicides are usually impulsive acts utilizing whatever methods are immediately fold, according to a 2014
available. 48 percent of people harm themselves within ten minutes of deciding to
study published in the
attempt suicide. 71 percent do so within one hour.
Annals of Internal Medicine
In these moments of crisis, people who reach for guns are unlikely to survive.
Firearms are among the most lethal suicide attempt methods. Approximately nine
90%
out of ten suicide attempts with a gun result in death.
While guns are used in only 5 percent of suicide attempts, they are
of individuals who survive a
responsible for more than 50 percent of suicide deaths.
suicide attempt never
Firearm suicide rates vary greatly across the country. In places where gun attempt again
ownership is more common, suicide rates - both overall and by gun - are generally
higher.
There is substantive research linking easy access to firearms with an increased rate
of firearm suicide. Suicide interventions that address access to lethal means are
2x
The veteran suicide rate is
critical components of a comprehensive suicide prevention strategy. more than twice as high as
the non-veteran adult
suicide rate, according to
the VA
SAFETENNESSEEPROJECT.ORG "25Firearm Suicide
in Tennessee: 2007 - 2017
Firearm suicide includes any completed suicide where a gun was used. Firearm suicides are unique in both
their impulsivity and their lethality. Unlike other methods of suicide, firearm suicides take little planning and are
almost always successful.
Firearm suicides make up the bulk of majority of Tennessee gun deaths every year. In 2017, they made up
57.1 percent of total gun deaths for the year. Nationally, firearm suicides made up 51 percent of total gun
deaths. Firearm suicide rates in Tennessee outpace the national average.
• Between 2007 and 2017, firearm suicide in Tennessee increased 15 percent.
TN FIREARM SUICIDE RATES: TN FIREARM SUICIDE RATES: ALL AGES
ALL AGES 2007 - 2017
TN US 10.5
Year Deaths
Rate Rate
2007 545 8.55 5.63 9.5
2008 609 9.36 5.82
2009 574 8.81 5.91 8.5
2010 585 8.93 6.06
2011 591 8.73 6.16 7.5
2012 626 9.14 6.29
2013 676 9.86 6.38 6.5
2014 644 9.32 6.36
2015 638 9.14 6.49 5.5
2016 675 9.67 6.71
2017 711 10.04 6.92 4.5
Rates are per 100,000 people
3.5
2007 2008 2009 2010 2011 2012 2013 2014 2015 2016 2017
TN FIREARM SUICIDE: 2007-2017 TN US
COUNTIES WITH HIGHEST RATE Data Source: CDC
County Deaths Rate
Firearms are consistently the most common means of
Stewart 40 27.31
suicide in the United States and in Tennessee, making up
Lewis 34 25.90
well over 50 percent of all suicide death over the last ten
Clay 19 21.95
years.
Henry 73 20.58
Perry 17 19.69 TENNESSEE SUICIDES
2007 - 2017
Rates are per 100,000 people 100%
Data Source: Tennessee Department of Health 90%
299 352 354 353
80%
364 373 358 364 436 455
430
70%
60%
50%
40%
545 626 676 644
30% 609 574 585 591 675 711
638
20%
10%
0%
2007 2008 2009 2010 2011 2012 2013 2014 2015 2016 2017
Firearm Other means
SAFETENNESSEEPROJECT.ORG "26Firearm Suicide
In Tennessee
Firearm suicides disproportionately impact whites. The rate of number of firearm suicide deaths for whites
has risen steadily while the number of firearm suicide deaths for other races has remained relatively
unchanged.
White
Black
Hispanic
Asian, Pacific Islander
Firearm suicides disproportionately impact men. The number of women who kill themselves with a gun is a
fraction of the number of men and has remained steady, while the number of men who use a gun to kill
themselves has continued to increase.
Males
Females
POLICY RECOMMENDATIONS:
Expand background checks for all gun sales
Implement extreme risk protection orders
Provide funding for research to study key drivers of gun violence in Tennessee
SAFETENNESSEEPROJECT.ORG "27Mass Shootings
Of the twenty deadliest mass shootings in American history, seven took place in the
last five years. Five took place in the last two.
1. Route 91 Harvest music festival, Las Vegas, October 2, 2017: 58 killed, 527 injured.
2. Pulse, Orlando, Fla., June 2016: 49 killed and more than 50 injured.
3. Virginia Tech, Blacksburg, Va., April 2007: 32 killed and 17 injured on campus.
4. Sandy Hook Elementary School, Newtown, Conn., December 2012: 26 killed.
14
In 2018, there were 14
5. First Baptist Church, Sutherland Springs, Texas, November 2017: 26 killed.
6. Luby’s Cafeteria, Killeen, Texas, October 1991: 23 killed. mass shootings in
7. Walmart, El Paso, Texas, August 3, 2019: At least 22 killed, 26 injured.
8. McDonald’s, San Ysdiro, Calif., July 1984: 21 killed.
Tennessee according to
9. Marjory Stoneman Douglas High School, Parkland, Fla., February 2018: 17 killed. data from the Gun Violence
10. University of Texas Tower, Austin, Texas, August 1966: 16 killed around campus.
11. Inland Regional Center, San Bernardino, Calif., December 2015: 14 killed. Archive
12. Edmond post office, Edmond, Okla., August 1986: 14 killed.
13. Fort Hood, Fort Hood, Texas, November 2009: 13 killed.
14. Columbine High School, Littleton, Colo., April 1999: 13 killed.
337
15. Binghamton Civic Association, Binghamton, N.Y., April 2009: 13 killed.
16. New Jersey neighborhood and local shops, Camden, N.J, September 1949: 13 killed.
17. Schoolhouse Lane neighborhood and Heather Highlands Mobile Home Village, Wilkes-Barre, Pa., September
1982: 13 killed.
18. Wah Mee club in the Louisa hotel, Seattle, Wash., February 1983: 13 killed. In 2018, there were 337
19. Century 16 movie theater, Aurora, Colo., July 2012: 12 killed, 58 wounded.
20. Navy Yard, Washington, D.C., September 2013: 12 killed, 8 wounded. mass shootings in the U.S.
21. The Borderline Bar & Grill, Thousand Oaks, Calif., November 2018: 12 killed, several wounded.
according to data from the
According to the American Psychiatric Association, mass shootings by people with Gun Violence Archive
serious mental illness represent less than 1% of the yearly gun homicides in the U.S.
Research shows that people with a mental illness are more likely to harm themselves
than others, and are often the victims of violent crime. Mental health experts
repeatedly discourage blaming mental illness for gun violence, including mass
shootings, noting that the most consistent and powerful predictors that someone will
resort to gun violence are a history of violent behavior, substance abuse, misogyny,
1/DAY
So far in 2019, there have
and access to firearm been more mass shootings
When most people think of mass shootings, they think of the incidents with large than days
numbers of injuries and fatalities. But those high profile “spectacle shootings” make
up only a fraction of the mass shootings (events where four or more people are killed
or injured) in the U.S.
Since 2014, there have been 334 mass shootings per year, on average, in the US. 78%
Of mass shooters
US MASS SHOOTINGS: “exhibited behaviors that
2014 - 2018
caused concern in others,”
2018 337 according to report on
mass shootings published
2017 346
by the US Secret Service.
2016 382
2015 335
2014 269
0 50 100 150 200 250 300 350 400
The places that suffer mass shootings run the full gamut of American communities. Some are small, affluent,
white suburbs. But the reality is that these tragedies occur in large cities and small towns; in rich, poor, and
middle-class places; and in racially mixed as well as predominantly white communities. Most occur in
mundane places, like residences, driveways, and parking lots. Some may be gang-related while others are
related to domestic violence.
SAFETENNESSEEPROJECT.ORG "28You can also read