THE GROWING DIVIDE - KidsCan
←
→
Page content transcription
If your browser does not render page correctly, please read the page content below

THE GROWING DIVIDE
A STATE OF THE NATION REPORT FROM THE SALVATION ARMY 2012

                                                            | A
ISBN 978-0-9864633-5-8 (Paper version)

                 ISBN 978-0-9864633-6-5 (Electronic)

                 Authorised and approved by Commissioner Donald C. Bell, Territorial Commander,
                 as an official publication of The Salvation Army New Zealand, Fiji and Tonga Territory.

                 ‘The Growing Divide’ was produced by The Salvation Army Social Policy and Parliamentary Unit,
                 16b Bakerfield Place, Manukau City 2104, New Zealand.

                 Director: Major Campbell Roberts

                 This Report is available for viewing or download from:
                 www.salvationarmy.org.nz/socialpolicy

                 The Salvation Army Social Policy and Parliamentary Unit would like to thank community partner
                 Duncan Cotterill Lawyers for their financial assistance with the production of this report.

B |   THE GROWING DIVIDE
THE GROWING DIVIDE
A STATE OF THE NATION REPORT FROM THE SALVATION ARMY 2012

Alan Johnson, Senior Policy Analyst

The Salvation Army Social Policy and Parliamentary Unit
February 2012

                                                            | i
Photography: photonewzealand.co.nz

ii |   THE GROWING DIVIDE
‘We have two clear choices here: one is to     ‘A society grows great when old men plant
continue the path we have been on more         trees whose shade they know they shall never
or less continuously for the past three        sit in.’
decades, concentrating wealth and influence,   GREEK PROVERB
and driving the marginalised further into
the shadows with yet restrictive welfare
                                               ‘But you must defend those who are helpless
entitlements and a yet more punitive
                                               and have no hope. Be fair and give justice to
criminal justice system. The other is to act
                                               the poor and homeless.’
more inclusively and to work consciously
                                               PROVERBS 31:8–9
and deliberately at ways of ensuring that      HOLY BIBLE
the most marginalised New Zealanders,          CONTEMPORARY ENGLISH VERSION
and in particular, many poor families and
unemployed young people, feel as though
they are valued and valuable members of
our society.’
FOREWORD
THE GROWING DIVIDE

WE                                             SOCIAL POLICY AND          PO Box 76249, Manukau City 2104

                                               PARLIAMENTARY UNIT         social_policy@nzf.salvationarmy.org

WELCOME                                        THE SALVATION ARMY         salvationarmy.org.nz/socialpolicy

YOUR
                                               NEW ZEALAND, FIJI          Phone (09) 261 0883
                                               & TONGA TERRITORY          Mobile 027 450 6944

FEEDBACK                                                                  Fax (09) 262 4103

                                                                                                                | iii
INTRODUCTION

                  This is the Salvation Army’s fifth State of the   In the foreword, Director of The Salvation
                  Nation report. The intention of this report       Army’s Social Policy and Parliamentary
                  and its predecessors is to provide a snapshot     Unit, Major Campbell Roberts, sets
                  of social progress. In doing so, we hope New      the scene and context of division. As
                  Zealanders will value more the pieces making      well, social policy analyst Ronji Tanielu
                  up the snapshot. For example, we have placed      contributes to the discussion with a piece
                  New Zealand’s prisons in the picture because      on youth development, which we believe
                  it is important that as citizens we get to        is particularly current and relevant to our
                  consider and debate the wisdom of locking         social progress. We have chosen this topic
                  more and more people up.                          of youth development because many of the

                  But snapshots are merely a frozen moment          indicators discussed elsewhere in this report

                  of time, limited by their frame and focus.        point to the increasing marginalisation of

                  And so it is with this report. We accept          young people, both in policy terms and in the

                  these limitations in an effort at presenting      broader social context.

                  information that is as up-to-date as possible,    It would be unusual if our social progress was
                  in a way that is as accessible as possible.       all in one direction—forward or backward,

                  The scope of this report remains the same as      for example. Usually we make progress in

                  previous years. We have avoided what may be       some areas, tread water in some areas, and

                  called ‘indicator creep’, where more and more     fall behind in others. Hopefully the total sum

                  indicators are added in order to tell a more      of all this change and constancy is a sense

                  complete story. While an extra indicator is       of movement toward or away from some

                  handy and relevant, there are always trade-       desired goal or better place. For example,

                  offs between completeness and complexity,         have the social changes over the past few

                  and between brevity and breadth, that need        years made us more or less peaceful and

                  to be taken into account.                         content as a society? These are the searching
                                                                    questions that a report of this depth cannot
                  As in the past, this report focuses on five
                                                                    be expected to answer. But such questions
                  social policy areas: children’s wellbeing,
                                                                    are the essence of social policy and of politics,
                  crime and punishment, work and incomes,
                                                                    and should always be held in front of us as we
                  social hazards and housing. We deal with
                                                                    consider this report and others like it.
                  each of these topics separately, through
                  the presentation and discussion of various        We look forward to your feedback and thank

                  indicators. These indicators cover 21 topic       you for your interest.

                  areas. At the end of each section is a summary    Alan Johnson
                  report card providing a brief assessment of       Principal author
                  how we see recent social progress.

iv |   THE GROWING DIVIDE
FOREWORD: THE GROWING DIVIDE

LESSONS FROM THE 2011 ELECTION                     proposed partial privatisation of state assets
                                                   and radical changes to some aspects of our
The 2011 General Election might be best
                                                   welfare system.
remembered for is its low voter turnout.
Less than 75% of registered voters actually        Some opposition parties took up the
voted, which is over 790,000 people. Add to        challenge set down by Mr Key and, in
this the fact that around 7% of eligible people    particular, campaigned against assets sales.
didn’t even register to vote, and we have over     They lost. While these parties may lament
one million adults—or nearly one in three          the missing votes, they frankly did not offer
people—who are not participating in our            enough to encourage people to get out and
democracy.                                         vote for them. All the same, but for less than
                                                   7000 well placed votes,1 the Parliamentary
But why should we worry about people not
                                                   majority Mr Key’s coalition government is
participating in elections? Surely one of our
                                                   now enjoying would not exist.
democratic rights is the right to decide not to
participate; and surely if people choose not       Given how close the election result actually
to participate, they have no right to complain     was, what sort of mandate can Mr Key now
about the results?                                 claim? In pure political terms he can now
                                                   begin to limit welfare entitlements and to sell
There are at least two reasons why we should
                                                   off public assets, even though fewer than 35%
worry about this poor turnout. One reason is
                                                   of eligible voters actually supported his party
around the question of legitimacy, and the
                                                   and his plans.2
other around entrenched marginalisation—
the members of our society who are being           The problem that Mr Key and any other Prime
pushed further into the edges, thus dividing       Ministers elected with such a limited mandate
our nation. In some ways these two questions       have is not about power, but about legitimacy.
of legitimacy and marginalisation are inter-       They simply do no have the moral authority
related, which creates a third reason why we       to exercise sweeping changes because the
should be concerned that nearly one in three       majority of people—either by dissent or by
adult citizens are opting out of our civic life.   absence—have not given this to them.

                                                   This lack of moral authority to exercise
LEGITIMACY
                                                   sweeping changes is not new to New
Throughout the last term of Parliament,
                                                   Zealand’s politics. We simply have to recall
Prime Minister John Key made his plans for a
                                                   the deceit around the way the Rogernomics
second term clear, and he also made it clear
                                                   revolution was imposed on New Zealanders
that he would be using the election to gain
                                                   by the fourth Labour Government, between
a mandate to execute these plans. Among
                                                   1984 and 1987, to know this. However, such a
these mandate-seeking plans were the
                                                   comparison is unfair to Mr Key because he, at

                                                                              FOREWORD: THE GROWING DIVIDE   | v
least, was upfront with his intent and openly This may be the social future being created
campaigned on it. right here in New Zealand, right now. As the
Mr Key and his Government, of course, data and evidence presented in this report
have the political power to bring about the shows, at a time when crime rates are falling
changes they have promised, so a lack of and expected to fall further, Government
moral authority means little in practice. agencies may be planning to build even
However, if a government ignores the bigger prisons. This report also shows that
young Ma –ori males are around 30% more
question of moral authority when it suits
it, what moral authority does it have over likely to be prosecuted by Police than are
non-Ma –ori males of the same age and who
citizens to insist that they pay taxes, sit on
–ori male
commit the same offences. The Ma
juries, and obey laws which to some may
seem unjust? imprisonment rate, which is five times that
–ori males, is well-known and quite
for non- Ma
There are, of course, ways in which the
inexplicable.
State can force citizens to comply with its
directions and meet its expectations. It can As a national community we are not debating
pass laws and enforce these through the use these issues. Rather, what passes for the
of the Police, courts and the prison system. public debate around crime is neither fair
If this proves difficult, the State can just nor accurate. Every night on TV news, we
criminalise more and more people by passing are being bombarded by images and stories
more punitive laws; and then go on to punish about truly violent crime. This coverage is
more and more people who transgress. often supported by inflamed commentary
from lobbyists calling for yet tougher
As long as the people being criminalised and
stances on law and order. There is very little
punished are not those likely to vote for your
commentary about the causes of this violence
political party, then there is no political risk
or the effectiveness of building more prisons.
to this strategy. In fact, there may be some
political capital in doing so—especially if The 2009 Crime and Safety Survey, for
you can create a climate where those people example, reported that over half of all
likely to support you become more and more crime happens to just 6% of the population.
fearful of difference and begin to see crime Furthermore, the Survey showed that these
as the imminent threat of ‘the other’. So our perennial victims are most likely to have
thinking as a society becomes about the the same age, income and ethnic profile
divide between ‘us’ and ‘them’—rather than as those committing the crimes. Much of
understanding or dealing with the drivers New Zealand’s crime is quite localised,
of crime. with offenders being likely to commit their
offences in the neighbourhoods and even
vi | THE GROWING DIVIDEin the houses where they live. Evidence Electoral Commission was reporting that
in this report on increasing numbers of 25% of eligible voters aged between 18 and
reported assaults in dwellings, supports this 24—around 110,000 people—had still not
perspective. registered as voters. This figure appears
It is the most marginalised people who most to have improved little by the time of the
often commit crime and who are most often election.
likely to be the victim of crime. The geographic Evidence from the 2005 election and before
spread of crime shows us this. If you live in has already identified that this generation of
South Auckland you are at least twice as likely voters is less inclined to vote than previous
as someone living on the North Shore to be generations were at their age.3 There is
the victim of a theft or burglary. If you live some support in the academic literature4
in Rotorua you are almost twice as likely as that voting or not voting is habit-forming,
someone living in Tauranga to be assaulted. suggesting that those who didn’t vote in
Why this should be, and what we should do 2011 are unlikely to do so in 2014. Professor
about it, are questions seldom covered in our Jack Vowles has claimed that declining voter
public debate. Instead the debate is focused participation is indicative of declining civic
on generalised accounts of crime and, most engagement, and that such declines may lead
often, middle class perceptions of it. in turn to shifts in the public policy agenda,
as the interests and needs of those who
ENTRENCHED MARGINALISATION don’t vote become less and less important to
It is probably also the most marginalised who politics, politicians and to policy.5
are the least likely to participate in elections,
Such a narrowing of focus does not, of course,
although there is no way of knowing this
enhance the legitimacy of a government
from the data available. However, the four
and can lead to a vicious cycle whereby
general electorates with the lowest voter
the interests served by the State become
turnouts were in South Auckland, with an
narrower and narrower. This means that
average turnout of 67% (albeit that one of
those excluded become more and more
these, Botany, remains a fairly middle class
–ori electorates marginalised, and so they participate less and
community). Turnout in the Ma
less, and so on. In this way, we end up with a
was even more disappointing, averaging 58%;
hypothetical democracy—one that exists in
with the lowest being just under 55% in the
law, but not a tangible, living one.
Tamaki Makarau electorate, located in central
and south Auckland. WHO CARES?
This marginalisation also has an age So why bother to worry about all of this?
dimension. A month before the election, the Are legitimacy and moral authority really
INTRODUCTION | viithat important? Are we that worried that 10 behaviour—some good, some bad. We can be
or 20% of New Zealanders are increasingly selfish as well as sociable and even altruistic,
disconnected and divided from the and we have varying views over what we
mainstream of our society? can change in our lives—our so-called
The answers to these questions depend in self-efficacy. There are also emerging ideas
some ways on how you see the future, and around the use of values, such as belonging
perhaps on how far into the future you see. If and identity, and the use of informal systems
your view of the future is through to the next of social control as a means of both limiting
elections, or until you pay off the mortgage anti-social behaviour and of gaining greater
or retire, your perspective can perhaps social cohesion.6
afford to ignore questions of legitimacy and
DIVIDING OUR NATION
marginalisation. If you take a generational or
The 2011 election results should give us food
multi-generational view of the future, then
for thought about the extent to which more
these questions are more demanding.
and more New Zealanders are becoming
These questions become more demanding, disconnected from the mainstream of
in part, because we need to look beyond New Zealand life, and about the future
the present conventional wisdoms based as implications of this dividing nation. We have
they are on a narrow, economic rationalism. two clear choices here: one is to continue
That is the sort of thinking which has the path we have been on more or less
created the global financial crisis, and a New continuously for the past three decades,
Zealand which is increasingly unequal and concentrating wealth and influence, and
heavily indebted. There will be new ways driving the marginalised further into
of thinking and we, or perhaps our children the shadows with yet restrictive welfare
and grandchildren, will look back on this entitlements and a yet more punitive
era of narrow economic rationalism with criminal justice system. The other is to act
some anger at the opportunities wasted, more inclusively and to work consciously
and perhaps with some incredulity at our and deliberately at ways of ensuring that
collective stupidity. the most marginalised New Zealanders,
The political thinking beyond economic and in particular, many poor families and
rationalism may be beginning to emerge. unemployed young people, feel as though
Some work is being done, for example, in they are valued and valuable members of our
incorporating cognitive learning theory into society.
public policy. This is the idea that we are not
Major Campbell Roberts
always self-serving, self-directing individuals, Director, The Salvation Army Social Policy and
but humans with habits and patterns of Parliamentary Unit
viii | THE GROWING DIVIDECONTENTS
Our Children 3
Report Card 19
A Snapshot of Our Young People by Ronji Tanielu 21
Crime and Punishment 25
Report Card 35
Work and Incomes 37
Report Card 49
Social Hazards 51
Report Card 61
Housing 63
Report Card 73
Endnotes 74
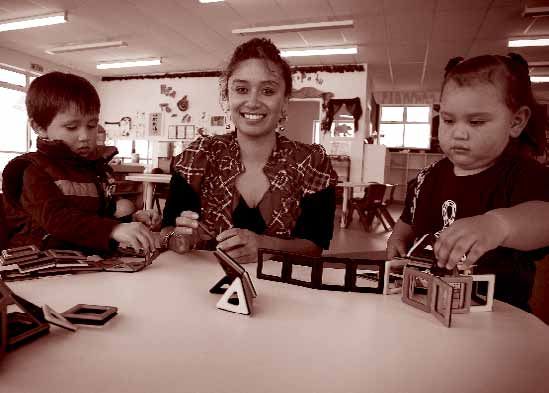
CONTENTS | 1Renee Maxell with students Kaden Love (left, 3) and Diezel Davis (3) at Homai Nga Taonga Early Childhood Centre, newly opened in Manurewa. Photography: Natalie Slade / New Zealand Herald, 27 September 2011 2 | THE GROWING DIVIDE
OUR CHILDREN

Some encouraging progress is being made in         2009 and mid-2010. Using the more liberal
areas that impact directly on the well-being       definition of poverty—of a household having
of New Zealand’s children. The rate of teenage     less than 60% of median income—the child
pregnancy has fallen, gaps in educational          poverty rate is more or less unchanged.
achievement have continued to close and            New Zealand children who, by these
rates of youth offending have also fallen.         definitions, are assessed to be living in
Against this, there has been no progress           relative poverty or at least in material
towards reducing rates of child poverty, and it    hardship, do not live in uniformly similar
appears that more children are being abused        households. There is probably no such thing
or neglected by the adults who should be           as the typical ‘poor New Zealand child’.
caring for them. While the vast majority
                                                   Perry reports that one in six European/Pakeha
of New Zealand children are well cared for
                                                   children are likely to live in relative poverty,
materially and emotionally, there remains
                                                   one in four Pacific children, and one in three
a significant minority—perhaps as many as            –ori children. Perry claims that these
                                                   Ma
10%—who may face violence and material
                                                   differences are due to different rates of benefit
hardship in their daily lives. The position of
                                                   dependence among these ethnic groups.8
these children appears to have changed little
over the past few years.                           Perry also reports that while children living in
                                                   a single parent household are far more likely
CHILD POVERTY                                      to live in relative poverty than other children,
Child Poverty Rates Remain Unchanged               the majority of children experiencing this
It is doubtful that levels of child poverty have   poverty live in two-parent households. For
changed much over the past year, and they          example, 53% of children living in a one-
appear to have remained fairly constant over       parent household are likely to live in relative
the past five years.                               poverty, while just 16% of children living
Estimates of poverty rates, including              in two-parent households do. However,
child poverty rates based on data from             because there are far more children living
the Household Economic Survey, are                 in two-parent households, just over half of
published annually by the Ministry of Social       all children living in poverty live with two
Development. Table 1 provides a summary            adults in their household. Noticeable among
of results from the most recent report.7           the changes between the 2009 and 2010
It indicates that using the more stringent         data, is the fact that proportionately more
definition of poverty—of a household having        children from two-parent households have
an income less than 50% of the median              slipped into relatively poverty, perhaps on
income—there may have been a decline               account of rising unemployment among such
in the rate of child poverty between mid-          households.9

                                                                                                      OUR CHILDREN   | 3
Table 1: Percentage of children below selected poverty lines (after housing costs) 12
THRESHOLD TYPE CONSTANT VALUE RELATIVE TO CONTEMPORARY MEDIAN
50% 60% 50% Contemporary 60% Contemporary
2007 Median 2007 Median Median Median
2004 22 31 19 28
2007 16 22 16 22
2009 16 22 18 25
2010 13 22 16 26
Table 2: Estimated number of children living in benefit-dependent households 13
As at Main benefits Number of Children in Number of
December paid children living beneficiary children estimated
in benefit households as % to be living in
dependent of all New Zealand a ‘workless’
households children household
2006 264,571 215,000 20% 171,200
2007 250,077 205,700 19% 166,400
2008 260,954 208,700 19% 173,400
2009 319,813 233,900 21% 198,100
2010 324,542 239,400 22% 201,800
2011 318,985 237,900 22% 199,600
4 | THE GROWING DIVIDEUnsurprisingly, given the work-first focus CHILDREN AT RISK
of the Working for Families programme, it Child Abuse and Neglect Continues to Rise
remains the case that children living in so-
Child, Youth and Family (CYF) is the public
called ‘workless’ households are most likely
agency responsible for ensuring that every
to live in relative poverty—in fact, six times
child in New Zealand is safe from harm and
more likely.10
neglect. The agency reports the extent of any
This concentration of child poverty within reported harm or neglect of children through
‘workless’ households provides us with a three indictors (provided in Figure 1): the
helpful way of considering what might have number of notifications, the number of such
happened to child poverty rates since the notifications where some follow-up work is
last Household Economic Survey was held required, and the number of cases where this
in mid-2010. Table 2 attempts to do this by follow-up work has shown some level of child
presenting estimates of the numbers of abuse or neglect is evident.
children living in households dependent
As shown on Figure 1, the number of
on welfare benefits, who have little or no
notifications rose nearly 21%, from 124,921
employment. The underlying assumption
during the year to 30th June 2010, to 150,747
here is that changes in these numbers, and in
during 2010/11. This most recent figure
particular in the percentage of children living
for notifications is 140% greater than
in benefit dependent households, is possibly
notifications during 2005/06. The increase in
a relevant and more up-to-date indicator of
substantiations is more modest, although still
changes in New Zealand’s overall child poverty.
substantial. Between 2009/10 and 2010/11,
Table 2 suggests that the extent and rate of the number of substantiations rose 5%,
benefit dependence among New Zealand from 21,025 to 22,087. The increase over the
children may have fallen slightly over the last past five years (2005/06 to 2010/11) is 58%, or
year. For example, the estimated numbers almost 10,000 extra cases of confirmed child
of children living in benefit dependent abuse or neglect.
households may have fallen by just under
Much of this increase in reporting is on
1% between December 2010 and December
account of campaigns to address domestic
2011. While this result could be worse, it could
violence, as well as the recent practice of
certainly be better when we consider that
Police reporting domestic violence incidents
the numbers of such children are nearly 20%
to CYF when children have been present
higher than they were back in 2007; and while
at these incidents. The Chief Social Worker
economic growth is sluggish, the economy
has said that just over 57,000 children have
was still 3% larger in inflation-adjusted terms
been reported to CYF by Police because they
in 2011 than it was in 2007.11
were found present at a domestic violence
OUR CHILDREN | 5Figure 1: Child Youth and Family notifications and substantiations 2006–2011 15
160
Notifications
140
Cases requiring further action
Substantiations—abuse or neglect is proved
120
100
Numbers of children (thousands)
80
60
40
20
0
2006 2007 2008 2009 2010 2011
June years
Figure 2: Reported criminal offences against children 2006–201116
2500
Assaults on children
2000 Sexual offences against children
Neglect and ill-treatment of children
Number of reported offences
1500
1000
500
0
2006 2007 2008 2009 2009 2011
June years
6 | THE GROWING DIVIDEincident, while another recent media report increased monitoring and enforcement by
suggests that as many as 80,000 New Zealand public authorities such as the Police and CYF.
children witness domestic violence each The amendment in 2007 of Section 59 of the
year.14 Crimes Act has clearly had an impact on
the levels of reporting for relatively minor
CHILDREN AND VIOLENCE
assaults on children. For the five years prior to
Massive Increases in Reported Violence
Against Children this change (2000/01 to 2004/05), the average
Reported violence offences against children number of minor assaults on children where
increased by between 18% and 20% during no injury was caused 17 was 385 reported
2010/11, and reported cases of child neglect offences. The average number of reported
rose over 36% over the same period. These offences over the past four years (2007/08
trends are well illustrated in Figure 2.16 to 2010/11) more than doubled to 840. This
increase represents just over half (56%) of the
Reported assaults on children rose from 1889
increase in all reported assaults on children
offences during the year to 30th June 2010
for the same periods, so it is clearly not the
to 2229 offences for the most recent fiscal
case that all of the increase in numbers of
year. Over the same period, sexual assaults
assaults on children is due to increased
on children rose 20.6%, from 1522 reported
reporting of relatively minor assaults. There
offences in 2009/10, to 1835 such offences in
is also little evidence to support claims that
2010/11. Cases of child neglect rose 35.5%,
the repeal of Section 59 has contributed to
from 436 in 2009/10, to 595 reported cases in
increases in trivial reporting of minor assaults
2010/11.
on children. For the five years prior to this
Over a five-year horizon, reported assaults law change, Police resolved three-quarters
on children have risen a massive 152%, while of all reported minor non-injury assaults
reported cases of child neglect have doubled. on children, and prosecuted 34% of these
Sexual offences against children have shown reported offences. Over the most recent four
a more modest 25% increase over this period, years, the rate of resolution for such assaults
with most of this increase taking place during has remained the same, while the rate of
the year to 30th June 2011. prosecution has increased marginally to 37%.
As with violent offences against adults, there
is no way of reliably knowing if these recent
increases in reported offences are the result
of increased rates of offending, or changing
attitudes to reporting, or improved and
OUR CHILDREN | 7Table 3: Rates of violent offending by 14–16 year-old males 2006–201120
Apprehensions for offences per 10,000 population
Year ending June 2006 2007 2008 2009 2010 2011 Change Change
2008–10 2009–10
–
MAORI MALES AGED 14–16
Acts with intent to injure 374 424 434 432 477 435 16% -9%
Serious assault resulting 82 102 126 98 105 85 4% -19%
in injury
Sexual offences 4 14 4 15 5 4 4% -19%
Robbery 114 98 117 108 117 79 -31% -33%
All violent crime 587 626 664 641 737 650 11% -12%
All crime 5804 4998 5405 4903 5226 4891 -14% -5%
–
NON-MAORI MALES AGED 14–16
Acts with intent to injure 137 155 153 143 145 139 1% -4%
Serious assault resulting 25 35 26 26 22 20 -20% -7%
in injury
Sexual offences 4 3 2 2 3 4 6% 35%
Robbery 22 23 26 19 15 17 -20% 15%
All violent crime 217 232 235 221 221 213 -2% -4%
All crime 1714 1633 1607 1525 1580 1454 -15% -8%
8 | THE GROWING DIVIDEYouth Offending Shows an overall offending declined from 1651 offences
Encouraging Decline for every 10,000 of the population in 2009/10,
Criminal offending by teenagers aged 14 to 16 to 1524 per 10,000 in 2010/11. The decade-long
years old has showed an encouraging decline average rate of overall apprehensions by 14 to
over the year to 30th June 2011, bringing 16 years olds is 1670 offences per 10,000; and
about the lowest number of offences and although the 2010/11 outcome is significantly
the lowest rate of offending in more than a below this, the rate of apprehensions is quite
decade. volatile, so it is too soon to pick a trend at this
For the 12 months to 30th June 2011, there stage.
were 27,800 apprehensions of 14 to 16 year Unsurprisingly, 14 to 16 year old males
olds for criminal offences. This figure is 10% are far more likely to be apprehended for
fewer than for the previous 12 months when a criminal offence than females of the
there were 30,650 apprehensions, and is same age cohort. Just less than one in four
nearly 16% less than five years previously in overall apprehensions of 14 to 16 year
2005/06. olds are female, while nearly one in three
Serious crimes of violence, robbery and sexual apprehensions for serious violent crime
offences known to have been committed by are female. Consequently, the rates of
14 to 16 year olds also declined during 2010/11 apprehensions of females aged 14 to 16 are
from 4756 such offences in the year to 30th around half that of males for serious offences,
June 2010, to 4310 offences for 2010/11. Over and around one third of the male rate for all
the longer term, however, serious offending offending.18
by 14 to 16 year olds increased by 4%, Unfortunately, the rate of apprehensions of
between 2005/06 and 2010/11. young Ma–ori for criminal offences remains
These declines in the levels of offending by at more than three times the rate of that
14 to 16 year olds are mirrored in declining for other 14 to 16 year olds. This over-
rates of offending within the total population representation is shown in Table 3, for males
over the past year, although over the longer aged 14 to 16 years. A similar, consistent
term there is no discernable trend toward over-representation exists in comparisons of
improvement or decline. Between 2009/10 and offending by females aged 14 to 16 years.19
2010/11 rates of serious offending by 14 to 16
year-olds declined from 257 apprehensions
per 10,000 population, to 236 per 10,000. The
decade average rate of such apprehensions
is 226 per 10,000, so the recent outcome does
not point to any long term change. The rate of
OUR CHILDREN | 9Table 4: Prosecution rates of 14–16 year old males 2006–201124
Percentage of apprehended males prosecuted by Police
Year ending June 2006 2007 2008 2009 2010 2011
Ma–ori MALES AGED 14–16
Robbery 73.6% 70.8% 72.4% 69.0% 74.2% 70.7%
Serious assault resulting in injury 67.2% 67.4% 63.9% 62.3% 66.2% 65.0%
Serious assault not resulting in injury 55.3% 58.7% 58.2% 53.9% 55.2% 56.8%
Common assault 26.9% 26.3% 28.3% 20.5% 25.2% 26.8%
Dishonesty 35.8% 39.2% 41.1% 39.3% 40.9% 40.6%
Total all offences 34.3% 36.7% 37.1% 34.7% 36.3% 36.1%
NON-Ma –ori MALES AGED 14–16
Robbery 68.5% 67.8% 62.2% 70.8% 72.3% 70.6%
Serious assault resulting in injury 52.6% 58.2% 43.1% 56.2% 52.5% 52.4%
Serious assault not resulting in injury 52.6% 45.5% 54.5% 55.3% 47.2% 55.7%
Common assault 20.0% 20.8% 17.6% 17.6% 14.5% 19.7%
Dishonesty 31.3% 27.7% 31.9% 31.1% 30.4% 31.5%
Total all offences 28.2% 25.7% 27.0% 26.9% 25.9% 26.5%
Figure 3: Rates of enrolment in early childhood education 2006–201127
700
Enrolments in licensed centres per 1000 children aged under 5
700
650
600
Non-Ma–ori
550 –
Maori
500
450
400
350
2006 2007 2008 2009 2010 2011
As at July
10 | THE GROWING DIVIDE–ori
The Excessive Criminalisation of Ma Such an explanation for the apparently
Youth Continues –ori youth by
different treatment of Ma
–ori youth aged 14 to 16 years
While Ma Police shown in Table 4 might defuse
old are over three times more likely to be charges of institutional racism, but it raises
apprehended for committing a criminal further questions around why alternatives
offence, the subsequent treatment of to prosecution (if these are being used)
those apprehended possibly points to their remain so unsuccessful for young Ma –ori in
consistent excessive criminalisation by the comparison to other young people? 22
Police. This bias is demonstrated in Table 4 This is an important policy question to
which compares the prosecution rates of address for two reasons. Firstly, the rates
–ori and non-Ma
Ma –ori 14 to 16 year old males
of apprehension reported in Table 3 are
who have been apprehended for various alarming. On the face of it the apprehension
criminal offences. Over the six years covered –ori males
rates for 14 to 16 year old Ma
–ori males have been up to
by this data, Ma reported in Table 3 suggest that over half
–ori males to be
30% more likely than non-Ma of these young men are apprehended for
prosecuted by Police for the same or similar some offence in any one year, and that
crime. Criminalisation can have serious 6–7% are apprehended for a violent crime
longer-term consequences for young people of some sort.23 Most likely because of cases
both in terms of the pathway they are put on of multiple and repeat offending, the actual
to address their offending and because of the number of individuals involved in such
way criminalisation can subsequently limit offending is much lower than these rates
future life choices and chances. would suggest—but they nevertheless
The data provided in Table 4 may only tell are still quite high and should be a source
half the story but there is no way of knowing of some concern. Secondly, the reason we
this from the form of the basic crime data should be concerned both with the high rates
published by Statistics New Zealand. 21 It may –ori and their greater
of offending by young Ma
be, for example, that the number of young likelihood of being criminalised is because
Ma–ori committing offences is much less than these trends probably have a direct link to
the rates reported in Table 4 would suggest, –ori make up half the prison
the fact that Ma
and that those young Ma –ori who do offend population, and are more likely than non-
are multiple and/or repeat offenders. If this is Ma–ori to return to prison.
the case, then their higher prosecution rates
may simply be the outcome of failed attempts
at such options as family group conferences
and diversion.
OUR CHILDREN | 11Figure 4: Rates of student achievement across secondary schools28
90%
80% 2010
2005
70%
% of Year 11 students reaching NCEA Level 1
60%
50%
40%
30%
20%
10%
0%
1 2 3 4 5 6 7 8 9 10
Decile of secondary school
Table 5: NCEA Level 1 Year 11 achievement gaps 2005–2010 28
PASS RATES
2005 2009 2010
Decile 1 secondary schools 30.4% 44.8% 48.8%
Decile 10 secondary schools 75.4% 76.9% 77.5%
Achievement gap between Decile 1 and Decile 10 45.3% 32.1% 28.7%
Decile 1, 2 & 3 secondary schools 38.6% 52.2% 54.0%
Decile 8, 9 & 10 secondary schools 72.7% 75.6% 77.4%
Achievement gap between Decile 1, 2 & 3 and 8, 9 & 10 34.1% 23.4% 23.1%
12 | THE GROWING DIVIDEEARLY CHILDHOOD EDUCATION The reason for this inequality is more to
Ma–ori Children’s ECE Enrolment Rate due demographic factors than to service
Shows Further Improvement provision ones. It is, however, disappointing
Early childhood education (ECE) enrolment that education planners have been unable
data indicates that there has been a further to grasp the service delivery implications of
improvement in levels of ECE participation these demographic factors, given that they
–ori children. Between 2009/10 and
by Ma are hardly new news.
–ori children
2010/11, enrolment rates for Ma Between 2006 and 2011, the total number of
rose from 42.9%, or 429 enrolments for every ECE enrolments grew from 165,254 children to
1000 children at July 2010, to 44.3% at July 194,101 children, an increase of just less than
2011. This improvement follows a period of 29,000. Over the same period, enrolments of
decline between 2006 and 2009, which saw Ma–ori children rose from 33,019 children to
enrolment rates fall to 42.0%. This decline 40,941 children, an increase of just over 7900.
was largely on account of something of a On this basis, Ma–ori children have done well,
–ori baby-boom, which saw the numbers
Ma –ori enrolments
with the growth in total Ma
–ori births rising from just under 16,000
of Ma between 2006 and 2011 being 24%, while that
babies per year between 2001 and 2005, to –ori children is just under 16%.
for non-Ma
an average of over 18,300 per year between
–ori The problem, at least from the angle of
2006 and 2011. Overall, the number of Ma –ori birth
equitable access to ECE, is that Ma
children enrolled in ECE has continued to –ori,
rates are much higher than that for non-Ma
rise from 33,000 in 2006, to nearly 41,000 in
which when combined with the relative
2011. The failure of the Ministry of Education –ori population means that
youth of the Ma
to respond to this baby boom, however, has –ori children aged under
–ori the population of Ma
meant that rates of enrolment for Ma
five years old has grown at a much faster
children remain the same in 2011 as they were –ori. Between 2006
pace than that of non-Ma
in 2006. –ori children grew
and 2011, the number of Ma
Against this limited progress, enrolment by over 18,610, while the population of non-
rates and enrolment numbers of non-Ma –ori –ori under-fives grew by just under 9660
Ma
children blossomed between 2006 and 2011, children.25
as indicated in Figure 3. In 2006, the ECE
–ori children was 61.5%, Government ECE policy targets assistance
enrolment for non-Ma
towards providing access for children aged
rising to 66.9% in 2010 and on to 68.1% in 2011. –ori children
three and four, and in this area Ma
While the improvement in enrolments over
–ori appear to have missed out recently.
the most recent year have favoured Ma –ori pre-schoolers
ECE enrolment rates for Ma
children, the six year trend has certainly
–ori children. aged three or four declined between 2010
favoured non-Ma
OUR CHILDREN | 13Table 6A: Changes in New Zealand’s infant mortality rate 2007–201129
Year ending Live births during Total infant deaths Infant mortality rate
September preceding 12 months (under one year) (per 1,000 live births)
2007 62,362 305 4.89
2008 64,540 340 5.27
2009 63,159 287 4.54
2010 63,732 330 5.18
2011 62,261 297 4.77
Table 6B: Pregnancies and abortions for 11–14 year-olds 2006–201029
Year ending No. of live births No. of Induced Pregnancy rate % of pregnancies
December abortions (per 100,000) aborted
2006 35 105 1.2 75%
2007 52 104 1.3 67%
2008 39 83 1.0 68%
2009 29 79 0.9 73%
2010 29 84 1.0 74%
Table 6C: Pregnancies and abortions for 15–19 year-olds 2006–201029
Year ending No. of live births No. of induced Pregnancy rate % of pregnancies
December abortions (per 1,000) aborted
2006 4338 3,978 53.9 48%
2007 4903 4,173 57.9 46%
2008 5185 4,097 58.8 44%
2009 4641 3,873 53.9 45%
2010 3708 3,389 45.2 48%
14 | THE GROWING DIVIDEand 2011, from 69.9% to 68.2%, while this (NCEA) framework, which can usefully be used
enrolment rate was 71.1% back in 2006. Over to construct a social gradient.
the same period, the enrolment rate for the
non-Ma–ori population of three and four year What is heartening is that the progress
olds rose from 100.1% in 2006, to 106.7% in achieved in closing NCEA achievement
2010, and on to 107.7% by July 2011. Clearly
gaps was consolidated and improved
this data includes some double enrolments,
and may point to the inaccuracies involved
on between 2009 and 2010
in comparing data based on two forms of NCEA data for Year 11 students achieving
ethnic identification.26 These inaccuracies Level 1 passes is provided in Figure 4 and
notwithstanding, the overall trend of lower Table 5. This data shows an encouraging
improvements in enrolment rates for Ma –ori
trend with a closing gap between pass
children is likely to be valid. rates of students from low decile schools
(ie. schools within poorer communities)
EDUCATIONAL ACHIEVEMENT
and their counterparts from higher decile
NCEA Achievement Gaps Continue to
Narrow schools. The social gradient shown in Figure
Social gradients measure the differences in 4 became less steep between 2005 and 2010.
a social outcome or a social indicator across For example, as indicated in Table 5 the
the income or wealth scale. Kate Pickett and achievement gap between Decile 1 secondary
Richard Wilkinson, in their book The Spirit schools narrowed from over 45% in 2005, to
Level, make use of the idea of social gradients just under 29% in 2010. A broader comparison
to demonstrate the differences between between Decile 1, 2 and 3 secondary schools
countries in terms of the level of inequality with Decile 8, 9 and 10 schools shows a much
within each of these countries, and a variety smaller narrowing from 34% in 2005 to 23% in
of social outcomes such as educational 2010. What is heartening in the comparisons
achievement. given in Table 5 is that the progress achieved
in closing NCEA achievement gaps between
A useful social gradient to use for considering
2005 and 2009 was consolidated and
social progress in New Zealand is that of
improved on between 2009 and 2010, albeit by
academic achievement across secondary
only 0.3% in the Decile 1, 2 and 3 to Decile 8, 9
schools in towns and neighbourhoods of
and 10 comparison.
varying socio-economic status. The National
Qualifications Authority publishes data on A similar pattern of improving outcomes for
the academic achievement of secondary students from low decile schools is apparent
school students within the National in Year 13 at NCEA Level 3. In 2005, only 27% of
Certificate of Educational Achievement Year 13 students attending Decile 1, 2 and 3
schools gained sufficient credits at Level 3 to
OUR CHILDREN | 15pass. By 2009, nearly 34% of Year 13 students respectively between 2009 and 2010. As a
from these schools had passed Level 3, and result, teenage pregnancy rates for 15 to 19
in 2010, this proportion rose again to just year olds fell by 16% from 54 pregnancies
under 37%. By comparison, two-thirds of for every 1000 in 2009, to 45 pregnancies
Year 13 students attending Decile 8, 9 and 10 per 1000 15 to 19 year old women in 2010.
schools gained an NCEA Level 3 qualification. The pregnancy rate for teenagers under 15
However, the achievement gap between low remained fairly stable at one per 1000 women.
and high decile schools remains much higher Teenage pregnancy is often seen within
at Level 3 than at Level 1. social policy as a problem. Of course, such a
perspective is culturally determined within a
INFANT MORTALITY
middle class western values set, from which
Infant Mortality Falls to Second Lowest
on Record social policy thinking has developed. The
New Zealand’s infant mortality fell slightly discussion here of teenage pregnancy is not
over the year to 30th September 2011 to be intended to present this as a moral problem,
the second lowest on record. The 2010/11 but is instead based on a strong link between
overall rate of 4.77 deaths per 1000 live births pregnancy and poor educational outcomes
is 8% less than in 2009/10, and only just for teenage mothers and poor life outcomes
behind the historic all time low of 4.54 deaths for their children.30 Ideally, it is desirable to
per 1000, which was achieved in 2008/09. Data encourage and support teenagers to delay
on the achievement is provided in Table 6A. becoming parents as a way of improving
theirs and their children’s life outcomes.
–ori infant mortality rate remains
The Ma
slightly higher than the overall infant On this note, it is encouraging to see a sharp
mortality rate, but it also declined between fall in the rate of teenage pregnancies
2009/10 and 2010/11. For the year to 30th between 2009 and 2010, as shown in Table
September 2011, the Ma–ori infant mortality 6B and 6C. Because this is a recent shift,
rate was 6.65 infant deaths for every 100,000 there is no way of knowing at this stage
live births—an improvement from the whether or not this decline is the beginning
2009/10 outcome of 7.15, but still higher than of a longer-term trend. Taking a longer-term
the record low in 2006/07 of 6.05 deaths per view suggests that these recent declines are
1000 live births. returning teenage fertility rates to the levels
they where in early 2000s.
TEENAGE PREGNANCY By comparison, Australian teenage fertility
Sharp Fall in Teenage Pregnacy Rate
rates are half those of New Zealand,31 while
The numbers of live births and abortions their abortion rates seems similar.
to teenage mothers fell by 20% and 12%
16 | THE GROWING DIVIDEOUTLOOK
It is possible to gain the impression from the data presented
that New Zealand does not at present appear to have any great
aspirations for its children. Relatively high levels of child poverty
persist year after year, high rates of child violence and child neglect
continue without any major policy shift or change in attitudes;
and too many, mainly poor, young people leave school with no
qualifications and drift into crime or to becoming parents early.
The Government’s Green Paper for Vulnerable Children is a
welcome, though preliminary, response to the challenges the
data raises. The paper’s singular focus on vulnerable children
and on evidence-based policy and programmes can be seen as
its immediate limitation. This focus fails to grasp, or even to
grasp at the reasons, why as many as one in five New Zealand
children live in material hardship, and perhaps as many as one in
10 children live in homes and neighbourhoods where violence is
commonplace.
These children’s vulnerability does not start with poor policies or
poor parenting, but in the social and economic environments we
create for children to grow up in. Too often, a child’s prospects
are determined by the good fortune or misfortune of their
mothers, and by the neighbourhood or town they get to grow up
in. There is much about such circumstances that we can change,
if as a society we choose to, as there is very little in our social
environment that is pre-determined.
Presently, we appear to lack the wit and insight to appreciate the
links between the social environments we create and the social
outcomes we reap. Until we grasp this association, significant
improvement in the indicators considered above is unlikely.
OUR CHILDREN | 1718 | THE GROWING DIVIDE
REPORT CARD: OUR CHILDREN

 CHILD POVERTY

 There does not appear to have been any noticeable changes in rates of child poverty. On the
 basis of a commonly accepted measure, around one in five New Zealand children probably live in
 material hardship. The numbers of children living in benefit-dependent households has probably
                                                                                                         C–
 fallen slightly over the past year. These numbers are nearly 20% higher than five years ago.

 CHILDREN AT RISK

 During 2010/11 the numbers of confirmed cases of child abuse or neglect rose for the third
 consecutive year. Reporting practices by Police attending domestic violence incidents cannot
 fully explain the 20% increase in notifications to CYF, and perhaps also point to changing
 community attitudes towards the mistreatment of children. This is to be welcomed. Increasing
                                                                                                         D
 levels of prosecutions for child abuse and neglect may illustrate this changing attitude, but also
 indicates that behaviours are not changing.

 CHILDREN AND VIOLENCE

 A further decline in rates of offending, and especially of violent offending by youth aged
                                                                                              –ori
 between 14 and 16 years old, is pleasing. The continuing excessive criminalisation of young Ma
 needs to be explained and addressed by the public agencies responsible.
                                                                                                         C+
 EARLY CHILDHOOD EDUCATION

                                                                                                         B
                                   –ori pre-schoolers is encouraging. The gap between Ma
 Improving rates of enrolment for Ma                                                      –ori
           –
 and non-Maori remains large, progress toward closing this gap is slow, and necessary policy
 responses cautious.

 EDUCATIONAL ACHIEVEMENT

 Once again, the gains of recent years in closing the gap in NCEA pass rates between high and low
 decile schools has been maintained, which is encouraging. These gaps remain at around 30%
 between the lowest and highest decile schools, so there is still a great deal of progress to be made.
                                                                                                         B+
 INFANT MORTALITY
                                                                                   –ori infant
 The recent decline in the infant mortality rate, although small, is encouraging. Ma
                                                     –
 mortality rates continue to be higher than non-Maori, which is an area that should be addressed.
                                                                                                         B+
 TEENAGE PREGNANCY

 The sharp decline in the teenage pregnancy rate is encouraging. It is, however, just a one-
 year trend at this stage so it is too early to tell if there has been a shift in behaviours and
 expectations. New Zealand’s teenage pregnancy rate remains at twice that of Australia, so there
                                                                                                         B+
 is real scope to target this indicator for improvement through education programmes.

                                                                                       REPORT CARD: OUR CHILDREN   | 19
20 | THE GROWING DIVIDE
A SNAPSHOT OF OUR YOUNG PEOPLE
 Ronji Tanielu, Social Policy Analyst

Background                                        to help continue these crucial discussions
George Bernard Shaw once famously said            further elsewhere.32
that ‘youth is such a wonderful thing … what      Image is Everything
a crime it is to waste it on the young’. Some
                                                  Our national collective attitude towards our
of the injustices and dire situations that our
                                                  young people must change. The key word in
young people are facing in today’s world are
                                                  the previous sentence is ‘our’—the young
tantamount to crimes towards young people
                                                  people of New Zealand are our young people.
themselves.
                                                  They are not an enemy to be feared. Neither
In this State of the Nation 2012 report, it       are they a group to be suspicious of. It is
is argued that children’s vulnerability is        intriguing to observe the portrayal of young
not necessarily about poor parenting or           people by mainstream media and other
ineffective policies. Instead our argument is     modes of mass communication. Globally,
that a child’s vulnerability is directly linked   young people in recent times have been
to the social and economic environments           portrayed very negatively by the media. The
that a child grows up in. This reasoning can      same seems to be happening locally.
be extended further to describe some of the
vulnerable situations and factors our young       George Bernard Shaw once famously
people face today. The social and economic
                                                  said that ‘youth is such a wonderful
environment that young people are growing
up in, and entering as they get older, greatly
                                                  thing … what a crime it is to waste it
affects the state of their holistic well-being,   on the young’. Some of the injustices
and will have repercussions on our nation’s       and dire situations that our young
development for years to come.                    people are facing in today’s world are
State of the Nation 2012                          tantamount to crimes towards young
This report has commented about some of the       people themselves.
key social and economic indicators directly
affecting our young people. These include         During the alcohol law reform process and
youth offending, educational achievement,         debates in recent years within New Zealand,
teenage pregnancy and unemployment. In            there was a huge amount of noise in the
this brief section, we will discuss two other     media about teenage alcohol abuse and
critical indicators that we should continue       binge drinking by young people. Conversely,
to monitor. We present these additional           the annual Alcohol Advisory Council of New
factors to help create an accurate snapshot       Zealand (ALAC) summary report for the
of the state of our young people, to give us      2009/10 year actually clarifies that binge
some more insight into youth well-being, and      drinking 33 is more of an issue for those

                                                                            A SNAPSHOT OF OUR YOUNG PEOPLE   | 21
aged over 18 (21 per cent of adults), than In 2008/09, there was over $106 million
for younger people aged 12 to 17 years (15 spent on youth employment training and
per cent of young people).34 In fact, ALAC support.36 By 2011/12, this figure had dropped
estimates that 44% of both males and females significantly to about $81 million.37 At the
aged 18 to 24 can be classed as engaging in same time, the Government has consistently
some form of binge drinking, as illustrated in increased the support it gives to tertiary
Table 7 from the ALAC report.35 education, up from $1.75 billion in 2008 to
The potential for alcohol abuse is more approximately $2.02 billion in 2012.
prevalent in New Zealand among adults aged These figures are worrying. Firstly, the drop
18 and over, particularly adults aged 18 to 24, in youth employment training and support
than for young teenagers. Yet the image often funding is confusing given the high youth
presented to the public is that alcohol abuse unemployment rate sitting at about 23.4%
is often and exclusively a problem involving in September 2011. The training and support
young, teenaged people. programmes needed to help young people
Image is often everything in the social get into work are seemingly not being funded
and economic world of today. The images adequately. Additionally, it is positive that
presented of young people need to be the Government has increased its spend on
accurate and not sensationalised, to ensure tertiary institutions. However, not all young
that our collective attitude towards young people will enter into tertiary education.
Ma–ori and Pasifika numbers of young people
people is informed, honest and productive.
Young people cannot and should not be attending tertiary institutions are increasing
marginalised in our society. The images we but are still low compared to other ethnic
present of young people can help shape our groups. These figures are further complicated
attitude towards them and reduce the harm when young people classified as NEET (not
caused by marginalising them in the media engaged in employment, education or
and public discourse. training) are added to the mix. In September
2011, 16.4% of Ma–ori youth and 13.7% of
A Plethora of Pathways? Really? Pasifika young people were estimated as
The global financial crisis is a very real NEET.38 The NEET rate currently sits at about
and sometimes misunderstood reality for 12% of our young people in New Zealand.39
many nations. Young people in our country
have seemingly borne the brunt of the
Government’s current approach of fiscal
efficiency and cost-cutting during this
recession.
22 | THE GROWING DIVIDEConclusion
There is insufficient room here to discuss
other key social and economic factors that
affect the well-being of young people in
New Zealand. What about the mental health
and suicide rates of our young people? Is
the transition from youth to adulthood
effective and empowering for our youth?
The Salvation Army will continue to look at
some of these issues throughout 2012. It is
enough to say that the state of our young
people today is very uncertain. Yet there is
still hope. There is always hope. We have the
ability to adjust and change these social and
economic conditions. We just need some
boldness, some imagination … and we need to
remember that they are our young people.
Table 7: Youth drinking behaviours 2009–201060
MALES AGED FEMALES AGED ALL YOUTH
Ages 12–14 15–17 18–24 12–14 15–17 18–24 12–24
Non-drinkers 88% 46% 11% 90% 49% 11% 39%
Moderate drinkers 7% 27% 45% 8% 25% 45% 31%
Binge drinkers 4% 27% 44% 2% 26% 44% 30%
A SNAPSHOT OF OUR YOUNG PEOPLE | 23A Corrections Officer in a low security unit at Rimutaka Prison. Photography: Dominion Post, 1 September 2011 24 | THE GROWING DIVIDE
CRIME AND PUNISHMENT

Surveys of New Zealanders’ experience of          Headline Crime Rate Drops Again
crime have consistently told us that less         There were 416,324 offences reported to
than half of crime is actually reported to        Police for the year ended 30th June 2011, a
Police. For example, the 2009 New Zealand         5.8% drop from the previous year and a 2.4%
Crime and Safety Survey showed that just          decline from five years previously in 2005/06.
40% of offences were reported, including          When we take account of population growth,
less than one third of assaults. This level       these declines are even more encouraging.
of non-reporting makes it difficult to gain       The overall rate of reported crime during the
a full picture of criminal offending across       year to 30th June 2011 was 9482 reported
New Zealand and of the harm caused by             offences for every 100,000 people, a 6.8%
this offending. However, the consistency in       decline from the previous year’s rate of 10,171
levels and patterns of non-reporting across       offences per 100,000 people. The 2010/11
different surveys 40 suggests that the extent     outcome is 7.4% lower than five years ago and
and nature of reporting and non-reporting of      is, in fact, the lowest overall crime rate in over
crime has changed little over the recent past.    a decade.41
This consistency at least allows us to use
                                                  Police resolution of crime fell slightly during
statistics on reported crime as an indicator of
                                                  2010/11 from 48.1% of all crime in 2009/10
overall levels of offending and victimisation,
                                                  to 47.3% in 2010/11, although as shown in
even though these statistics cannot be relied
                                                  Table 8 the resolution rate for the most recent
on to give us a full or accurate picture.
                                                  year remains significantly higher than five
OVERALL CRIME                                     years ago in 2005/06, when it was 44.2%.

The data reported below suggests that levels      This pattern of a slight decline in resolution

of criminal offending across New Zealand          rates between 2009/10 and 2010/11 is fairly

are falling—even within categories of more        consistent across most categories of crime.

serious crime.                                    As in previous years, drug offences have
                                                  the highest resolution rates at 92.0%, while
Against this background of modest but
                                                  burglaries have the lowest resolution rate
encouraging declines in rates of criminal
                                                  at 15.2%—the lowest resolution rate for
offending, we are continuing to see both
                                                  this type of crime in over a decade. These
an increase in rates of imprisonment and of
                                                  differences in resolution rates are often
other forms of punishment, and planning by
                                                  related to how the offences come to Police
Department of Corrections to increase prison
                                                  attention.
capacity even further.

                                                                                        CRIME AND PUNISHMENT   | 25
You can also read