Consolidating Canada's Automotive Dealership Properties
←
→
Page content transcription
If your browser does not render page correctly, please read the page content below
2019 ANNUAL REPORT

Consolidating Canada’s
 Automotive Dealership
            Properties

                        TM
Dear fellow unitholders,

Please find enclosed Automotive Properties REIT’s (“APR” or the “REIT”) 2019 Management Discussion
and Analysis and Financial Statements.

We maintained our track record of positive momentum in 2019 with continued growth in the REIT’s AFFO
and property portfolio, in addition to a strengthened balance sheet at year-end. This builds upon the
consistent, steady execution of our growth strategy since the time of APR’s initial public offering in 2015.
Today, the quality of the REIT’s assets, enhanced diversification, increased scale and available liquidity,
positions us well as we face this period of economic uncertainty caused by the COVID-19 pandemic.

We expanded and strengthened APR’s property portfolio through acquisitions in 2019, with the addition
of seven dealership properties for a combined purchase price of approximately $100 million. Through
these acquisitions, we further diversified the REIT’s tenant base and geographic presence in attractive
metropolitan markets across Canada.

APR’s expanding property portfolio and triple-net leases with contractual rent increases continues to drive
significant growth in each of our key performance measures. In comparison to 2018, the REIT’s property
rental revenue grew 40.1%, cash net operating income increased by 42.3%, and Adjusted Funds from
Operations (“AFFO”) grew by 36.3%. AFFO per unit increased to 90.8 cents, up from 87 cents a year ago.
This growth in AFFO per unit was achieved even as we issued approximately 7.9 million REIT units in the
third week of December through a $92 million equity offering and have yet to fully deploy proceeds from
this offering. The REIT’s 2019 AFFO per unit figure also reflects a one-time cost of approximately $1 million
related to the internalization of the REIT’s management and operations.

For 2019, the REIT paid total distributions of $28.7 million to unitholders, representing an AFFO payout
ratio of 88.6 percent. Excluding one-time costs associated with the aforementioned internalization, our
AFFO payout ratio for 2019 would have been 86.1 percent, in line with our target range.

The internalization of the REIT’s management and operations was an important milestone, signifying the
next step in APR’s ongoing development and growth, and providing further alignment with unitholders.
The REIT’s Strategic Alliance Agreement with the Dilawri Group has remained intact. Subsequent to 2019,
in early February 2020, APR completed the acquisitions of two more dealership properties from Dilawri,
Regina BMW and North Shore Acura in Vancouver, for an aggregate purchase price of $28.9 million.

To support APR’s growth, we completed two public equity offerings in 2019, raising aggregate gross
proceeds of approximately $176 million, thereby further enhancing the REIT’s capital market liquidity and
positioning APR for continued expansion of its portfolio through acquisitions.

This strong momentum was interrupted in March 2020 due to the COVID-19 public health crisis and
related economic uncertainty. Fortunately, our December 2019 equity raise has provided us with a strong
liquidity position to manage through this period. The REIT currently has $65 million in undrawn credit
facilities, approximately $19.5 million in cash, and eight unencumbered properties with an IFRS value in
excess of $100 million.

                                                                                                           1
APR has a well-balanced level of annual debt maturities, with interest rate swap terms ranging between
three and 8.8 years, and a weighted average interest rate swap term of six years. The REIT’s capital
requirements over the next two years are low and capital expenditure requirements are expected to be
minimal. APR’s debt to GBV is approximately 44%, well below our target of approximately 55% with capital
fully deployed.

The COVID-19 pandemic is having a significant near-term, adverse impact on the automotive dealership
industry. APR is working to support its tenants during this difficult time. Since inception of the REIT, we
have been selective on which dealership groups we choose to partner with. Accordingly, we have full
confidence in our tenants and expect them to rebound from this pandemic, though the timing is uncertain.
It is important to remember that automobiles are an essential part of our daily lives, and current delays
in vehicle service or purchases are expected to provide a strong recovery for our tenants as the crisis
subsides.

We are now focused on prudently managing the REIT’s available resources and liquidity during this period
of economic uncertainty. We have also proactively raised our level of planning to adapt more quickly
should risk levels rise and we will continue to monitor and adjust our business continuity and other plans
as this situation evolves.

With a strong liquidity position, long-term, triple-net lease structure, 100% occupancy with some of
Canada’s largest automotive dealership groups, strong relationships with lenders, and a portfolio of
properties located in attractive commercial corridors of major Canadian urban markets, APR is well
positioned to weather this period of uncertainty.

As conditions improve, we look forward to resuming our strategy of further expanding and diversifying
the REIT’s property portfolio through accretive consolidation opportunities in attractive markets, growing
cash flow in support of unitholder distributions and building long-term value for all of our stakeholders.

On behalf of the Board of Trustees and management of Automotive Properties REIT, thank you for your
confidence and support.

Kapil Dilawri                                                    Milton Lamb
Chair of the Board                                               President & Chief Executive Officer

                                                                                                         2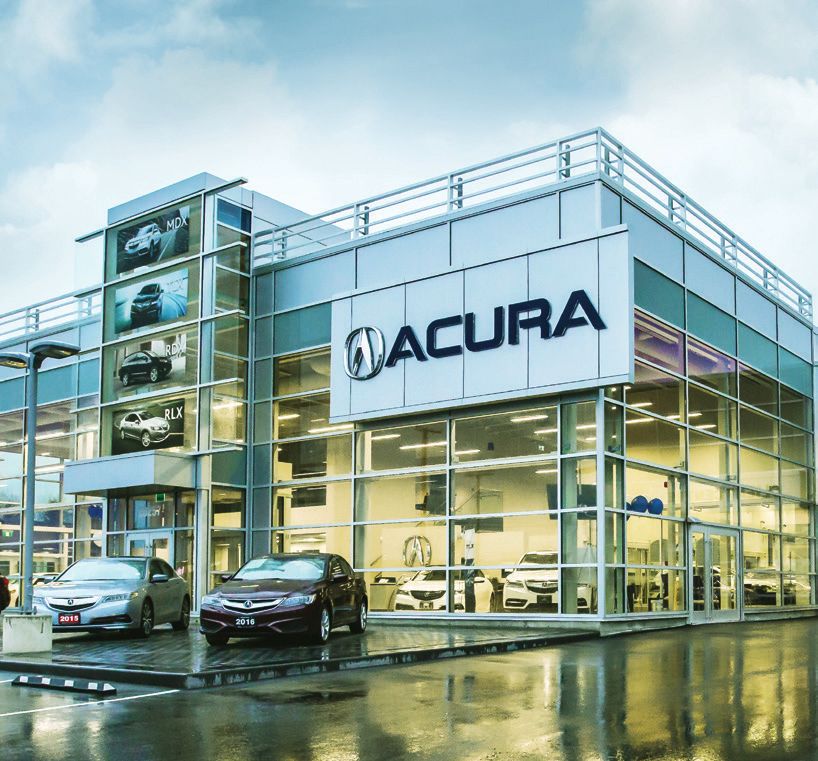
Automotive Properties Real Estate Investment Trust
       Management’s Discussion and Analysis
                  December 31, 2019
Table of Contents

SECTION 1 – GENERAL INFORMATION AND CAUTIONARY STATEMENTS......................................... 3
      Basis of Presentation ....................................................................................................................... 3
      The REIT.......................................................................................................................................... 3
      Forward-Looking Statements........................................................................................................... 5
      Non-IFRS Financial Measures......................................................................................................... 6

SECTION 2 – OVERVIEW, STRATEGY AND OBJECTIVES ...................................................................... 8
      Overview .......................................................................................................................................... 8
      Strategy and Objectives ................................................................................................................... 9

SECTION 3 - PROPERTY PORTFOLIO .................................................................................................... 10
      Portfolio Overview .......................................................................................................................... 10
      Income Producing Property Portfolio Summary ............................................................................ 11
      Profile of the Dilawri Leases .......................................................................................................... 11
      Profile of Other Leases .................................................................................................................. 12
      Profile of Overall Lease Maturity.................................................................................................... 12
      Property Use and Brand Diversification ......................................................................................... 12
      Description of the REIT’s Key Tenant ........................................................................................... 14
      Dilawri Additional and Non-ASPE Measures ................................................................................. 14

SECTION 4 –KEY PERFORMANCE INDICATORS AND SELECTED FINANCIAL INFORMATION ....... 15

SECTION 5 – RESULTS OF OPERATIONS ............................................................................................. 16
      Net Income (Loss) and Comprehensive Income (Loss) ................................................................ 16
      Rental Revenue and Property Costs ............................................................................................. 16
      General and Administrative Expenses .......................................................................................... 17
      Interest Expense and Other Financing Charges ........................................................................... 17
      Changes in Fair Values of Investment Properties ......................................................................... 18
      Changes in Fair Values of Class B LP Units, DUs, IDUs and Interest Rate Swaps ..................... 18

SECTION 6 – NON-IFRS FINANCIAL MEASURES .................................................................................. 18
      Reconciliation of NOI, Cash NOI, FFO and AFFO to Net Income (Loss)
      and Comprehensive Income (Loss) ............................................................................................... 18
      FFO, AFFO and Cash NOI ............................................................................................................ 19
      Same Property Cash Net Operating Income ................................................................................. 20
      Reconciliation of Cash Flow from Operating Activities to ACFO ................................................... 20

SECTION 7 – LIQUIDITY AND CAPITAL RESOURCES........................................................................... 22
      Capital Structure ............................................................................................................................ 22
      Debt Financing ............................................................................................................................... 23
      Unitholders’ Equity (including Class B LP Units) ........................................................................... 24
      Financing Metrics and Debt Covenants ......................................................................................... 26

SECTION 8 – RELATED PARTY TRANSACTIONS .................................................................................. 27
      Administration Agreement ............................................................................................................. 28

Automotive Properties REIT 2019                                                                                                                                   1
Automotive Properties REIT 2019                                                                                                                               1
Strategic Alliance Agreement ........................................................................................................ 29

SECTION 9 − OUTLOOK ........................................................................................................................... 29

SECTION 10 – OTHER DISCLOSURES ................................................................................................... 30
      Commitments and Contingencies .................................................................................................. 30
      Disclosure Controls and Internal Controls over Financial Reporting ............................................. 30

SECTION 11 – QUARTERLY RESULTS OF OPERATIONS .................................................................... 31

SECTION 12 – RISKS & UNCERTAINTIES, CRITICAL JUDGEMENTS & ESTIMATES ......................... 32

APPENDIX .................................................................................................................................................. 49
     Property List as at December 31, 2019 ......................................................................................... 49

Automotive Properties REIT 2019                                                                                                                                      2
Automotive Properties REIT 2019                                                                                                                                  2
SECTION 1 – GENERAL INFORMATION AND CAUTIONARY STATEMENTS
Basis of Presentation
The following Management’s Discussion and Analysis (“MD&A”) of the financial position and results of operations of
Automotive Properties Real Estate Investment Trust (the “REIT”) is intended to provide readers with an assessment of
the performance of the REIT for the years ended December 31, 2019 and December 31, 2018. This MD&A also outlines
the REIT’s capital structure, operating strategies and business outlook. All dollar amounts in this MD&A are presented
in thousands of Canadian dollars, except unit and per unit amounts, unless otherwise noted. All comparisons of results
for the three months ended December 31, 2019 (“Q4 2019”) are against results for the three months ended December
31, 2018 (“Q4 2018”), and comparisons of results for the twelve months ended December 31, 2019 (“2019”) are against
results for the twelve months ended December 31, 2018 (“2018”).
This MD&A should be read in conjunction with the audited consolidated financial statements of the REIT and
accompanying notes for the years ended December 31, 2019 and December 31, 2018. Further information about the
REIT can be found in the REIT’s annual information form dated March 23, 2020 (the “AIF”). The AIF, along with other
continuous disclosure documents required by the Canadian securities regulators, can be found on the REIT’s SEDAR
profile at www.sedar.com and on the REIT’s website at www.automotivepropertiesreit.ca.

The REIT
The REIT was formed primarily to own income producing automotive dealership properties located in Canada. The REIT
commenced operations on July 22, 2015 following completion of its initial public offering of units (the “IPO”). In
connection with the IPO, the REIT indirectly acquired a portfolio of 26 commercial properties from certain members of
the Dilawri Group (as defined below) (the “Initial Properties”), and leased the Initial Properties to the applicable member
of the Dilawri Group (collectively, and including members of the Dilawri Group that became tenants of a property owned
by the REIT subsequent to the IPO, the “Dilawri Tenants”).
As at the date of this MD&A, the REIT owns a portfolio of 64 income-producing commercial properties. The properties
are located in metropolitan areas across British Columbia, Alberta, Saskatchewan, Manitoba, Ontario and Quebec,
totaling approximately 2.4 million square feet of gross leasable area (“GLA”).
893353 Alberta Inc. (“Dilawri”) is a privately held corporation which, together with certain of its affiliates, holds an
approximate 25.6% effective interest in the REIT as at December 31, 2019, through the ownership, direction or control
of all of the Class B limited partnership units (“Class B LP Units”) of Automotive Properties Limited Partnership, the
REIT’s operating subsidiary (the “Partnership”), and 2,280,552 REIT Units (as defined below). The Class B LP Units are
economically equivalent to REIT Units and are exchangeable generally on a one-for-one basis for REIT Units. Dilawri
and its affiliates, other than its shareholders and controlling persons, are referred to herein as the “Dilawri Group”.
In January 2019, the REIT’s former development property in Kitchener-Waterloo, Ontario, became classified as an
income-producing property. The tenant, Tesla Motors Canada ULC (“Tesla KW”), has opened a service centre on the
premises.
On March 29, 2019, the REIT acquired from AutoCanada Inc. the real estate underlying two automotive dealership
properties located in Winnipeg, Manitoba (“St. James VW” and “McNaught Cadillac Buick GMC”) for approximately
$23,950, plus capital improvement costs of $245 and acquisition costs of $685. The acquisition consists of two full-
service automotive dealership properties totaling 96,135 square feet of GLA.
On June 25, 2019, the REIT acquired from AutoCanada Inc. the real estate underlying three automotive dealership
properties, including two located in Guelph, Ontario (“Wellington Motors” and “Guelph Hyundai”), and one located in
Abbotsford, British Columbia (“Abbotsford VW”), for approximately $30,400, plus acquisition costs of $518. The
acquisition consists of three full-service automotive dealership properties totaling 91,721 square feet of GLA.
On June 28, 2019, the REIT issued an aggregate of 8,000,000 trust units of the REIT (“REIT Units”) at a price of $10.45
per REIT Unit in connection with a public offering of REIT Units for gross proceeds of $83,600 (the “June Equity

Automotive Properties REIT 2019                                                                                    3
Automotive Properties REIT 2019                                                                                3
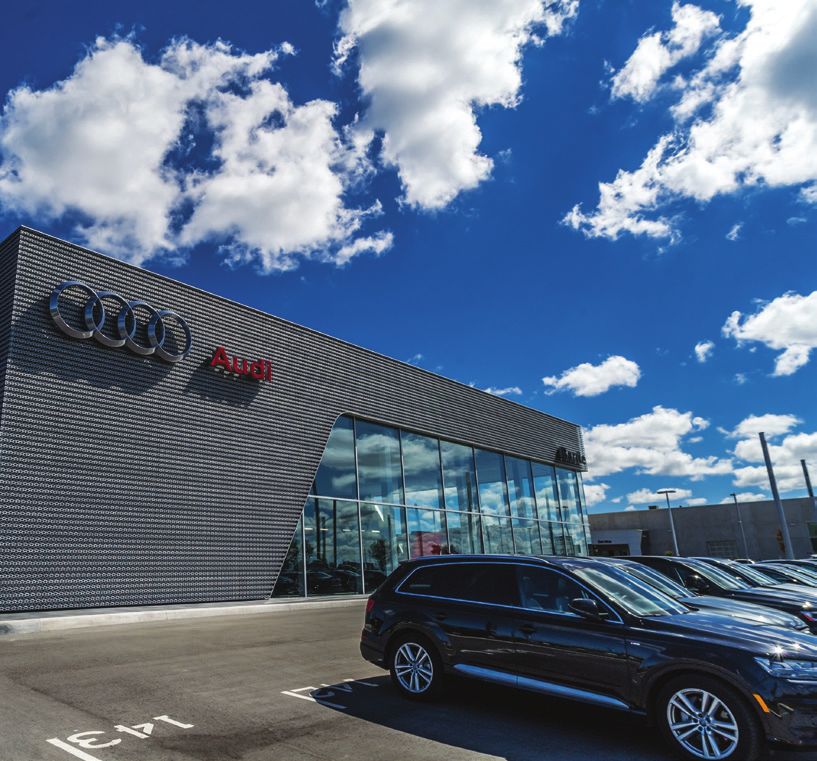
Offering”). The REIT incurred issuance costs of $3,829. The June Equity Offering included 1,000,000 REIT Units issued
upon the partial exercise of the underwriters’ over-allotment option. The Dilawri Group waived its pre-emptive right to
acquire REIT Units in connection with the June Equity Offering.
On September 19, 2019, the REIT acquired from the Dilawri Group the real estate underlying an automotive dealership
property located in Etobicoke, Ontario (“Audi Queensway”) for approximately $36,500, plus acquisition costs of $1,556.
The acquisition consists of a full-service automotive dealership property totaling 65,547 square feet of GLA.
On December 3, 2019, the REIT announced that the independent trustees of the REIT (the “Independent Trustees”) had
notified Dilawri of the REIT’s intention to terminate the Administration Agreement effective December 31, 2019.
Following termination of the Administration Agreement, the REIT’s management, operating and administrative support
personnel were employed directly by the REIT. As the termination of the Administration Agreement was completed in
accordance with its terms, the REIT was not required to pay Dilawri any termination fees. See Section 8 “Related Party
Transactions”.
On December 16, 2019, the REIT acquired the real estate underlying an automotive dealership property located in
Calgary, Alberta (“Straightline Kia”) for approximately $8,415, plus acquisition costs of $90. The acquisition consists of
a full-service automotive dealership property totaling 21,808 square feet of GLA.
The REIT provided capital commitments for facility improvements to the tenants of the 401 Dixie Automall and
Meadowvale Honda automotive dealership properties located in Mississauga, Ontario. The total capital commitments
were approximately $7,000 in aggregate, plus transaction costs of $7, and resulted in an annual rent increase for both
properties effective December 16, 2019. An additional $1,401 of capital commitments for facility improvements was
provided to another tenant in 2019.
On December 23, 2019, the REIT issued an aggregate of 7,900,500 REIT Units at a price of $11.65 per REIT Unit in
connection with a public offering of REIT Units for gross proceeds of $92,041 (the “December Equity Offering”). The
REIT incurred issuance costs of $3,389. The December Equity Offering included 1,030,500 REIT Units issued upon the
full exercise of the underwriters’ over-allotment option. The Dilawri Group exercised its pre-emptive right to acquire
1,800,000 REIT Units in connection with the December Equity Offering.
As at December 31, 2019, the total number of issued and outstanding REIT Units and Class B LP Units was 37,697,052
and 9,933,253, respectively, for a total of 47,630,305 Units (as defined below). The REIT Units are listed on the Toronto
Stock Exchange under the symbol “APR.UN”. REIT Units and Class B LP Units are collectively referred to in this MD&A
as “Units”.
The REIT announced monthly cash distributions of $0.067 per REIT Unit, resulting in total distributions declared of
$8,515 and paid of $7,986 for Q4 2019 (Q4 2018 - declared $6,378 and paid $6,036). For the year ended December
31, 2019, the REIT declared distributions of $29,794 and paid distributions of $28,729 (2018 - declared $22,276 and
paid $21,901).
The REIT became internally managed effective as of December 31, 2019 (the “Internalization’). Prior to December 31,
2019, the REIT was externally administered by Dilawri pursuant to the Administration Agreement. The Strategic Alliance
Agreement with Dilawri continues to allow the REIT to benefit from a preferential relationship with Dilawri as Dilawri
develops and acquires automotive dealerships in the future. These agreements are described under Section 8 “Related
Party Transactions” in this MD&A.
On February 5, 2020, the REIT entered into an agreement to purchase the BMW Regina automotive dealership property
(“BMW Regina Property”), for $11,350 from the Dilawri Group. The BMW Regina Property is a 19,619 square foot, full-
service automotive dealership facility.
On February 6, 2020, the REIT entered into an agreement to purchase the North Shore Acura automotive dealership
property (“North Shore Acura Property”), for $17,500 from the Dilawri Group. The North Shore Acura Property is a
22,273 square foot, full-service automotive dealership facility.
The REIT provided capital commitments for facility improvements to one of the tenants of the automotive dealership
properties located in Winnipeg, Manitoba. The total capital commitment of $2,003, results in an annual rent increase
effective March 6, 2020.
Automotive Properties REIT 2019                                                                            4
Automotive Properties REIT 2019                                                                               4
This MD&A is dated March 23, 2020.
Forward-Looking Statements
Certain statements contained in this MD&A constitute forward-looking information within the meaning of securities laws.
Forward-looking information may relate to the REIT’s future outlook and anticipated events or results and may include
statements regarding the financial position, business strategy, budgets, litigation, projected costs, capital expenditures,
financial results, taxes, plans and objectives of or involving the REIT. Particularly, statements regarding future results,
performance, achievements, prospects or opportunities for the REIT or the real estate or automotive dealership industry
are forward-looking statements. In some cases, forward-looking information can be identified by terms such as “may”,
“might”, “will”, “could”, “should”, “would”, “occur”, “expect”, “plan”, “anticipate”, “believe”, “intend”, “estimate”, “predict”,
“potential”, “continue”, “likely”, “schedule”, “objectives”, or the negative thereof or other similar expressions concerning
matters that are not historical facts. Some of the specific forward-looking statements in this MD&A include, but are not
limited to, statements with respect to the following:
the impact of the global coronavirus (COVID-19) pandemic on the REIT;
the REIT’s relationship with the Dilawri Group, Dilawri’s shareholders and certain other related persons and
entities (collectively, the “Dilawri Organization”), including in respect of (i) the Dilawri Organization’s retained
interest in the REIT and its current intention with respect thereto, and (ii) expected transactions to be entered
into between Dilawri and the REIT (including pursuant to the Strategic Alliance Agreement);
the expenditures related to the Tesla KW property;
the REIT’s intention with respect to, and ability to execute, its external and internal growth strategies;
the level of new vehicle sales in Canada in 2020;
the maintenance by the REIT of a strong balance sheet and prudent financial management and associated
minimization of financial risk;
the REIT representing a unique alternative for automotive dealership operators considering a sale or
recapitalization of their business;
the REIT’s estimated increase in general and administrative expenses in 2020 due to the Internalization;
the REIT’s capital expenditure requirements and capital expenditures to be made by the REIT and the Dilawri
Group;
the REIT’s distribution policy and the distributions to be paid to Unitholders (as defined below);
the REIT’s debt strategy;
the REIT’s access to available sources of debt and/or equity financing;
the expected tax treatment of the REIT and its distributions to Unitholders;
potential trade tariff policies and their impact on future retail automotive sales;
the REIT’s ability to meet its stated objectives;
the REIT’s ability to expand its asset base and make accretive acquisitions;
the ability of the REIT to qualify as a “Mutual Fund Trust” as defined in the Income Tax Act (Canada) (the “Tax
Act”), and as a “Real Estate Investment Trust”, as defined in the SIFT Rules (as defined below); and
the REIT’s ability to consolidate automotive dealership properties.
The REIT has based these forward-looking statements on factors and assumptions about future events and financial
trends that it believes may affect its financial condition, results of operations, business strategy and financial needs,
Automotive Properties REIT 2019 5
Automotive Properties REIT 2019 5including that inflation will remain relatively low, that interest rates will remain stable or at lower levels for the near term, that tax laws remain unchanged, that conditions within the automotive dealership real estate industry and the automotive dealership industry generally, including competition for acquisitions, will be consistent with the current climate, that the Canadian capital markets will provide the REIT with access to equity and/or debt at reasonable rates when required and that the Dilawri Organization will continue its involvement with the REIT. Although the forward-looking statements contained in this MD&A are based upon assumptions that management believes are reasonable based on information currently available to management, there can be no assurance that actual results will be consistent with these forward-looking statements. Forward-looking statements necessarily involve known and unknown risks and uncertainties, many of which are beyond the REIT’s control, that may cause the REIT’s or the industry’s actual results, performance, achievements, prospects and opportunities in future periods to differ materially from those expressed or implied by such forward-looking statements. These risks and uncertainties include, among other things, the factors contained in the REIT’s filings with securities regulators, including the factors discussed under Section 12 “Risks & Uncertainties, Critical Judgments & Estimates” in this MD&A. When relying on forward-looking statements to make decisions, the REIT cautions readers not to place undue reliance on these statements, as forward-looking statements involve significant risks and uncertainties and should not be read as guarantees of future performance or results and will not necessarily be accurate indications of whether or not the times at or by which such performance or results will be achieved. The forward-looking statements made in this MD&A relate only to events or information as of the date of this MD&A. Except as required by law, the REIT undertakes no obligation to update or revise publicly any forward-looking statements, whether as a result of new information, future events or otherwise, after the date on which the statements are made or to reflect the occurrence of unanticipated events. All information regarding Dilawri contained in this MD&A (the “Dilawri Information”) has been provided by and is solely the responsibility of Dilawri and not of the REIT, the REIT’s management nor the trustees of the REIT (the “Trustees”). Although the REIT has no reason to believe that the Dilawri Information contains a misrepresentation, Dilawri is a private company that is independent of, and operates entirely independently from, the REIT and, consequently, neither the REIT, its management nor its Trustees (in their capacities as such) have been involved in the preparation of the Dilawri Information, nor has the REIT approved such information. Readers are cautioned, therefore, not to place undue reliance on the Dilawri Information. Non-IFRS Financial Measures The REIT prepares its financial statements according to International Financial Reporting Standards (“IFRS”) as issued by the International Accounting Standards Board (“IASB”). This MD&A contains certain financial measures which are not defined under IFRS and may not be comparable to similar measures presented by other real estate investment trusts or enterprises. Funds from operations (“FFO”), adjusted funds from operations (“AFFO”), adjusted cash flow from operations (“ACFO”), FFO payout ratio, AFFO payout ratio, ACFO payout ratio, net operating income (“NOI”), cash net operating income (“Cash NOI”), Same Property cash net operating income (“Same Property Cash NOI”), and earnings before income tax, depreciation, and amortization (“EBITDA”) are key measures of performance used by the REIT’s management and real estate businesses. Gross book value (“GBV”), indebtedness (“Indebtedness”), net asset value (“Net Asset Value”), debt to gross book value (“Debt to GBV”), debt service coverage ratio (“Debt Service Coverage Ratio”), interest coverage ratio (“Interest Coverage Ratio”) and tangible net worth are measures of financial position defined by agreements to which the REIT is a party. These measures, as well as any associated “per Unit” amounts are not defined by IFRS and do not have standardized meanings prescribed by IFRS, and therefore should not be construed as alternatives to net income or cash flow from operating activities calculated in accordance with IFRS. The REIT believes that AFFO is an important measure of economic earnings performance and is indicative of the REIT’s ability to pay distributions from earnings, while FFO, NOI, Cash NOI, Same Property Cash NOI and EBITDA are Automotive Properties REIT 2019 6 Automotive Properties REIT 2019 6
important measures of operating performance of real estate businesses and properties. The IFRS measurement most
directly comparable to FFO, AFFO, NOI, Cash NOI, Same Property Cash NOI and EBITDA is net income. ACFO is a
supplementary measure used by management to improve the understanding of the operating cash flow of the REIT.
The IFRS measurement most directly comparable to ACFO is cash flow from operating activities.
“FFO” is a non-IFRS financial measure of operating performance widely used by the real estate industry, particularly by
those publicly traded entities that own and operate income-producing properties. FFO should not be considered as an
alternative to net income or cash flows provided by operating activities determined in accordance with IFRS. The REIT
calculates FFO in accordance with the Real Property Association of Canada’s White Paper on Funds from Operations
& Adjusted Funds from Operations for IFRS issued in February 2019. FFO is calculated as net income in accordance
with IFRS, adjusted by removing the impact of: (i) fair value adjustments on investment properties; (ii) other fair value
adjustments including fair value adjustments on redeemable or exchangeable units; (iii) gains and losses on the sale of
investment properties; (iv) amortization of tenant incentives; (v) distributions on redeemable or exchangeable units
treated as interest expense; and (vi) operational revenue and expenses from the right-of-use assets in respect of Q4
2019 and 2019 (referred to as “ROU” assets).
“FFO payout ratio” is calculated as distributions paid per Unit divided by the FFO per Unit diluted.
“AFFO” is a non-IFRS measure of economic earnings operating performance widely used in the real estate industry to
assess an entity’s distribution capacity from earnings. The REIT calculates AFFO in accordance with the Real Property
Association of Canada’s White Paper on Funds from Operations & Adjusted Funds from Operations for IFRS issued in
February 2019. AFFO is calculated as FFO subject to certain adjustments, to remove the impact of: (i) any adjustments
resulting from recognizing property rental revenues or expenses (including ground lease rental payments in respect of
Q4 2019 and 2019) on a straight-line basis; and (ii) capital expenditures. Beginning in the first quarter of 2019 (“Q1
2019), the REIT adopted a capital expenditure reserve of 0.5% of base rent in the AFFO calculation. To date, the REIT
has not incurred capital expenditure costs. The capital expenditure reserve is based on management’s best estimate of
cost that the REIT may incur, related to the sustaining/maintaining of the existing leased area.
“AFFO payout ratio” is a non-IFRS measure of the sustainability of the REIT’s distribution payout capacity from earnings.
The REIT uses this metric to provide clarity of the performance of earnings and the overall management of the current
portfolio of assets. Management considers AFFO payout ratio as the key measure of the REIT’s distribution capacity
from earnings. AFFO payout ratio is calculated as distributions paid per Unit divided by AFFO per Unit diluted.
“ACFO” is a non-IFRS financial measure. The REIT calculates ACFO in accordance with the Real Property Association
of Canada’s White Paper on Adjusted Cash Flow from Operations for IFRS issued in February 2019. ACFO is calculated
as cash flow from operating activities subject to certain adjustments, to (a) remove the impact of: (i) changes in non-
cash working capital that are not sustainable in nature; (ii) amortization of financing costs and indemnity payable in
respect of the third party tenant portfolio sublease structure; and (iii) capital expenditures and (b) deduct interest
expense. Beginning in Q1 2019, the REIT adopted a capital expenditure reserve of 0.5% of base rent in the ACFO
calculation. To date, the REIT has not incurred capital expenditure costs. The capital expenditure reserve is based on
management’s best estimate of cost that the REIT may incur, related to the sustaining/maintaining of the existing leased
area.
“ACFO payout ratio” is calculated as distributions declared divided by ACFO.
“NOI” is a non-IFRS financial measure and is defined as rental revenue from properties less property operating expenses
as presented in the statement of income prepared in accordance with IFRS. Accordingly, NOI excludes certain expenses
included in the determination of net income such as interest, general and administrative expenses, fair value adjustments
and amortization.
“Cash NOI” is defined as NOI prior to the effects of straight-line adjustments. Beginning in Q1 2019, Cash NOI also
deducts land lease payments.

Automotive Properties REIT 2019                                                                                  7
Automotive Properties REIT 2019                                                                              7
“Same Property Cash NOI” is a non-IFRS measure which reports the period-over-period performance of the same asset
base having consistent GLA during both periods of Cash NOI. The REIT uses this measure to assess financial returns
and changes in property value.
FFO, AFFO, FFO payout ratio, AFFO payout ratio, ACFO, ACFO payout ratio, NOI, Cash NOI and Same Property Cash
NOI should not be construed as alternatives to net income or cash flow from operating activities determined in
accordance with IFRS as indicators of the REIT’s performance. The REIT’s method of calculating FFO, AFFO, FFO
payout ratio, AFFO payout ratio, ACFO, ACFO payout ratio, NOI, Cash NOI and Same Property Cash NOI may differ
from other issuers’ methods and, accordingly, may not be comparable to measures used by other issuers. See Section
6 “Non-IFRS Financial Measures” in this MD&A for a reconciliation of these measures to net income or cash flow from
operating activities, as applicable.
“EBITDA” is defined as earnings before income tax, depreciation, and amortization.
“GBV” means, at any time, the greater of: (A) the book value of the assets of the REIT and its consolidated subsidiaries,
as shown on its then most recent consolidated balance sheet, less the amount of any receivable reflecting interest rate
subsidies on any debt assumed by the REIT; and (B) the historical cost of the investment properties, plus (i) the carrying
value of cash and cash equivalents, (ii) the carrying value of mortgages receivable, and (iii) the historical cost of other
assets and investments used in operations.
“Indebtedness” of the REIT means (without duplication): (i) any obligation for borrowed money (including, for greater
certainty, the full principal amount of convertible debt, notwithstanding its presentation under IFRS), (ii) any obligation
incurred in connection with the acquisition of property, assets or businesses, (iii) any obligation issued or assumed as
the deferred purchase price of property, (iv) any capital lease obligation (as defined under IFRS and in the Declaration
of Trust), and (v) any obligations of the type referred to in clauses (i) through (iv) of another entity, the payment of which
the REIT has guaranteed or for which the REIT is responsible or liable; provided that, (A) for the purpose of clauses (i)
through (v) an obligation will constitute Indebtedness of the REIT only to the extent that it would appear as a liability on
the consolidated balance sheet of the REIT in accordance with IFRS, (B) obligations referred to in clauses (i) through
(iii) exclude trade accounts payable, distributions payable to Unitholders or holders of other securities excluded from the
definition of Indebtedness pursuant to clause (C) below, accrued liabilities arising in the ordinary course of business
which are not overdue or which are being contested in good faith, deferred revenues, intangible liabilities, deferred
income taxes, deferred financing costs, tenant deposits and indebtedness with respect to the unpaid balance of
installment receipts where such indebtedness has a term not in excess of 12 months, and (D) REIT Units and Class B
LP Units, exchangeable securities and other equity securities that constitute debt under IFRS do not constitute
Indebtedness.
“Net Asset Value” means total assets less Indebtedness, accounts payable, accrued liabilities, credit facilities and
interest rate swaps.
“Debt to GBV” means the ratio of Indebtedness to GBV at a particular time.
“Debt Service” means the total payments of principal and interest on debt.
“Debt Service Coverage Ratio” means the ratio of EBITDA divided by Debt Service at a particular time.
“Interest Coverage Ratio” means the ratio of Cash NOI less general and administrative expenses divided by the total of
the interest expense and other financing charges.

SECTION 2 – OVERVIEW, STRATEGY AND OBJECTIVES
Overview
Canada’s automotive retail industry is characterized by strong industry fundamentals. According to Statistics Canada,
automotive retail industry sales totaled a record $165 billion in 2019 (up 2% from $161 billion in 2018), representing
approximately 27% of Canada’s overall retail sales of products and merchandise. Over the last 20 years, retail

Automotive Properties REIT 2019                                                                                       8
Automotive Properties REIT 2019                                                                                   8
automotive sales grew at a compound annual rate of 4.4%. The tables below contain new automobile sales by units in
Canada for the 2019 and 2018 calendar years:
Twelve Months Ended December 31 (units)
2019 YoY unit YoY % 2018
increase/ increase/
(decrease) (decrease)
Alberta 222,286 (14,483) (6.1%) 236,769
British Columbia and the Territories 208,315 (17,224) (7.6%) 225,539
Manitoba 57,402 (10,492) (15.5%) 67,894
New Brunswick 40,984 (330) (0.8%) 41,314
Newfoundland and Labrador 30,498 244 0.8% 30,254
Nova Scotia 51,146 (1,651) (3.1%) 52,797
Ontario 843,559 (18,754) (2.2%) 862,313
Prince Edward Island 8,110 376 4.9% 7,734
Québec 450,318 (10,676) (2.3%) 460,994
Saskatchewan 48,670 (1,554) (3.1%) 50,224
Total Canada 1,961,288 (74,544) (3.7%) 2,035,832
(Source: Statistics Canada)
New vehicle sales represent a portion of overall dealer profitability, with significant contribution of profit generated from
used vehicle sales, service and parts, finance and insurance. The REIT’s portfolio of diverse dealership properties,
strong industry fundamentals and an attractive leasing profile support the stability of distributions to holders of REIT
Units and Class B LP Units (collectively, “Unitholders”).
Strategy and Objectives
The primary strategy of the REIT is to create long-term value for Unitholders by generating sustainable tax-efficient cash
flow and capital appreciation, while maintaining a strong balance sheet and practicing prudent financial management.
The objectives of the REIT are to:
provide Unitholders with stable, predictable and growing monthly cash distributions on a tax-efficient basis;
enhance the value of the REIT’s assets in order to maximize long-term Unitholder value; and
expand the REIT’s asset base while also increasing the REIT’s AFFO per Unit, including through accretive
acquisitions.
Management intends to grow the value of the REIT’s real estate portfolio while also increasing AFFO per Unit through
accretive acquisitions and steady growth in rental rates. The REIT expects to be well-positioned to capitalize on
acquisition opportunities presented by third parties due to the fragmented nature of the automotive dealership market.
The REIT also expects to leverage its strategic arrangement with the Dilawri Group to acquire properties from the Dilawri
Group that meet the REIT’s investment criteria. Management intends to focus on obtaining new properties which have
the potential to contribute to the REIT’s ability to generate stable, predictable and growing monthly cash distributions to
Unitholders.
The REIT has a well defined, long term growth strategy which includes both external and internal elements.
External Growth
Accretive Acquisitions
Management believes that the REIT is well-positioned to capitalize on opportunities for accretive acquisitions from third-
party automotive dealership vendors due to certain features of the Canadian automotive dealership industry:
Fragmented ownership – Management estimates that the top 10 automotive dealership groups in Canada own
less than 10% of the approximately 3,500 automotive dealerships in Canada;
Automotive Properties REIT 2019 9
Automotive Properties REIT 2019 9 Capital redeployment needs – Monetizing the real estate underlying automotive dealership properties allows
dealers to retain control of their dealership while redeploying capital into other areas of their business; and
Succession planning issues – Management believes that for the majority of independent dealers, the dealership
and its underlying real estate together represent the single largest proportion of their wealth. Selling the
underlying real estate to the REIT can help such dealers address succession planning issues, particularly if the
transaction can be effected on a tax efficient basis.
Management believes that the REIT represents a unique alternative for automotive dealership operators considering a
sale or recapitalization of their business, as the REIT is at present the only publicly listed entity in Canada exclusively
focused on owning and acquiring automotive dealership properties.
The REIT evaluates acquisition opportunities based on a number of factors, including: valuation, expected financial
performance, stability of cash flows, physical features, existing leases, functionality of design, geographic market,
location, automotive brand representation and opportunity for future value enhancement.
Right of First Offer to Acquire REIT-Suitable Properties from the Dilawri Group
Management believes that its relationship with the Dilawri Group provides the REIT with additional opportunities to add
quality automotive dealership properties to its portfolio in an accretive manner. Pursuant to the Strategic Alliance
Agreement, the REIT has a right of first offer on properties that are suitable for use as an automotive dealership that are
acquired, developed, redeveloped, refurbished, repositioned or held for sale by the Dilawri Group.
Since completion of the IPO, the REIT has acquired 11 automotive dealership properties from the Dilawri Group under
the Strategic Alliance Agreement as of the date of this MD&A.
Internal Growth
Management believes that the REIT is well-positioned to achieve organic increases in cash flow and, as a result,
increase the value of its properties over time. These increases are expected to come from the following sources:
Each of the leases with a member of the Dilawri Group (each, a “Dilawri Lease”) contains annual contractual
basic rent escalators in the amount of 1.5% per annum. The Dilawri Leases are structured as triple-net leases
under which the tenant is responsible for all costs relating to repair and maintenance, realty taxes, property
insurance, utilities and non-structural capital improvements so that rent escalators are expected to flow directly
to NOI; and
Contractual fixed rent escalators or consumer price index adjustments are expected, wherever possible, to be
negotiated into new leases entered into by the REIT.
SECTION 3 - PROPERTY PORTFOLIO
Portfolio Overview
At December 31, 2019, the REIT’s portfolio consisted of 62 income-producing commercial properties. Out of the 62
income-producing commercial properties, 33 are exclusively occupied by the Dilawri Group for use as automotive
dealerships or, in one case, an automotive repair facility, while two of the other 29 properties are jointly occupied by the
Dilawri Group (for use as automotive dealerships) and one or more third parties (for use as automotive dealerships or
complementary uses, including restaurants), and the remaining 27 properties are exclusively occupied by other
dealership groups for use as automotive dealerships or for automotive dealership ancillary services, such as a vehicle
service compound facility or a repair facility. Consequently, the Dilawri Group is the REIT’s most significant tenant and
accounts for approximately 61.7% of the REIT’s base rent in 2019, including rent from properties subleased to third
parties (83.3% in 2018).
The applicable Dilawri Tenant is the lead tenant for Dixie Auto Mall until July 2030. A Dixie Auto Mall sub-tenant that
operated the Hyundai dealership moved from the premises at the end of the second quarter of 2019 (“Q2 2019”). As of
Automotive Properties REIT 2019 10
Automotive Properties REIT 2019 10December 31, 2019, the premises were leased but unoccupied; however, this change does not affect the term of the
applicable Dilawri Lease.
Overall, at December 31, 2019, the REIT’s properties had a weighted average rental rate of $25.29 per square foot.
Income Producing Property Portfolio Summary
Average Weighted
Number of rental rate Average Lease
As at December 31, 2019 Properties GLA (sq. ft.) (per sq. ft.)(1) Term (yrs)
Greater Vancouver Area (GVA) (2) 7 176,871 $34.79 13.6
Calgary 7 293,158 $25.71 12.6
Edmonton 6 174,350 $29.80 13.6
Regina 8 183,941 $20.75 9.4
Winnipeg 2 96,135 $17.55 18.3
KW/Guelph 3 87,300 $21.50 16.5
Greater Toronto Area (GTA) 13 691,908 $27.98 10.9
Ottawa/Kingston 11 303,817 $23.84 17.5
Greater Montréal Area (GMA) 5 317,608 $18.65 15.1
Total Portfolio 62 2,325,088 $25.29 13.4
Average Weighted
Number of rental rate Average Lease
As at December 31, 2018 Properties GLA (sq. ft.) (per sq. ft.)(1) Term (yrs)
Greater Vancouver Area (GVA) (2) 6 153,950 $33.57 13.9
Calgary 6 271,350 $25.13 13.4
Edmonton 6 174,350 $29.77 14.6
Regina 8 183,941 $20.44 10.4
Greater Toronto Area (GTA) 12 619,861 $26.29 11.0
Ottawa/Kingston 11 303,817 $23.61 18.5
Greater Montréal Area (GMA) 5 317,608 $18.48 16.1
Total Portfolio 54 2,024,877 $24.83 13.7
(1) Based on 2020 (12-month period) contractual rental revenue.
(2) Excludes Land leases, which expenses are passed on to the tenant.
Appendix “A” in this MD&A contains a list and description of the REIT’s properties as at December 31, 2019.
Profile of the Dilawri Leases
As at December 31, 2019, the remaining terms of the Dilawri Leases range from 6.5 years to 17.7 years, with a weighted
average lease term of approximately 12.0 years. As at December 31, 2019, the weighted average annual basic rent
payable under the Dilawri Leases is approximately $26.32 per square foot ($25.20 in 2018). The basic annual rental
rates of each of these leases increase by 1.5% each applicable lease year.
Material terms of the Dilawri Leases include the following:
Requirements to obtain the REIT’s consent for certain changes in use that might affect or impair the value of
the properties;
Options on the part of the applicable Dilawri Group tenant to extend the applicable Dilawri Lease for successive
five-year periods as long as the Dilawri Group tenant meets certain conditions;
The leases are triple-net to the REIT, with the Dilawri Group tenant responsible for costs relating to the
properties, including property taxes, repairs and maintenance;
Automotive Properties REIT 2019 11
Automotive Properties REIT 2019 11 Rights on the part of the applicable Dilawri Group tenant to cease operations under certain circumstances,
provided it continues to comply with the other terms of its Dilawri Lease; and
Other terms with respect to alterations, environmental covenants, assignment and subletting, damage and
destruction and tenant expansion.
A full description of the material terms of the Dilawri Leases is contained in the REIT’s AIF, which is available on SEDAR
at www.sedar.com.
Profile of Other Leases
All of the REIT’s other leases are tenanted by affiliates of other automotive dealership groups and, with the exception of
one property whereby the lease was assumed by the REIT at the time of acquiring the property, are substantially the
same as the Dilawri Leases, except for changes in contractual rental rates. Terms for the changes in contractual rental
rates for the REIT’s other leases are based on either a fixed amount, or on changes to consumer price indices (either
national or provincial, with some caps and floors), with the exception of one lease. The timing of the changes in
contractual rental rates vary lease by lease.
Profile of Overall Lease Maturity
With the exception of one property, the lease portfolio matures between 2026 and 2038 as set out in the chart below:
Lease Maturity Profile (*)
8.9% 12.5% 9.5%
5.0 8.2% 8.5% 8.0% 25%
7.6% 7.7%
7.0%
7.0%
4.0 20%
% of Cash NOI
6.4%
3.0 15%
4.0%
2.0 2.7% 10%
2.0%
1.0 5%
- -
'19 '20 '21 '22 '23 '24 '25 '26 '27 '28 '29 '30 '31 '32 '33 '34 '35 '36 '37 '38
(*) Based on 2020(12-month period) contractual rental revenue.
Property Use and Brand Diversification
Sales for an individual automotive dealership are heavily influenced by the popularity of the automotive brands being
marketed, and these, in turn, are often cyclical for each brand as new models are introduced and existing models are
updated and refreshed. In addition, prospects for both mass market and luxury brands can vary with economic cycles.
Management believes that the portfolio’s broad automotive brand diversification contributes to the quality and stability
of the REIT’s cash flows. The following table sets out the breakdown of automotive brands that are marketed, retailed
and serviced at the REIT’s properties as of December 31, 2019:
REIT Auto
% of REIT Auto % of REIT Auto No. of REIT Locations
Manufacturer / Brand Dealership GLA
Dealership GLA Dealership Rent
(Sq. Feet)
Honda (1) 313,155 13.6% 14.2% 9
Automotive Properties REIT 2019 12
Automotive Properties REIT 2019 12BMW (2) 301,205 13.1% 11.1% 6
Volkswagen 252,299 11.0% 10.9% 7
Audi(3) 237,484 10.3% 9.1% 6
Toyota 210,360 9.2% 8.9% 5
Acura (1) 139,708 6.1% 6.5% 5
Other (4) 102,176 4.4% 5.9% 8
General Motors 99,851 4.3% 3.3% 2
Nissan (5) 85,411 3.7% 4.2% 3
Porsche (6) 84,569 3.7% 5.8% 2
Chrysler (7) 81,750 3.5% 1.6% 2
Mazda 81,352 3.5% 4.5% 4
Hyundai 80,950 3.5% 3.3% 4
Mercedes Benz 60,850 2.6% 2.7% 1
Infiniti 44,904 2.0% 3.3% 4
Kia 39,543 1.7% 0.9% 2
Ford 39,287 1.7% 1.7% 1
Subaru 19,033 0.8% 0.7% 2
Lexus 16,226 0.7% 0.7% 1
Mitsubishi 14,750 0.6% 0.7% 2
Total 2,304,863 100.0% 100.0% 76
Notes:
(1) Includes Honda Used Car and Regina Collision Centre. Regina Honda/Acura split 75% and 25% of 30,863 sq. ft.
(2) Includes MINI.
(3) Includes the Audi service property (formerly Infiniti Vancouver).
(4) Includes the Dilawri Distinctive Collection property in Calgary, which currently has franchise agreements with Aston Martin and Bentley.
In addition, the Dilawri Distinctive Collection sells a variety of used vehicles, including Audi, BMW, Lamborghini, Maserati, McLaren
and Mercedes-Benz. Also includes the former Dilawri Acura and BMW property in Regina at 1921 1st Avenue which is being used for
ancillary dealership purposes by both the Dilawri Pre Owned and the Triple 7 Chrysler dealerships. It continues to be leased by a
Dilawri Tenant under the same lease as Dilawri BMW. Also includes the former Toyota and Hyundai dealerships which have vacated
their premises located in Dixie Auto Mall; and the applicable Dilawri Tenant will continue to be the lead tenant for Dixie Auto Mall until
July 2030. Includes 3 vehicle compound facilities that were acquired as part of the Mierins Auto Group Portfolio. Also includes the
Tesla KW service centre.
(5) Includes the new Nissan Truck expansion in the former KIA dealership at Dixie Auto Mall.
(6) Includes Porsche JLR Edmonton.
(7) Includes Dodge, FIAT, Jeep and RAM.
Automotive Properties REIT 2019 13
Automotive Properties REIT 2019 13Description of the REIT’s Key Tenant
The following chart summarizes certain relevant financial information of the Dilawri Group for the twelve months ended
December 31, 2019 with comparative figures for the twelve months ended December 31, 2018 as provided to the REIT
by Dilawri (all figures are approximations, not in thousands):
Dilawri Group’s Financial Information (approximations, not in thousands)
December 31, 2019 December 31, 2018
LTM(3) LTM(3)
Combined Revenues (not audited or reviewed) $3.8 billion $3.0 billion
EBITDA (not audited or reviewed) $123.7 million $85.6 million
Pro Forma Adjusted Rent Coverage Ratio (not audited or 3.5(1) 2.9(2)
reviewed)
Term Debt (not audited or reviewed) $440.1 million(1) $140.0 million(2)
Term Debt to EBITDA Ratio (not audited or reviewed) 3.6(1) 1.6(2)
Notes:
(1) As at December 31, 2019.
(2) As at December 31, 2018.
(3) “LTM” means the last twelve months.
Although the REIT has no reason to believe that the above financial information of the Dilawri Group contains a
misrepresentation, Dilawri is a private company that is independent of, and operates entirely independently from, the
REIT and, consequently, neither the REIT, its management nor its Trustees in their capacities as such have been
involved in the preparation of this financial information. Readers are cautioned, therefore, not to place undue reliance
on this financial information.
Dilawri Additional and Non-ASPE Measures
Dilawri uses “EBITDA” in its financial statements which is an additional ASPE (as defined below) measure. “EBITDA” is
defined as the earnings of the Dilawri Group before interest, taxes, depreciation and amortization, all as reflected in the
non-consolidated combined financial statements of the Dilawri Group prepared in accordance with the recognition,
measurement and disclosure principles of ASPE. Dilawri believes that EBITDA is an important measure of operating
performance as it shows Dilawri’s earnings before interest, taxes, depreciation and amortization. Dilawri’s method of
calculating EBITDA may differ from other issuers’ calculations and, accordingly, may not be comparable to measures
used by other issuers.
References to “Pro Forma Adjusted Rent Coverage Ratio”, “Term Debt” and “Term Debt to EBITDA Ratio”, which are
key measures of performance used by automotive dealership businesses, refer to the Pro Forma Adjusted Rent
Coverage Ratio, Term Debt and Term Debt to EBITDA Ratio of the Dilawri Group on a non-consolidated combined
basis. Pro Forma Adjusted Rent Coverage Ratio, Term Debt and Term Debt to EBITDA Ratio are not defined by
Canadian accounting standards for private enterprises (“ASPE”) or IFRS and do not have standardized meanings
prescribed by ASPE or IFRS.
“Pro Forma Adjusted Rent Coverage Ratio” is calculated by Dilawri as EBITDA for the LTM plus rent paid by the Dilawri
Group for the LTM to third parties and the REIT, less rent received from third parties. The resultant figure is divided by
rent paid by the Dilawri Group for the LTM to third parties and the REIT, less rent received from third parties.
“Term Debt” is calculated by Dilawri as the Dilawri Group’s total term debt reflected in its non-consolidated combined
financial statements prepared in accordance with the recognition, measurement and disclosure principles of ASPE.
“Term Debt to EBITDA Ratio” is defined as the ratio of Term Debt to EBITDA.
Automotive Properties REIT 2019 14
Automotive Properties REIT 2019 14You can also read