Formulation, optimization and characterization of allantoin loaded chitosan nanoparticles to alleviate ethanol induced gastric ulcer: in vitro and ...
←
→
Page content transcription
If your browser does not render page correctly, please read the page content below
www.nature.com/scientificreports
OPEN Formulation, optimization
and characterization
of allantoin‑loaded chitosan
nanoparticles to alleviate
ethanol‑induced gastric ulcer:
in‑vitro and in‑vivo studies
Reham Mokhtar Aman1*, Randa A. Zaghloul2 & Marwa S. El‑Dahhan1
Allantoin (ALL) is a phytochemical possessing an impressive array of biological activities. Nonetheless,
developing a nanostructured delivery system targeted to augment the gastric antiulcerogenic
activity of ALL has not been so far investigated. Consequently, in this survey, ALL-loaded chitosan/
sodium tripolyphosphate nanoparticles (ALL-loaded CS/STPP NPs) were prepared by ionotropic
gelation technique and thoroughly characterized. A full 24 factorial design was adopted using four
independently controlled parameters (ICPs). Comprehensive characterization, in vitro evaluations as
well as antiulcerogenic activity study against ethanol-induced gastric ulcer in rats of the optimized
NPs formula were conducted. The optimized NPs formula, (CS (1.5% w/v), STPP (0.3% w/v), CS:STPP
volume ratio (5:1), ALL amount (13 mg)), was the most convenient one with drug content of 6.26 mg,
drug entrapment efficiency % of 48.12%, particle size of 508.3 nm, polydispersity index 0.29 and
ζ-potential of + 35.70 mV. It displayed a sustained in vitro release profile and mucoadhesive strength of
45.55%. ALL-loaded CS/STPP NPs (F-9) provoked remarkable antiulcerogenic activity against ethanol-
induced gastric ulceration in rats, which was accentuated by histopathological, immunohistochemical
(IHC) and biochemical studies. In conclusion, the prepared ALL-loaded CS/STPP NPs could be
presented to the phytomedicine field as an auspicious oral delivery system for gastric ulceration
management.
Nanotechnology-based approaches, involving biologically active phytochemicals, have awarded several innova-
tional delivery systems; including polymeric nanoparticles (PNPs). Oral PNPs are auspicious drug carriers owing
to their nanoscopic dimensions, targetability, bioadhesion, and controlled release of drugs in the gastrointestinal
tract (GIT), therefore imparting improved bioavailability. The adherence ability of these PNPs to the mucosa
and/or their ability to cross the mucosal barrier directly represents an imperative step before the translocation
process of particles. From such standpoint, bioadhesion has a pivotal role to play in delivering the loaded drugs
across the epithelia, averting presystemic metabolism as well as enzymatic degradation in the G IT1,2.
Amongst naturally occurring mucoadhesive cationic polysaccharides, chitosan (CS) has been extensively
studied for PNPs preparation owing to its characteristic features. Low molecular weight (low MW) CS shows
enhanced biocompatibility, biodegradability, solubility and less toxicity compared to high MW CS3,4. Ionotropic
gelation method, an easy and attractive physical cross-linking process, is a cost-effective technique adopted to
prepare chitosan nanoparticles (CS-NPs). This technique depends on ionic interactions arise from electrostatic
attraction between two groups of opposite charge namely; positive amino groups (–NH3+) of CS as well as nega-
tive phosphate groups of sodium tripolyphosphate (STPP). Such combination was asserted to be non-toxic and
hindered the possibility of drug degradation. Moreover, CS-NPs are positively-charged with mucoadhesive as
well as permeation enhancing properties, thus facilitate opening of the epithelial tight junctions2–4.
1
Department of Pharmaceutics, Faculty of Pharmacy, Mansoura University, Mansoura 35516, Egypt. 2Department
of Biochemistry, Faculty of Pharmacy, Mansoura University, Mansoura 35516, Egypt. *email: rehamaman@
yahoo.com
Scientific Reports | (2021) 11:2216 | https://doi.org/10.1038/s41598-021-81183-x 1
Vol.:(0123456789)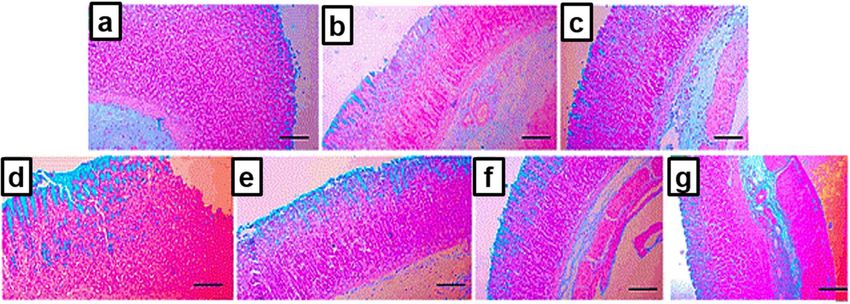
www.nature.com/scientificreports/
Figure 1. Chemical structure of ALL.
Gastric ulcer, being one of the most widespread GI inflammatory diseases, affects approximately 5–10% of
people worldwide. Over the decades, the inception of gastric ulcer is mainly pertained to the disturbance of the
balance between endogenous aggressive factors (overproduction of hydrochloric acid and pepsin, helicobacter
pylori) and endogenous defensive factors (mucin, bicarbonate, antioxidants, prostaglandins (PGs), nitric oxide
and growth factors) in the gastric mucosa. Different drug categories are available as gastric ulcer therapies such as
antacids, anti-cholinergic drugs, proton-pump inhibitors, and histamine H2-receptor antagonists. However, sev-
eral side effects, limited efficacy and elevated incidence of recurrence limited their application and subsequently
motivated the search for new safe and effective anti-ulcer therapies. Since gastric ulceration is a multi-etiological
disorder, identification of biologically active phytochemicals that possess natural anti-ulcer properties such as the
ability to reinforce the defensive endogenous capacity of the gastric mucosa, besides reduction of inflammation
and gastric acid secretion may be beneficial in the amelioration of gastric ulcers2,5.
Allantoin (ALL) (Fig. 1) ((2,5-Dioxo-4-imidazolidinyl) urea) is a biologically active phytochemical extracted
from the roots of Symphytum officinale (comfrey) native to E urope6. It possesses wound healing and tissue
regeneration activities, besides renowned anti-oxidant, anti-inflammatory, pain reducing and gastroprotective
effects that have been proved using a diversity of in vitro assay methods, in vivo animal models as well as clini-
cal studies7–12.
Despite having multilateral pharmacological activities, little trials to fabricate and evaluate ALL in different
delivery systems were stated. An earlier study was performed to improve the antifungal activity of copaiba oil,
via the development of innovative solid lipid nanoparticles besides incorporation of ALL in the formulation,
as well13. ALL loaded porous silica nanoparticles (PSNs) immobilized polycaprolacton (PCL) biocompatible
nanocomposites (PCL/PSNs) were also prepared and characterized for biomedical applications14. Another study
was implemented to investigate the performance of conventional as well as new argan oil enriched liposomes
containing ALL as dermal drug delivery systems15. Recently, ALL was incorporated into CS membranes to
evaluate its wound healing and tissue regeneration properties16. Consequently, different drug delivery systems
(DDSs) are still required to be constructed and evaluated to potentiate and exploit the multilateral pharmaco-
logical bioactivities of ALL.
Although documented lines of substantiation manifesting the gastroprotective activity of ALL against com-
mon agents which attack the gastric mucosa, such as nonsteroidal anti-inflammatory drug (NSAID), stress, and
ethanol, fabricating a nanostructured delivery system targeted at augmenting the gastroprotective activity of
ALL has not been investigated as yet.
Hence, such survey lays the groundwork to dedicate the current study to prepare an oral phyto-pharmaceu-
tical nanoparticulate system loaded with ALL (based on the cross-linking phenomenon between CS and STPP)
to explore its prospective for effective gastric antiulcerogenic activity (AA).
Optimization of ALL-loaded chitosan/sodium tripolyphosphate nanoparticles (ALL-loaded CS/STPP NPs)
was performed by espousing 24 fully crossed design with four independently controlled parameters (ICPs) at two
levels. The concentration of both CS ( X1) and STPP ( X2), CS:STPP volume ratio ( X3) and amount of ALL ( X4)
were the different ICPs. The dependently measured parameters (DMPs) were drug content (Q), drug entrapment
efficiency % (DEE %), particle size and ζ-potential (ZP) of ALL-loaded CS/STPP NPs. The optimized ALL-loaded
CS/STPP NPs formula would be extensively investigated and further characterized with regard to its in vitro
release, physical stability, and finally in vivo gastric AA in rats.
Materials and methods
Materials. ALL, STPP, omeprazole (ome) and mucin from porcine stomach were procured from Sigma-
Aldrich (Saint Louis, MO, USA). Low MW CS was kindely provided by Primex (ChitoClear HQG 10, Code No.:
43000, Batch No.: TM4870, deacetylation degree 95%, Siglufjörður, Iceland). Analytical grade of absolute etha-
nol, glacial acetic acid (99%), sodium hydroxide (NaOH), and sodium carboxymethylcellulose (sodium CMC)
were purchased from El-Nasr Pharmaceutical Chemical Co., Cairo, Egypt. The enzyme-linked immunosorbent
assay (ELISA) kit of Interleukin-6 (IL-6) was purchased from Promokine Co., Heidelberg, Germany. Nitric oxide
(NO) and oxidative stress markers assay kits were procured from Biodiagnostic co., Dokki, Giza, Egypt. Nuclear
factor erythroid 2-related factor-2 (Nrf-2) and tumor necrosis factor-α (TNF-α) antibodies were purchased from
Novus Biologicals, Centennial, CO 80112, USA.
Scientific Reports | (2021) 11:2216 | https://doi.org/10.1038/s41598-021-81183-x 2
Vol:.(1234567890)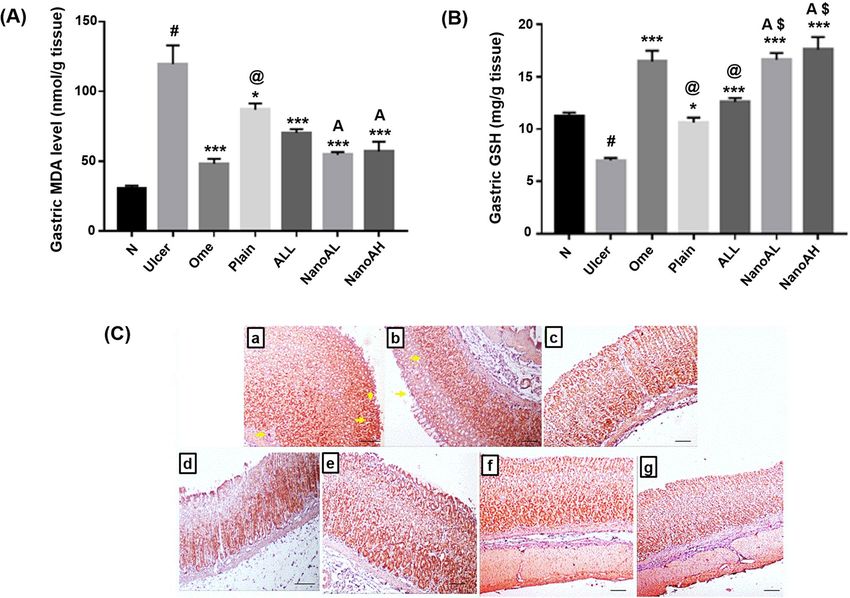
www.nature.com/scientificreports/
ICPs Maximum coded level Minimum coded level Maximum level Minimum level
(X1) CS concentration (%, w/v) +1 −1 1.5 1
(X2) STPP concentration (%, w/v) +1 −1 0.5 0.3
(X3) CS:STPP volume ratio +1 −1 5:1 3:1
(X4) ALL amount (mg) +1 −1 13 10
Table 1. ICPs and levels of a 24 full factorial design.
Coded levels of
Formula code X1 X2 X3 X4 Q (mg) DEE % PDI Particle size (nm) ZP (mV)
F-1 − + + − 4.91 ± 0.04 49.08 ± 0.39 0.178 ± 0.04 610.97 ± 17.01 22.97 ± 0.98
F-2 − + − − 3.51 ± 0.05 35.14 ± 0.54 0.264 ± 0.01 665.27 ± 18.85 24.83 ± 0.60
F-3 + + + − 2.91 ± 0.25 29.11 ± 2.53 0.116 ± 0.04 676.13 ± 15.21 34.53 ± 2.31
F-4 + + − − 3.16 ± 0.04 31.58 ± 0.41 0.171 ± 0.04 747.53 ± 33.22 29.90 ± 0.62
F-5 + − + − 5.35 ± 0.18 53.51 ± 1.77 0.212 ± 0.05 681.03 ± 20.57 29.63 ± 1.06
F-6 + − − − 4.51 ± 0.26 45.12 ± 2.58 0.282 ± 0.04 735.70 ± 2.25 29.33 ± 1.15
F-7 − − + − 3.60 ± 0.09 36.02 ± 0.93 0.230 ± 0.04 465.07 ± 20.51 28.40 ± 1.44
F-8 − − − − 4.69 ± 0.18 46.85 ± 1.85 0.251 ± 0.06 507.90 ± 13.25 28.33 ± 0.21
F-9 + − + + 6.26 ± 0.03 48.12 ± 0.21 0.290 ± 0.02 508.30 ± 13.35 35.70 ± 0.82
F-10 + − − + 5.12 ± 0.07 39.40 ± 0.58 0.346 ± 0.01 512.73 ± 40.75 29.47 ± 0.64
F-11 − − + + 3.03 ± 0.29 23.34 ± 2.27 0.320 ± 0.06 479.07 ± 7.53 28.57 ± 0.42
F-12 − − − + 4.20 ± 0.13 32.34 ± 1.01 0.389 ± 0.08 493.50 ± 15.81 27.47 ± 0.57
F-13 − + − + 1.87 ± 0.07 14.42 ± 0.55 0.478 ± 0.04 604.37 ± 13.24 28.33 ± 0.91
F-14 + + − + 4.30 ± 0.42 32.93 ± 2.99 0.281 ± 0.05 791.67 ± 27.37 34.27 ± 0.93
F-15 − + + + 3.81 ± 0.24 29.33 ± 1.86 0.413 ± 0.09 478.13 ± 15.76 28.27 ± 0.75
F-16 + + + + 5.22 ± 0.08 40.18 ± 0.61 0.235 ± 0.03 711.43 ± 16.83 35.80 ± 0.92
Table 2. Formulations and properties of ALL-loaded CS/STPP NPs prepared according to 2 4 full factorial
design. Each value represents the mean ± SD (n = 3). X1, X2, X3, X4 are CS concentration, STPP concentration,
CS:STPP volume ratio and ALL amount, respectively.
Design of experiment (DoE). DoE was challenged as an organized and structured technique for opti-
mizing the ionotropic gelation method. It provides very accurate as well as precise analysis for the interactions
between the input factors affecting the output responses, through the establishment of mathematical m odels17.
Fully crossed design (24), as an experimental approach, allows the investigation of the individual effects and
interactions of ICPs namely; CS concentration (X1), STPP concentration (X2), CS:STPP volume ratio (X3) and
ALL amount ( X4) on different DMPs such as Q, DEE %, particle size and ZP of ALL-loaded CS/STPP NPs. Two
levels for each of the four ICPs were experimented and symbolized by the coded factor levels as + 1 (high levels)
and − 1 (low levels) as presented in Table 1. Such levels were chosen based on preliminary studies and the optimi-
zation procedure was established within these domains. Three replicates were conducted for each combination,
total number of sixteen formulations, to prepare ALL-loaded CS/STPP NPs (Table 2).
The complete polynomial regression equation was created as follows "Eq. (1)":
Y = β0 + β1 X1 + β2 X2 + β3 X3 + β4 X4 + β5 X1 X2
+ β6 X1 X3 + β7 X1 X4 + β8 X2 X3 + β9 X2 X4 + β10 X3 X4 (1)
+ β11 X1 X2 X3 + β12 X1 X2 X4 + β13 X1 X3 X4 + β14 X2 X3 X4 + β15 X1 X2 X3 X4
where Y: DMP, βo: the arithmetical mean response of the 16 runs, β1, β2, β3, and β4: linear coefficients, β5, β6, β7,
β8, β9 and β10: interaction coefficients between the two ICPs, β11, β12, β13, and β14: interaction coefficients between
the three ICPs, Β15: interaction coefficient between the four ICPs, X 1, X2, X3 and X4: ICPs.
Preparation of ALL‑loaded CS/STPP NPs. The ionotropic gelation method was followed in the prepa-
ration of ALL-loaded CS/STPP NPs, as previously described, which relies on the basis of an ionic interaction
between the primary amino group of CS solution (positively-charged) and the phosphate group of STPP solution
(negatively-charged)18. In brief, low MW CS (1 or 1.5% (w/v)) was dissolved in (1% v/v) aqueous acetic acid solu-
tion and magnetically stirred using magnetic stirrers (MS300HS, MTOPS Corp., Korea) until complete dissolu-
tion. CS’s solution pH was elevated to 6 using 1 N NaOH, where such pH value maintains CS in its soluble form
at the inspected concentrations19. Next, STPP aqueous solution was prepared at two different concentrations (0.3
or 0.5% (w/v)). Both CS as well as STPP solutions were filtered through a 0.45 μm pore size filter (EMD Milli-
Scientific Reports | (2021) 11:2216 | https://doi.org/10.1038/s41598-021-81183-x 3
Vol.:(0123456789)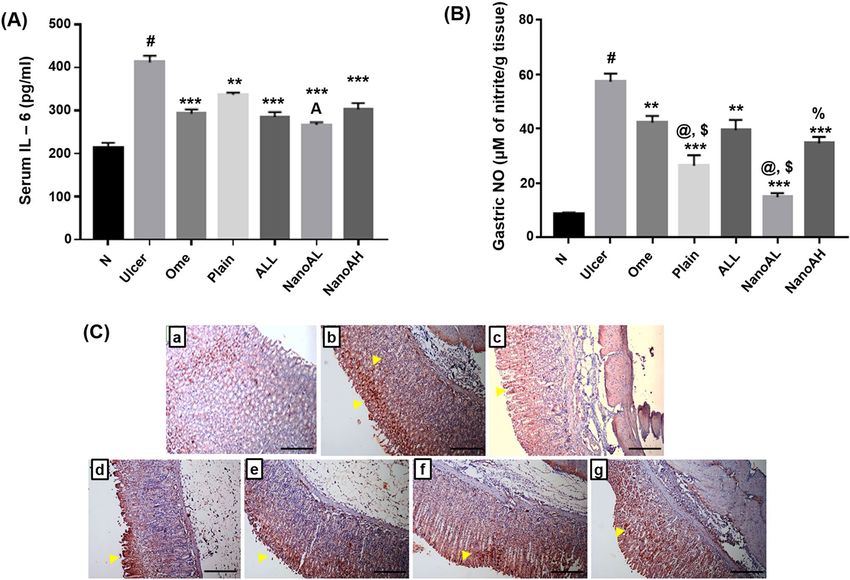
www.nature.com/scientificreports/
pore, Billerica, MA, USA). The ALL-loaded CS/STPP NPs were formed spontaneously by the dropwise addition
of STPP solution (containing an accurately weighed and completely dissolved quantity of ALL (10 or 13 mg))
onto CS solution at two different volume ratios (3:1 or 5:1) of CS and STPP, respectively. The dropping rate, using
a disposable insulin needle, was 0.14 mL/min under constant magnetic stirring (1200 rpm) at room temperature.
Further cross-linking reaction was allowed to proceed with continous stirring for 30 min. Then, the ALL-loaded
CS/STPP NPs were separated from the unentrapped ALL by centrifugation at 13,000 rpm under cooling condi-
tions at 4 °C for 4 h (CE16-4X100RD, ACCULAB, USA), washed with deionized water (DW), resuspended in
DW, and then freeze-dried (SIM FD8-8T, SIM international, USA). Finally, the freeze-dried ALL-loaded CS/
STPP NPs were kept at 4 °C for additional characterization. The clear supernatant containing unentrapped ALL
was kept for estimation of efficiency of drug entrapment as percentage (DEE %). For preparation of plain CS/
STPP NPs corresponding to each formula, the same procedure was followed using STPP solutions without ALL.
Characterization of ALL‑loaded CS/STPP NPs. All the NPs of the 16 formulae were subjected to
appraisal of DMPs in terms of Q, DEE %, particle size, polydispersity index (PDI) and ZP.
Estimation of drug content. Actual drug content (Q) was assessed by quantifying the amount of unentrapped
ALL in the clear supernatant of all medicated formulae after centrifugation at 13,000 rpm for 4 h at 4 °C. The
content of the unentrapped ALL was measured spectrophotometrically, against the supernatant of each corre-
sponding plain CS/STPP NPs as a blank, at λmax 215 nm (ultraviolet/visible (UV–VIS) double beam spectropho-
tometer, Labomed Inc., USA).
The Q of ALL was indirectly determined by subtracting the amount of free ALL in the supernatant from the
total amount of drug added initially according to Eq. (2):
Q = Wt − Wf (2)
where, Wt symbolizes the total amount of ALL available in the formulation and Wf symbolizes the amount of
free ALL in the supernatant.
Determination of drug entrapment efficiency percent. Efficiency of drug entrapment as percentage (DEE %) was
estimated for each formula according to the following Eq. (3):
Actual drug content (Q)
DEE % = × 100 (3)
Total drug content
Particle size measurements. The average hydrodynamic size as well as PDI of all the freshly prepared ALL-
loaded CS/STPP NPs, after appropriate dilution with DW, were determined in triplicates by Zetasizer Nano ZS
(Malvern Instruments, Malvern, UK) adopting the dynamic light scattering (DLS) mechanism.
ζ‑potential (ZP). ZP is an imperative factor to assess the colloidal dispersion stability. ZP measurement was
carried out in DW utilizing Zetasizer Nano ZS (Malvern Instruments, Malvern, UK) adopting the laser Doppler
micro-electrophoresis technique which observes the electrophoretic mobility of the NPs in an electrical field. All
measurements were carried out in triplicates.
Selection of the optimized formulation on the basis of desirability function. Using the desir-
ability approach, numerical optimization was employed to locate the optimal levels of the ICPs to obtain the
desired DMPs. Optimization was performed to obtain the levels of X1–X4 which keep particle size within the
range of the obtained response, while maximize Q, DEE % and ZP. Optimized formulation (F-9) was selected on
the predetermined basis, as well as with good desirability20.
Evaluation of formula 9 (F‑9) of ALL‑loaded CS/STPP NPs. Morphology. The morphology of the
optimized formula (F-9), freshly prepared, was visualized using transmission electron microscopy (TEM) (JEOL
JEM-2100, JEOL Ltd., Tokyo, Japan). One mL of the NPs dispersion was suitably diluted with DW, sonicated for
5 min, cast onto carbon coated copper grid, the excess sample was wiped away using a filter paper, and finally the
grid was air-dried at room temperature. Then, it was directly inspected via TEM without staining at 160 kV. The
image was captured and the analysis process was carried out using imaging viewer software (Gatan Microscopy
Suite Software, version 2.11.1404.0).
Fourier‑transform infrared spectroscopy (FT‑IR). The infrared spectra of ALL, CS, STPP, and the corresponding
physical mixture of the optimized formula besides lyophilized plain and medicated CS/STPP NPs (F-9), were
traced using FT-IR Spectrophotometer (Madison Instruments, Middleton, WI, USA). Samples were homoge-
neously mixed with potassium bromide (KBr), compressed into discs and individually scanned over a wave
number range of 500–4000 cm−1.
Thermal properties. Thermodynamic techniques were applied to reveal the heat stresses of pharmaceutical
preparations, additives, besides their interactions during the process of formularization. Thermograms of ALL,
CS, STPP, and the corresponding physical mixture of the optimized NPs formula as well as lyophilized plain
and medicated CS/STPP NPs (F-9), were determined via differential scanning calorimetry (DSC) (DSC-60,
Scientific Reports | (2021) 11:2216 | https://doi.org/10.1038/s41598-021-81183-x 4
Vol:.(1234567890)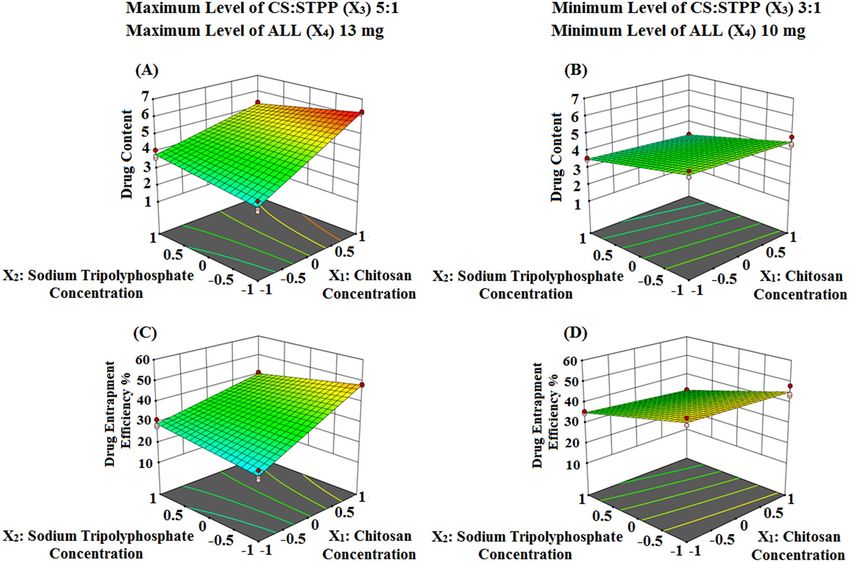
www.nature.com/scientificreports/
Shimadzu Corporation, Japan) equipped with a Shimadzu TA-60 Series data processor which allow automatic
display of data curves. Four milligrams (per each sample) were separately get heated, 10 °C/min as a heating rate,
in hermetically sealed aluminum pans over a temperature range of 30–400 °C under a constant purging of dry
nitrogen at 20 mL/min. Indium (purity of 99.99% and melting point of 156.6 °C), as a reference standard, was
used to calibrate DSC runs.
Powder x‑ray diffraction (PXRD). Powder x-ray diffraction (PXRD) technique is a remarkable one in inspect-
ing the changes in the compounds’ crystallinity throughout the formulation process. PXRD patterns of ALL, CS,
STPP, and the corresponding physical mixture of the optimized NPs formula as well as lyophilized plain and
medicated CS/STPP NPs (F-9), were recorded at a scanning range from 3° to 50° at 2θ angle employing a Diano
X-ray diffractometer (USA) equipped with Co-Kα radiation. To perform such analysis process, the used current
and voltage were 9 mA and 45 kV, respectively.
In vitro ALL release study from ALL‑loaded CS/STPP NPs (F‑9). The in vitro release profile of ALL from the
freshly prepared medicated NPs (F-9), in comparison to its diffusion from aqueous solution, as a control as pre-
viously reported, was adopted using locally fabricated vertical Franz diffusion cells with diffusional surface area
of 7.07 cm2,17. Semipermeable SpectraPor dialysis membranes (Molecular weights cut off: 12,000–14,000 Da,
Spectrum Medical Industries Inc., Los Angeles 90054, USA), that were equilibrated overnight either with 0.1 M
HCl (pH 1.2), phosphate buffer (pH 6.8) or phosphate buffer (pH 7.4) as simulated gastrointestinal fluids before
mounting in the diffusion cell, were tightly fixed between the donor and receptor compartments.
Briefly, ALL-loaded CS/STPP NPs (F-9), containing an equivalent amount of 12 mg ALL, were suspended in
distilled water and placed in the donor compartment, while 50 mL of the dialysis medium was introduced to the
receptor one. Throughout the whole experiment, the entire congregation of the used Franz diffusion cells was
shaken by thermostatically controlled shaking incubator (GFL Gesellschaft für Labortechnik, Burgwedel, Ger-
many) at 100 rpm/min and maintained at 37 ± 0.5 °C. At preplanned time intervals, 0.5, 1, 1.5, 2, 3, 4, 6, 8, 24, 32,
48 and 56 h, withdrawal of aliquots (3 mL) from the receptor medium was carried out followed by resubstitution
with an equivalent volume of fresh medium, equilibrated at 37 ± 0.5 °C, in order to conserve a constant volume
during the experiment. The assembled aliquots were filtered through 0.45 μm membrane filters and quantified
spectrophotometrically for drug concentration using UV–VIS spectrophotometer, against the corresponding
plain CS/STPP NPs that were treated similarly as the medicated.
Finally, the cumulative ALL released (%) was calculated at each time interval as an average value from three
experiments. Contemporary, aqueous solution containing the same amount of ALL was also experimented for
the process of diffusion similarly in triplicate.
Release kinetic. To attain a profound knowledge about the mechanism of drug release from the NPs, the in vitro
release data of the selected ALL-loaded CS/STPP NPs (F-9) were fitted to different kinetic models including
zero-order, first-order as well as diffusion-controlled release21.
To verify the release mechanism, Korsmeyer–Peppas kinetic model was also applied as a logarithmic relation
of the drug released fraction ( Mt/M∞) and the release time (t) "Eq. (4)":
(Mt /M∞ = ktn ) (4)
where n is the characteristic diffusional exponent for the release mechanism calculated as the slope of the plot
and k is the kinetic constant22. Moreover, the release data were fitted to the following Weibull kinetic model which
is generally applied to systems prepared with swellable materials such as CS "Eq. (5)":
(ln[− ln(1 − F)] = β ln td + β ln t) (5)
where F and td stand for the fraction of amount drug released up to time t and the lag time before the drug
release takes place, respectively, while β characterizes the shape of the release c urve23. The model which gives a
coefficient of determination ( R2) close to 1 would be considered as the order of release.
Mucoadhesive strength. The mucoadhesive properties of ALL-loaded CS/STPP NPs (F-9) were investigated
through incubation of these NPs with porcine mucin. Two in vitro methods were used in such study.
Determination of mucin‑binding efficiency (%). This method was based on assessing the NPs adher-
ence to the mucosa by studying the interaction between the negatively-charged mucin (as the mucosal compo-
nent) and the positively-charged CS/STPP NPs in aqueous solution2,24–26. Briefly, 5 mL of both reconstituted
NPs (F-9 aqueous dispersion) and mucin (0.5 mg/mL in phosphate buffer saline (PBS) pH 7.4) were vortexed
(Model VM-300, Gemmy Industrial Corp., Taiwan), incubated at 37 °C for 1 h and subsequently centrifuged
at 10,000 rpm for 1 h. The amount of free mucin in the supernatant was determined at 253 nm by UV–VIS
spectrophotometer. This experiment was carried out in triplicate and the average mucin-binding efficiency (%),
expressing the mucoadhesive strength of the CS/STPP NPs, was estimated according to the following Eq. (6):
Total amount of mucin − free amount of mucin
Mucin-binding efficiency (%) = × 100 (6)
Total amount of mucin
Scientific Reports | (2021) 11:2216 | https://doi.org/10.1038/s41598-021-81183-x 5
Vol.:(0123456789)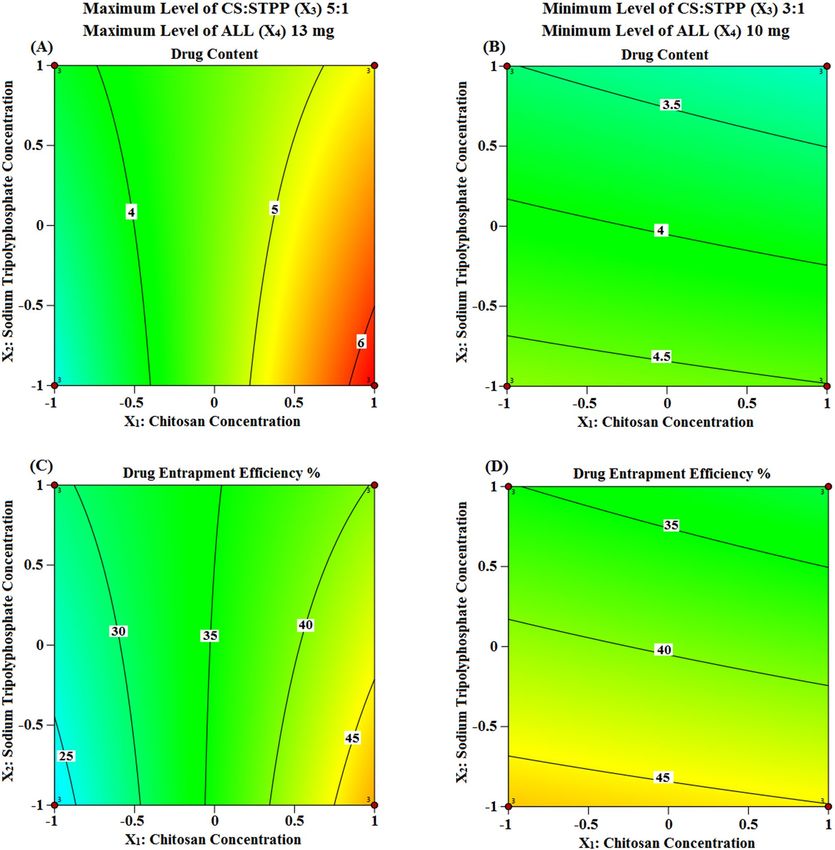
www.nature.com/scientificreports/
Determination of ZP of CS/STPP‑mucin mixtures. Such method was employed to evaluate the influ-
ence of mucin on the ZP of CS/STPP NPs. ZP of ALL-loaded CS/STPP NPs (F-9 aqueous dispersion) after incu-
bation with mucin, as previously described, was determined. Moreover, equal volumes of mucin and CS (5 mL
each) were vortexed, incubated at 37 °C for 1 h and subsequently the ZP of such mixture was measured. Besides,
ZP of both mucin and CS solutions were evaluated as well27–29.
Short‑term physical stability of ALL‑loaded CS/STPP NPs (F‑9). The influence of storage conditions (namely;
temperature) on the physical stability of the optimized ALL-loaded CS/STPP NPs (F-9) was assessed. The freshly
prepared ALL-loaded CS/STPP NPs dispersions (F-9) were filled in screw capped glass bottles and stored at
refrigeration (4 ± 1 °C) and ambient conditions for 3 months without any stirring or agitation30. The NPs were
assessed regarding particle size, PDI, ZP and average drug retention (%) at zero time (at production day as
described above previously), and after 1 and 3 months of storage.
In vivo assessment studies. Animals. Animal protocol was revised and approved by the ethical committee
of Faculty of Pharmacy, Mansoura University, Mansoura, Egypt, in accordance with “principles of laboratory
animal care NIH publication revised 1985” (Code number: 2020–107). Moreover, the study was conducted and
presented with careful consideration of the Animal Research: Reporting of In Vivo Experiments (ARRIVE)
guidelines. Forty-two healthy male Sprague–Dawley rats, weighing between 180 and 200 g, were housed under
standard conditions of temperature (25 °C ± 1) with a regular 12 h light/dark cycle and free access to standard
animal chew.
Evaluation of AA against ethanol‑induced gastric ulcer in rats. Rats were kept for a week for accli-
matization before being randomly divided into seven equal groups (n = 6). The groups received the followings
for five consecutive days via intragastric tube;
• Group a: Normal control (N); rats received only water.
• Group b: Ulcer; rats received only water.
• Group c: Ome (rats received 20 mg/kg of ome suspended in sodium CMC (1% w/v)).
• Group d: Plain; rats received the nanocarrier (plain CS/STPP NPs, F-9).
• Group e: Pure drug (ALL); rats received 60 mg/kg of ALL aqueous solution (ALL-sol).
• Group f: Nano ALL low dose (NanoAL); rats received ALL-loaded CS/STPP NPs (F-9, 30 mg/kg).
• Group g: Nano ALL high dose (NanoAH); rats received ALL-loaded CS/STPP NPs (F-9, 60 mg/kg).
On the fifth day, 24 h-fasted rats received their last dose of treatment, and then an hour later all the groups,
except for N group, were given a single dose of (5 mL/kg) of absolute ethanol via intragastric tube31. Plain and
medicated CS/STPP NPs were prepared as previously mentioned. In the present study, ome and pure ALL were
applied for comparison. Their doses were selected based on previous s tudies32,33.
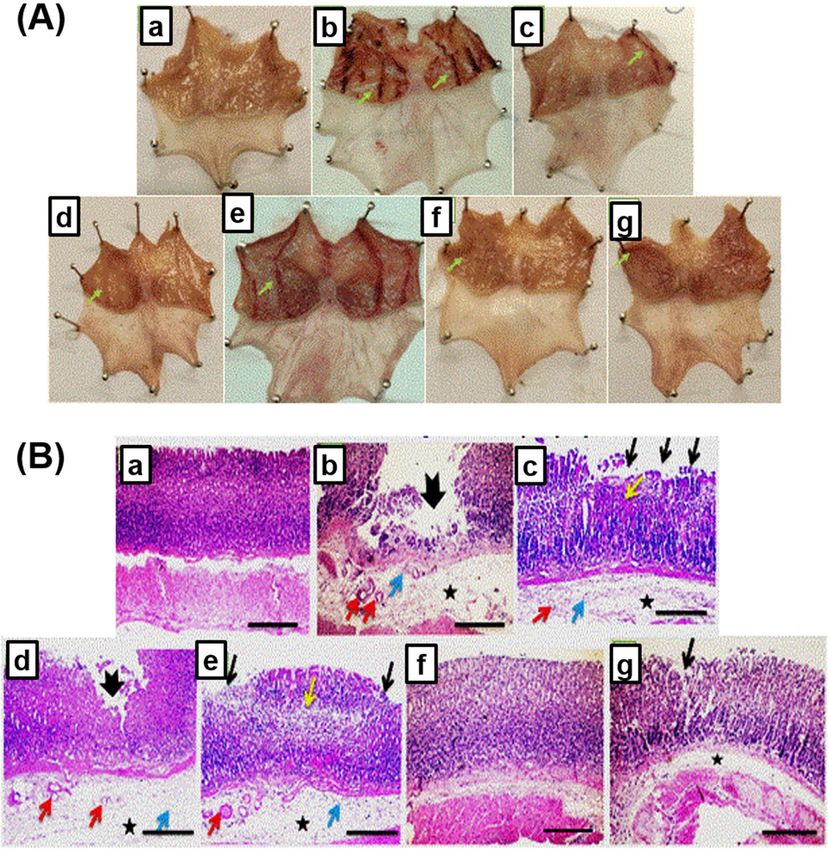
Biological samples collection and macroscopic examination of gastric ulceration. An hour
later to ethanol administration, blood samples were collected from the retro-orbital venous plexus in plain col-
lection tubes. Sera were obtained by the subsequent centrifugation of the samples at 3000 rpm at 4 °C for 5 min
(Sigma 2-16P centrifuge, Sigma Co., USA) and stored at − 20 °C for serum IL-6 assessment. Rats were sacrificed
and undergone immediate laparotomy. Stomachs were separated and opened along the greater curvature. Gas-
tric contents were collected in clean glass tubes for measurement of pH through digital pH meter (Consort NV
P-901 pH-meter, Belgium, Europe). Stomachs were washed with cold normal saline, blotted dry and pinned to
be photographed for assessment of the area of the gastric damage (mm2) with Image J software (1.52a, NIH,
USA).
The ulcer index (UI) as well as the protection index (PI) were evaluated according to Eqs. (7 and 8),
respectively34,35:
Total area of lesions
UI = × 100 (7)
Total area of stomach
UI of ulcer group − UI of treated group
PI = × 100 (8)
UI of ulcer group
After the completion of the macroscopic examination, the glandular part of the stomach was then dissected
into two portions. The first portion was preserved in 10% buffered formalin and embedded in paraffin wax for
further histopathological and immunohistochemical (IHC) investigations. The second cut of the tissue was used
to prepare 10% homogenate by the homogenization of the tissue in an ice-cold phosphate-buffered saline followed
by a storage of the homogenate aliquots at − 80 °C for subsequent biochemical evaluations.
Histopathological examination and IHC localization of Nrf‑2 and TNF‑α. Paraffin blocks of the
formalin-preserved glandular part of the stomach were cut as 5 μm-thick sections. One set of sections was
picked up on slides, deparaffinized, and stained with hematoxylin and eosin (H&E) as well as the special stain
Alcian blue. Another set of sections, along their appropriate positive control sections, were processed for IHC
staining using monoclonal antibodies for Nrf-2 and TNF-α. The procedure was as described in our previous
Scientific Reports | (2021) 11:2216 | https://doi.org/10.1038/s41598-021-81183-x 6
Vol:.(1234567890)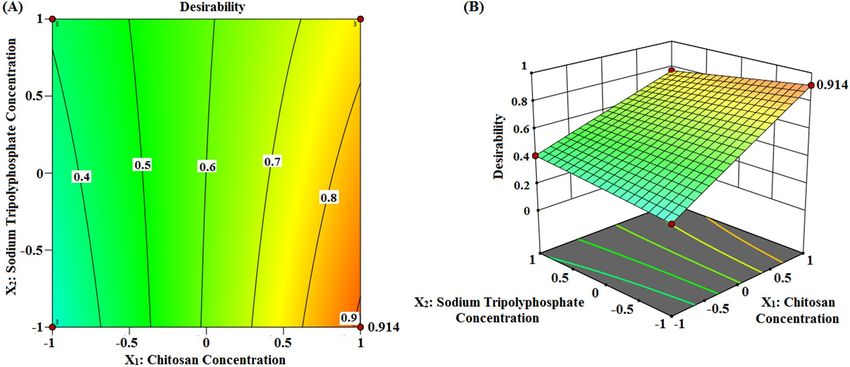
www.nature.com/scientificreports/
study36. Slides were photographed using a digital camera-aided computer system (Nikon digital camera, Tokyo,
Japan). Both examinations were performed by two qualified pathologists unaware of the specimens identity,
in order to prevent any bias. The intensity of the staining was scored as follows: (−), negative; (+), weak; (++),
moderate; and (+++), strong s taining37. Both the oxidative stress markers, Gastric MDA and GSH, and the pro-
inflammatory markers, gastric NO and serum IL-6, were assessed via the appropriate commercially available
colorimetric and ELISA kits, according to the manufacturer’s instructions.
Statistical data analysis. The in vitro besides in vivo data were expressed as mean ± standard deviation (SD)
and mean ± standard error of the mean (SEM), respectively. The data were analyzed statistically using one-way
analysis of variance (ANOVA) followed by Tukey–Kramer multiple comparisons test, for in vitro data, as well as
ANOVA followed by Tukey’s post-hoc test or Student’s t-test (unpaired t-test), for in vivo ones. In order to final-
ize such analysis process, GraphPad Prism version 5.00 (GraphPad Software, Inc., La Jolla, CA, USA) was used.
The applied experimental approach (24 fully crossed design) was estimated in terms of statistical significance
utilizing ANOVA by Design-Expert version 12 (Stat-Ease, Inc., Minneapolis, Min-nesota, USA). Statistically
significant F-values (p < 0.05) and adjusted coefficients of determination (adjusted R2) ranged from 0.8 to 1.0
were the standards for evaluation of the selected model, as previously reported17,38. Besides, the effect of ICPs on
the DMPs was presented as contour plots as well as response surface plots created by setting the X 3 and X 4 factors
at their low and high levels and changing X1 and X
2 over the range used in the study.
Results and discussion
Preparation, characterization and optimization of ALL‑loaded CS/STPP NPs. In the present
study, ALL-loaded CS/STPP NPs were successfully prepared by ionotropic gelation method. The applicability
of CS-based NPs particularly for mucosal routes of administration (oral, nasal, pulmonary or vaginal) has been
reported39. Low MW CS with highest degree of deacetylation was selected to favor preparation of electropositive
smaller sized CS/STPP NPs; as previously demonstrated19. Hence, to the best of our knowledge, this is the first
attempt for encapsulation of ALL in CS/STPP NPs.
Moreover, for ameliorating the drug absorption and consequently its therapeutic performance, vital DMPs
including small particle size and PDI (within the range of the obtained responses) as well as maximum Q, DEE
% and ZP have to be taken into account. Fully crossed design offered very accurate and precise analysis, revealed
the ICPs interactions and extensively used in several processes17.
Drug content (Q) and drug entrapment efficiency % (DEE %). These two DMPs were picked out
as indicators of the reproducibility and efficiency of the proceeding technique (Table 2). Q and DEE % of ALL-
loaded CS/STPP NPs ranged from 1.87 ± 0.07 to 6.26 ± 0.03 mg and 14.42 ± 0.55 to 53.51 ± 1.77%, respectively.
The linear regression models for these two DMPs are represented as follows "Eqs. (9 and 10)":
Q = +4.15 + 04499X1 − 04415X2 + 0.2330X3 + 0.0742X4
− 0.2643X1 X2 + 0.0981X1 X3 + 0.5472X1 X4 + 0.2680X2 X3
(9)
+ 0.0159X2 X4 + 0.1202X3 X4 − 0.4300X1 X2 X3 + 0.2267X1 X2 X4
+ 0.0629X1 X3 X4 + 0.0943X2 X3 X4 + 0.0152X1 X2 X3 X4
where F = 105.45, and p < 0.0001
DEE % = +36.66 + 3.339X1 − 3.933X2 + 1.932X3 − 4.146X4
− 2.609X1 X2 + 0.8044X1 X3 + 4.312X1 X4 + 2.272X2 X3
(10)
+ 0.6410X2 X4 + 0.8037X3 X4 − 3.812X1 X2 X3 + 2.301X1 X2 X4
+ 0.4523X1 X3 X4 + 0.5339X2 X3 X4 + 0.6403X1 X2 X3 X4
where F = 126.27, and p < 0.0001.
The quantitative effects of ICPs namely; CS concentration ( X1), STPP concentration ( X2), CS:STPP volume
ratio (X3) as well as ALL amount ( X4), and their interactions on the above DMPs are elucidated via the afore-
mentioned equations. Circumspect examination of these two equations asserts that both ICPs namely; CS ( X1)
and CS:STPP ( X3) have a favourable effect, while STPP ( X2) has a reverse effect, on DMPs such as Q and DEE
%. Interestingly, CS (X1) was the major factor affecting positively the above two responses. Presumably; STPP
(X2), being the cross-linking agent, leads to water “expulsion” and promotes the “escape” of some of the dissolved
drug molecules40. Both CS (X1) with its viscosity and CS:STPP (X3) with increased volume ratio synergistically
antagonize this "escape” with a positive coefficient value of X1X3.
Table 2 depicts that an increment in CS ( X1) from 1 to 1.5% w/v and keeping X 2, X3 and X4 constant (F-5 and
7, F-9 and 11, besides F-13 and 14) increased Q and DEE % values, while an increase in STPP ( X2) from 0.3 to
0.5% w/v and keeping X 1, X3 and X4 constant (F-3 and 5, as well as F-12 and 13) decreased Q and DEE % values.
Nevertheless, to allow for much easier interpretation of ICPs influence on DMPs, various graphical plots were
generated based on the model equations for Q and DEE %. Figures 2A–D and 3A–D show the response surface
and contour plots, respectively, of variations in the aforementioned DMPs against two ICPs, X 1 (CS) and X
2
(STPP) at a time, keeping the other ICPs, X3 and X4 (CS:STPP and ALL), fixed at their high and low levels. The
contour plots illustrate that the two DMPs exhibit highest Q (6.26 ± 0.03 mg) and high DEE % (48.12 ± 0.21%)
values at high level of CS ( X1) and low level of STPP ( X2) when CS:STPP ( X3) and ALL ( X4) were at their high
levels. This implies that the use of high levels of CS (X1), CS:STPP (X3), ALL (X4) and low level of STPP (X2),
over the range used in the study, is required to prepare NPs with high Q and DEE % (F-9).
Scientific Reports | (2021) 11:2216 | https://doi.org/10.1038/s41598-021-81183-x 7
Vol.:(0123456789)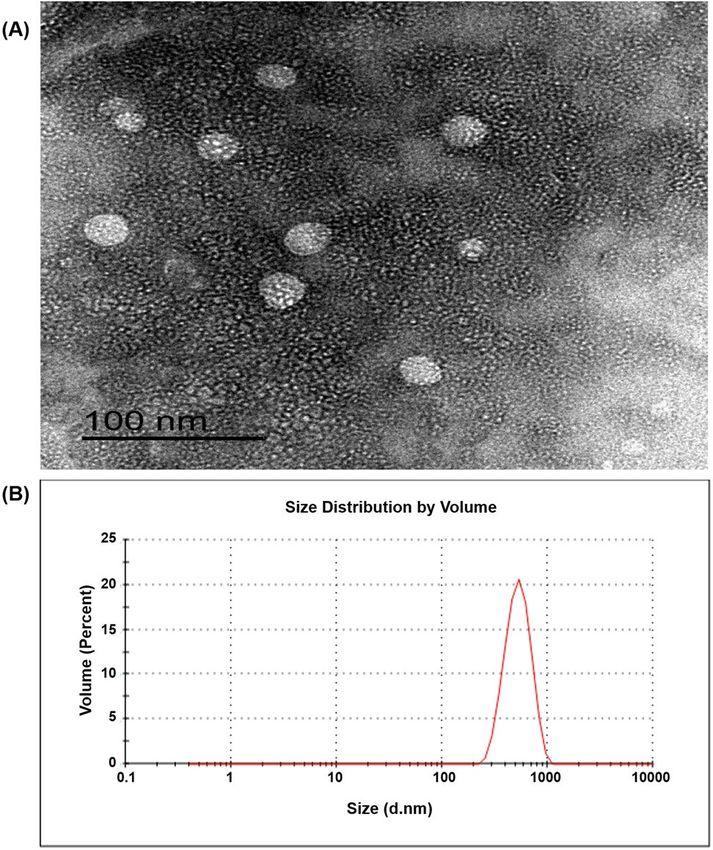
www.nature.com/scientificreports/
Figure 2. Three dimensional surface plots representing the effect of the interaction between the concentrations
of both CS (X1) and STPP (X2) on Q and DEE % (A and B) and (C and D) at the maximum and minimum levels
of both CS:STPP volume ratio ( X3) and ALL amount (X4), respectively, using Design-Expert version 12 (/https://
www.statease.com/software/design-expert).
The prospective explication is that high concentration of CS (X1), with increased viscosity, minimizes the
amount of drug departure from the NPs matrix, and consequently increases DEE % value. Additionally, high
polymer concentration increases the formed CS/STPP NPs with subsequent increase in the amount of entrapped
ALL. These results were in accordance with reported s tudies41–43.
Particle size and the polydispersity index (PDI). One of the foremost determiners in epithelial and
mucosal tissue uptake of NPs, along with their intracellular bargaining, hence having an impact on the thera-
peutic efficacy is the particle size. Polymeric NPs ranged from 50 to 500 nm were reported to have maximal
uptake and interaction with mucosal epithelial membranes3. Not merely the average particle size (nm) of NPs is
prime, but also their size variability. PDI, also known as the heterogeneity index, is a dimensionless and scaled
index derived from the cumulants analysis which describes the relative discrepancy of the size distribution of
particles. PDI, based on its value ranging from 0 to 1, has an influence on the therapeutic performance and the
pharmacokinetic parameters of the medicated NPs formulations. Both of which are two substantial indicias for
estimating size stability of a colloidal dosage form upon storage2,17.
Particle size and PDI of the prepared ALL-loaded CS/STPP NPs are displayed in Table 2. All formulae exhib-
ited a PDI values ranged from 0.116 ± 0.04 to 0.478 ± 0.04. The small values of PDI (< 0.5) depict narrow-average
distribution and are referred to as a homogenic dispersion. Additionally, they are necessary to keep the stability
of the colloidal dosage form without precipitates or microparticles f ormation44.
The linear regression model for particle size is symbolized as follows "Eq. (11)":
P size = + 604.3 + 66.27X1 + 56.39X2 − 28.03X3
− 31.90X4 + 4.737X1 X2 + 1.692X1 X3 − 7.633X1 X4
(11)
− 13.49X2 X3 + 17.61X2 X4 − 0.1333X3 X4 + 1.921X1 X2 X3
+ 41.78X1 X2 X4 + 5.308X1 X3 X4 − 9.962X2 X3 X4 + 2.579X1 X2 X3 X4
where F = 91.72, and p < 0.0001.
Such equation depicts that particle size is substantially impacted by all ICPs and their interactions. The most
conspicuous effect on particle size enlargement was attributed to the concentration of both CS (X1) and STPP
Scientific Reports | (2021) 11:2216 | https://doi.org/10.1038/s41598-021-81183-x 8
Vol:.(1234567890)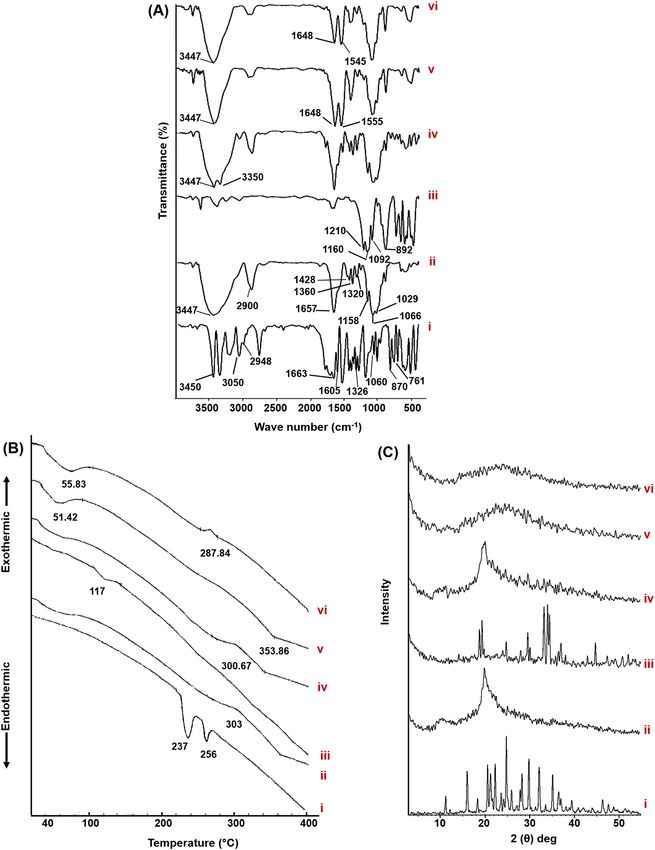
www.nature.com/scientificreports/
Figure 3. Contour plots representing the effect of the interaction between the concentrations of both CS
(X1) and STPP (X2) on Q and DEE % (A and B) and (C and D) at the maximum and minimum levels of both
CS:STPP volume ratio (X3) and ALL amount (X4), respectively, using Design-Expert version 12 (/https://www.
statease.com/software/design-expert).
(X2), if their levels were kept high. However, CS:STPP volume ratio ( X3) and ALL amount ( X4) have an adverse
influence as previously reported19,45.
Moreover, circumspect inspection of Table 2 demonstrates that the interaction between CS (X1) and STPP
(X2), while keeping CS:STPP ( X3) and ALL ( X4) constant either at their low or high levels, is synergistic towards
particle size (F-4 and 8 as well as F-11 and 16).
The substantial increment might be ascribed to an increase in the number of CS chains per volume by
increasing its concentration ( X1), hence forming larger particles when stirred with the cross-linking agent, STPP.
Furthermore, the cross-linking density between CS and STPP decreases, resulting in particle aggregation and
larger particles formation. Likewise, high concentration of STPP ( X2) motivates a faster cross-linking phenom-
enon which might account for particle size increment. These results are in accordance with those obtained by
reported investigations46,47.
Scientific Reports | (2021) 11:2216 | https://doi.org/10.1038/s41598-021-81183-x 9
Vol.:(0123456789)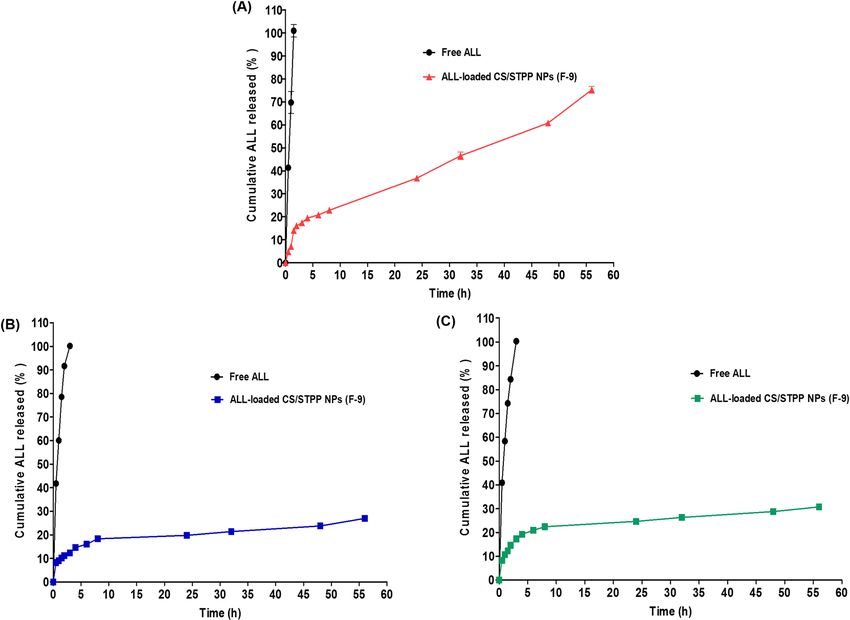
www.nature.com/scientificreports/
Figure 4. Optimization graph. (A) Contour and (B) three dimensional plots with desirability score using
Design-Expert version 12 (/https://www.statease.com/software/design-expert).
ζ‑potential. NPs’ surface charge density, expressed as ZP, is a prime parameter which affects strongly their
cellular uptake ability, mucoadhesive property, and stability. Conventional NPs (without surface modification)
and negatively-charged ones can be readily opsonized and extensively cleared by the reticuloendothelial system
(RES) in the blood stream. On the other hand, positively-charged NPs favour adhesion to the cell mucosa which
are normally negatively-charged, hence can be used as mucoadhesive drug delivery systems. As a rule of thumb,
absolute ZP values above + 30 mV or below − 30 mV provide very good stability in the dispersion medium2,17,48.
Herein, the ZP values of all the prepared formulations were positively-charged. Such a tendency could be
attributed to the presence of freely ionized amino groups (–NH3+) on the surface of the CS/STPP NPs, therefore,
leading to much more powerful electrostatic repulsion between NPs with subsequent enhanced effect on the
stability of the nano-dispersions. These data are in line with reported study19.
The linear regression model for ZP is represented as follows "Eq. (12)":
ZP = +29.74 + 2.592X1 + 0.1250X2 + 0.7458X3 + 1.246X4
+ 1.171X1 X2 + 0.8417X1 X3 + 0.2333X1 X4 − 0.2167X2 X3
(12)
+ 0.5583X2 X4 + 0.3542X3 X4 + 0.1708X1 X2 X3
− 0.6292X1 X2 X4 + 6.06278E − 16X1 X3 X4 − 0.5167X2 X3 X4 − 0.6125X1 X2 X3 X4
where F = 39.39, and p < 0.0001.
Consistently, positive ZP values for all the prepared formulae were obtained in the range of 22.97 ± 0.98 to
35.80 ± 0.92 (F-1 and 16, Table 2).
Positive ZP is known to be rudiment for bioavailability increment through mucoadhesion. The aforemen-
tioned equation shows that all the main ICPs have positive coefficient towards ZP. The final surface charge of
CS/STPP NPs is considerably impacted by CS (X1), with the highest positive coefficient value, which defines the
amount of available protonated amino groups (–NH3+) on the surface of NPs after p reparation19. The statistical
significance of all ICPs and their interactions on ZP and other DMPs is epitomized in Supplementary Table S1
online.
Besides, a Fit statistics summary for the linear regression analysis models of all the DMPs is depicted in Sup-
plementary Table S2 online. High R-squared, Adjusted R-squared and Predicted R-squared values, ranged from
0.9486 to 0.9834, 0.9245 to 0.9756, and 0.8844 to 0.9626, respectively, indicate successful modeling of the results
using the adopted design. Similarly, high values of adequate precision (> 4), ranged from 22.0360 to 42.4175,
indicates the sufficiency of the model to navigate the space with the high signal-to-noise ratio of the results.
Desirability function. Desirability function was utilized to identify the best formula out of 16 formulae.
Accordingly, desirability was computed by the model to select the optimized formulation with reasonable par-
ticle size value along with the highest Q, ZP and high DEE %. The desirability score (Fig. 4) of the design was
found to be 0.914, for F-9, which insinuated precise outcome of the design. As reported, the desirability values
commonly ranged from 0 to 1. Values near to zero indicate imprecise outcomes of the design whereas those close
to one imply precise ones49.
Therefore, this formula (F-9), with ( X1 (+), X
2 (−), X
3 (+), X
4 (+)), was considered as the optimized formula
and subjected to additional elaborate investigations.
Scientific Reports | (2021) 11:2216 | https://doi.org/10.1038/s41598-021-81183-x 10
Vol:.(1234567890)www.nature.com/scientificreports/
Figure 5. (A) TEM image of ALL-loaded CS/STPP NPs (F-9). The image was captured using Gatan Microscopy
Suite Software, version 2.11.1404.0, (http://www.gatan.com/products/tem-analysis/gatan-microscopy-suite
-software). (B) size distribution curve of ALL-loaded CS/STPP NPs (F-9).
Evaluation of formula 9 (F‑9) of ALL‑loaded CS/STPP NPs. Morphology. TEM is a technique
which uses an electron beam to image rather delicate nanoparticulate samples such as emulsions, vesicles, mi-
Ps17. The photomicrographs of the TEM demonstrated nanostructures of spherical morphology
celles, and N
(Fig. 5A). Notably, the particle size of the NPs estimated by TEM (< 200 nm) was diminished compared to that
measured by Zetasizer (508.30 ± 13.35 nm, Fig. 5B), ascribed to the presence of the NPs in the dried state during
TEM imaging, as previously reported19.
FT‑IR. As indicated in Fig. 6A, the FT-IR spectrum of ALL (i) shows distinct absorption bands between 3450
and 3050 cm−1 attributed to asymmetric and symmetric stretching vibrations of both –NH2 and –NH (imide as
well as ring) groups. The peak at 2948 cm−1 is due to the stretching vibration of the aromatic C–H bond. Besides,
the peaks at 1663 and 761 cm−1 are correlated to C=O (amide) stretching and C=O (ring) bending vibrations,
respectively. The obvious bands appeared in the region of 1060–1605 cm−1 are due to the N–H in plane bend-
ing and rocking vibrations of NH2 group, while bands at 1326 and 870 cm−1 are attributed to C−N, of ring and
ureidyl moiety, stretching vibrations50,51.
In the infrared spectrum of CS (ii), the distinctive peak located at 3447 cm−1 represents intermolecular hydro-
gen bonding and stretching vibration of –NH2 as well as –OH groups of CS. The peak at 2900 cm−1 typifies the
stretching vibration of C–H from alkyl groups, whereas the presence of residual N-acetyl groups is confirmed
by the peaks at around 1657 cm−1 (C=O stretching of amide I) and 1320 cm−1 (C−N stretching of amide III),
respectively. Moreover, –CH2 bending besides –CH3 symmetrical deformations are confirmed by the presence
of bands at 1428 and 1360 cm−1, respectively, while that at 1158 cm−1 can be attributed to asymmetric stretching
of the C–O–C bridge. Besides, the bands at 1066 and 1029 cm−1 are related to C–O stretching. Analogous peaks
were previously reported52–54.
The infrared shoulders at 1210, 1160, 1092 and 892 cm−1 appear indicating stretching vibration of P=O, sym-
metric and anti-symmetric stretching vibration of O–P=O, symmetric and anti-symmetric stretching vibration
of the phosphate group ( PO3) and stretching vibration of P–O–P bridge of STPP (iii), r espectively55,56.
The spectrum of the physical mixture of F-9 (iv) namely; ALL (13 mg), CS (312.75 mg) and STPP (12.45 mg),
shows the bands of CS, whereas those of both ALL and STPP are with diminished intensities as the outcome of
dilution factor.
Plain and medicated CS/STPP NPs spectra were synchronized with each other, where C=O stretching of
amide I peak of CS was shifted to 1648 cm−1 and a new peak appeared either at 1555 or 1545 cm−1, for plain (v)
as well as medicated (vi) CS/STPP NPs spectra, respectively, (assigned to N–O–P stretching vibration) verifying
the existence of ionic interactions between CS (amino groups) and STPP (phosphate groups) namely; cross-
linking phenomenon.
Scientific Reports | (2021) 11:2216 | https://doi.org/10.1038/s41598-021-81183-x 11
Vol.:(0123456789)www.nature.com/scientificreports/
Figure 6. Solid characterization. (A) FT-IR spectra, (B) DSC thermograms, and (C) PXRD patterns of pure
ALL (i), CS (ii), STPP (iii), physical mixture of ALL, CS and STPP (iv), plain CS/STPP NPs (v) and ALL-loaded
CS/STPP NPs (F-9) (vi). DSC thermograms were fitted with a Shimadzu TA-60 series (https://www.ssi.shima
dzu.com/products/thermal-analysis/labsolutions-ta-software.html).
Moreover, for medicated NPs, significant reduction at the intensity of the two aforementioned bands
was observed. Such behavior might be attributed to ALL-CS interaction. These results correlate with earlier
reports55,57.
Furthermore, ALL’s distinctive peaks disappeared in the spectrum of medicated NPs, verifying its encapsu-
lation in the NPs matrix besides the potential of interaction between ketonic (C=O) (ring) group of ALL with
amino groups of CS of the NPs.
Scientific Reports | (2021) 11:2216 | https://doi.org/10.1038/s41598-021-81183-x 12
Vol:.(1234567890)www.nature.com/scientificreports/
Thermal properties. Figure 6B illustrates the DSC thermograms of ALL, CS, STPP, and their physical mixture
as well as plain and medicated CS/STPP (F-9).
Two characteristic endothermic peaks of ALL (i) were detected at 237 °C and 256 °C corresponding to its melt-
ing point besides its phase transformation from the solid crystalline phase to the gaseous phase, r espectively50.
CS thermogram (ii) disclosed an exothermic peak at 303 °C which indicates its degradation due to depolym-
erization and dehydration. STPP (iii) showed a weak endothermic peak at 117 °C, corresponding to its melting
point, which is absent in the plain as well as medicated CS/STPP thermograms, presumably due to the ionic
interaction with C S58.
Only one exothermic peak of CS with pronounced disappearance of those of ALL and STPP, as a consequence
of dilution effect, was detected in the thermogram of their physical mixture (iv).
Interestingly, both plain (v) and medicated (vi) CS/STPP NPs thermograms experienced different endother-
mic and exothermic events, compared to pure CS and STPP, which might be accounted for the formation of a
new structure with different thermal characteristics following cross-linking r eactions57.
These thermal events were reached at lower temperature values in case of medicated rather than plain NPs,
hence suggesting an interaction between ALL and CS. Such manner matches the FT-IR data. Moreover, the
absence of ALL peaks was noticed in the thermogram of medicated NPs suggesting its entrapment in the matrix
of the PNPs.
Powder x‑ray diffraction (PXRD). The PXRD patterns of ALL, CS, STPP, physical mixture, plain as well as ALL-
loaded CS/STPP NPs (F-9) are illustrated in Fig. 6C. The PXRD pattern of ALL (i) displays intense diffraction
peaks at angle 15.927°, 20.531°, 22.215°, 24.723°, 28.241°, 29.793°, 32.107°, and 35.122° (2θ), hence denoting the
crystalline pattern of the drug.
On the contrary, the amorphous nature of CS (ii) was noticed59. STPP (iii) crystallinity was manifested by
characteristic peaks at 2θ of 18.826, 19.397, 24.816, 29.664, 33.312, 34.118, and 34.555°2. The physical mixture (iv)
shows the peaks of CS with clear absence of both ALL and STPP peaks due to their comparatively small amounts.
The diffractogram of the medicated ALL-loaded CS/STPP NPs (F-9) (vi) aligned with that of the plain one
(v), besides absence of ALL’s distinctive peaks. Therefore, entrapment of ALL within the CS matrix of the NPs
in amorphous or molecular dispersed state exists. Previously, other loaded drugs in CS NPs showed a similar
manner60,61.
In vitro ALL release study from ALL‑loaded CS/STPP NPs (F‑9). The in vitro release profiles of ALL from CS/
STPP NPs (F-9) compared to its diffusion from aqueous solution were investigated using different simulated
gastrointestinal fluids namely; solutions of 0.1 M HCl (pH 1.2 as simulated gastric fluid (SGF)), phosphate buffer
(pH 6.8 as simulated intestinal fluid (SIF)) and phosphate buffer (pH 7.4 as simulated colonic fluid (SCF)) to
mimic transit of orally administered formulations (Fig. 7).
Free ALL can be considered as an amphoteric molecule where it dissolved completely in all the release media,
regardless the pH of the used media. ALL was completely diffused (100%) from its aqueous solution into the
acidic pH of the stomach (pH 1.2) within one and half an hour (Fig. 7A). Similarly, 100% of the free ALL dis-
solved in 3 h at nearly neutral pH medium of the intestine (pH 6.8) as well as basic pH medium of the colon
(pH 7.4) (Fig. 7B,C). Hydrogen-bond formation between C=O (amide) and N H2 groups of the drug and water
(H2O) molecules of the release media may provoke the complete diffusion of free ALL.
On the contrary, ALL loaded in CS/STPP NPs exhibited a sustained release pattern at the different release
media which is presumably due to ALL’s slow diffusion from CS polymeric matrix. In pH 1.2, extensive CS
swelling, as a consequence of the higher solubility of the polymer at lower pH, with subsequent erosion of NPs
matrix may boost faster drug release (Fig. 7A). These results resembles an earlier s tudy62. Additionally, besides
the release characteristics of the formulation, the physicochemical properties of the drug might influence such
behaviour. It could be speculated that the potential of interaction between ALL and CS, which is suggested via
the obtained FT-IR as well as DSC data, might influence such sustained release behaviour. The prepared NPs
could be considered as nanoscaffold or nanogel oral drug delivery systems.
Release kinetic. The kinetic release data of ALL from the optimized formula (F-9), in the SGF, was best fitted to
Higuchi model (where diffusion-controlled drug release through the NPs matrix represents the rate determin-
ing step). While the Weibull model prevailed for entrapped ALL release from the NPs matrix from SIF as well
as SCF, as depicted in Table 3.
Moreover, supplementary analysis by Korsmeyer-Peppas and Weibull mathematical models established a
Fickian mechanism, n < 0.5 and β ≤ 0.75, elucidating that the drug release from NPs was substantially governed
by diffusion. Similar kinetic behavior of other drugs loaded in CS/STPP NPs was previously r eported62,63.
Mucoadhesive strength. The mucoadhesive characteristics of the optimized ALL-loaded CS/STPP NPs (F-9)
was evaluated by measuring both the mucin-binding efficiency (%) and ZP on interaction with negatively-
charged mucin. Such properties pave the way for prospective application as a drug delivery system.
Mucin‑binding efficiency (%). ALL-loaded CS/STPP NPs (F-9) possessed mucin-binding efficiency (%) value
of 45.55 ± 3.76%. The mucoadhesive properties of CS are attributed to the electrostatic interaction between the
amino groups of CS (positively-charged) and sialic acid residues of mucin (negatively-charged)26. As a conse-
quence, the gastric residence time and cellular uptake of CS NPs, which are essential prerequisites for effective
mucosal delivery of therapeutics, are increased1, 2.
Scientific Reports | (2021) 11:2216 | https://doi.org/10.1038/s41598-021-81183-x 13
Vol.:(0123456789)www.nature.com/scientificreports/
Figure 7. The in vitro release pattern of ALL from ALL-loaded CS/STPP NPs (F-9) in comparison with its
diffusion from aqueous solution at three different pH values (A) pH 1.2, (B) pH 6.8 and (C) pH 7.4. Each point
represents the mean ± SD (n = 3) and the graph was plotted using GraphPad Prism 5.00 (http://www.graphpad.
com).
Coefficients of determination (R2) Korsmeyer-Peppas Weibull
Diffusional Main transport
Formula Zero-order First-order Higuchi model (R2) exponent (n) mechanism (R2) β
F-9 (pH 1.2) 0.9539 0.9484 0.9670 0.9316 0.4473 Fickian 0.9464 0.5586
F-9 (pH 6.8) 0.7197 0.7585 0.8717 0.9604 0.2284 Fickian 0.9621 0.2495
F-9 (pH 7.4) 0.6453 0.6942 0.8271 0.9340 0.2238 Fickian 0.9418 0.2502
Free drug (pH 1.2) 0.9824 0.8250 0.9501 0.9354 0.4746 Fickian – –
Free drug (pH 6.8) 0.8665 0.8848 0.9888 0.9968 0.4820 Fickian – –
Free drug (pH 7.4) 0.8913 0.8055 0.9983 0.9990 0.4905 Fickian – –
Table 3. Kinetic analysis of the percentage drug released and that diffused from ALL-loaded CS/STPP NPs
(F-9) and pure ALL, respectively (see Table 2 for F-9).
ZP of CS/STPP NPs‑mucin mixtures. In order to further emphasize the interactions between CS NPs and mucin,
ZP was investigated (Fig. 8). ZP of mucin and CS solutions were − 5.67 ± 0.46 and + 41.73 ± 0.47 mV, respectively.
It is well-known that positive charge of CS is due to the presence of ammonium ions ( NH3+), however, negative
charge of mucin is attributed to the ionization of sialic acid group (COO−). Incubation of ALL-loaded CS/STPP
NPs (F-9) with mucin results in a significant decrease in ZP from 35.70 ± 0.82 to 3.02 ± 1.15 mV. Such reduction
clearly reflected the strong electrostatic interaction between negatively-charged mucin and positively-charged
CS29.
Scientific Reports | (2021) 11:2216 | https://doi.org/10.1038/s41598-021-81183-x 14
Vol:.(1234567890)You can also read