Frasers Hospitality Trust 1Q FY2018 Financial Review for 1 Oct 2017 to 31 Dec 2017
←
→
Page content transcription
If your browser does not render page correctly, please read the page content below
Frasers Hospitality Trust
1Q FY2018 Financial Review for
1 Oct 2017 to 31 Dec 2017

24 January 2018
Important Notice
Certain statements in this presentation constitute “forward-looking statements”, including forward-looking financial information. Such
forward-looking statements and financial information involve known and unknown risks, uncertainties and other factors which may cause the
actual results, performance or achievements of Frasers Hospitality Trust (“FHT”), Frasers Hospitality Asset Management Pte. Ltd. (as the
manager of Frasers Hospitality Real Estate Investment Trust) or Frasers Hospitality Trust Management Pte. Ltd. (as trustee-manager of
Frasers Hospitality Business Trust) (collectively, the “Managers”), or industry results, to be materially different from any future results,
performance or achievements expressed or implied by such forward-looking statements and financial information. Such forward-looking
statements and financial information are based on numerous assumptions regarding the Managers’ present and future business strategies
and the environment in which FHT or the Managers will operate in the future. Because these statements and financial information reflect the
Managers’ current views concerning future events, these statements and financial information necessarily involve risks, uncertainties and
assumptions. Actual future performance could differ materially from these forward-looking statements and financial information.
The Managers expressly disclaim any obligation or undertaking to release publicly any updates or revisions to any forward-looking
statement or financial information contained in this presentation to reflect any change in the Managers’ expectations with regard thereto or
any change in events, conditions or circumstances on which any such statement or information is based, subject to compliance with all
applicable laws and regulations and/or the rules of the Singapore Exchange Securities Trading Limited (“SGX-ST”) and/or any other
regulatory or supervisory body or agency. The value of stapled securities in FHT (“Stapled Securities”) and the income derived from them, if
any, may fall or rise. Stapled Securities are not obligations of, deposits in, or guaranteed by, the Managers or any of their affiliates. An
investment in Stapled Securities is subject to investment risks, including the possible loss of the principal amount invested. Investors should
note that they have no right to request the Managers to redeem their Stapled Securities while the Stapled Securities are listed. It is intended
that holders of Stapled Securities may only deal in their Stapled Securities through trading on the SGX-ST. Listing of the Stapled Securities
on the SGX-ST does not guarantee a liquid market for the Stapled Securities.
This presentation is for information only and does not constitute an invitation or offer to acquire, purchase or subscribe for the Stapled
Securities. The past performance of FHT and the Managers is not necessarily indicative of the future performance of FHT and the
Managers.
This presentation includes market and industry data and forecast that have been obtained from internal survey, reports and studies, where
appropriate, as well as market research, publicly available information and industry publications. Industry publications, surveys and
forecasts generally state that the information they contain has been obtained from sources believed to be reliable, but there can be no
assurance as to the accuracy or completeness of such included information. While the Managers have taken reasonable steps to ensure
that the information is extracted accurately and in its proper context, the Managers have not independently verified any of the data from third
party sources or ascertained the underlying economic assumptions relied upon therein.
Any discrepancies in the figures included herein between the listed amounts and total thereof are due to rounding.

                                                                                                                                                  2
Content
Key Highlights
Portfolio Performance
Risk and Capital Management
Outlook
3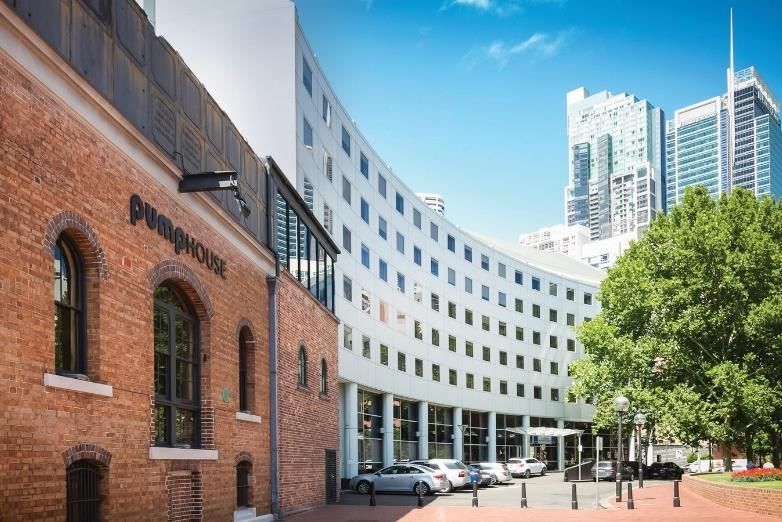
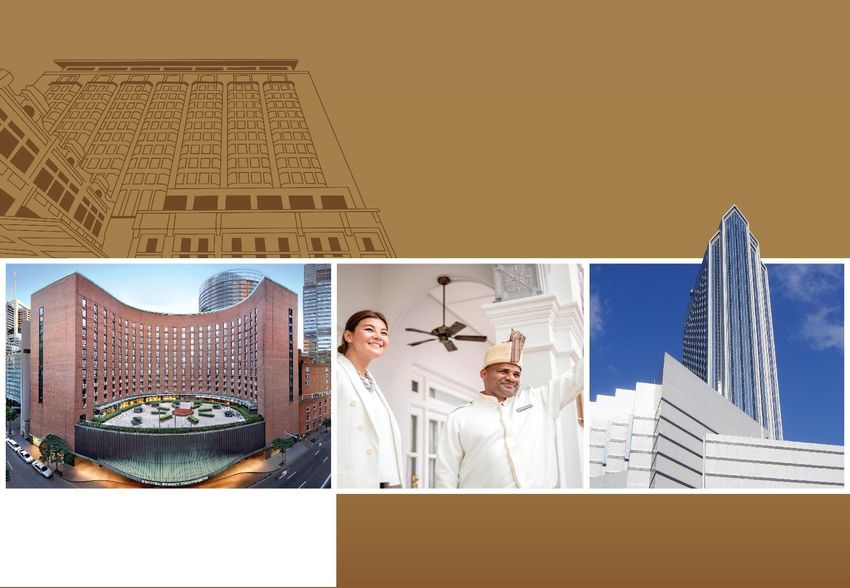
Novotel Melbourne on Collins

                               Key Highlights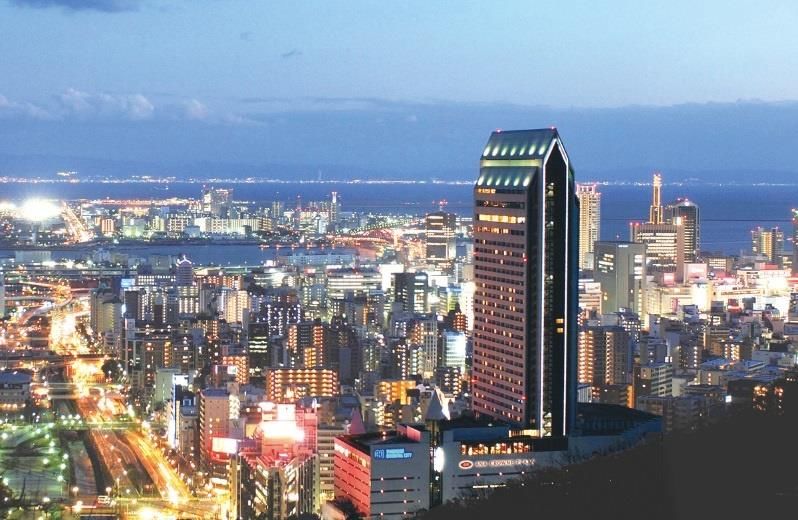
Financial Review for 1Q FY2018

    S$m                                   1Q FY2018               1Q FY2017               Variance

    Gross Revenue (GR)                        41.5                    39.6                    4.8%

    Net Property Income (NPI)                 31.4                    30.5                    3.1%

    Distribution Income (DI)                  24.4                    24.4                    0.2%

    No. of Issued Stapled
                                            1,861.2                 1,841.2                   1.1%
    Securities (million)

    Distribution Per Stapled
                                         1.3107 cents            1.3258 cents                 1.1%
    Security (DPS)

•    GR and NPI improved yoy by 4.8% and 3.1% respectively due to better performance of all country
     portfolios except for the UK.
•    As part of FHT’s prudent capital management strategy, FH-REIT extended its debt maturity by refinancing
     the S$115 million 3-year bank loan with a 5-year tenure bond issuance at a higher interest cost.
•    DI was maintained at S$24.4 million despite lower contribution from Novotel Rockford Darling Harbour
     which is undergoing renovation.
•    Due to a higher stapled security base, DPS was slightly lower yoy.

                                                                                                               5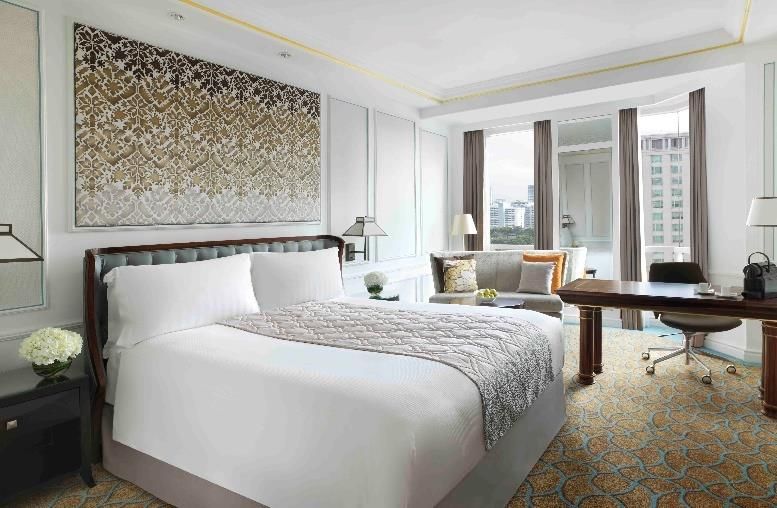
InterContinental Singapore

                             Portfolio Performance
Portfolio Contribution by Country – 1Q FY2018

                  Germany                             Germany
                    4%                                  5%
               Malaysia                           Malaysia
                 5%                                 6%
       Japan
        13%                              Japan
                                          15%                    Australia
                   GR       Australia                   NPI        40%
      United
     Kingdom     S$41.5m      46%                     S$31.4m
       13%                               United
                                        Kingdom
                                          13%

           Singapore
                                                     Singapore
              19%
                                                        21%

                                                                             7
Portfolio Highlights By Country – 1Q FY2018

                                         1Q FY2018

 Country      Gross Operating Revenue (GOR)     Gross Operating Profit (GOP)

             Local Currency     Variance      Local Currency      Variance
                   (m)            (yoy)             (m)            (yoy)

 Australia        34.2            3.7%               15.7            4.9%

 Singapore        22.0            1.7%                9.0           4.5%

 UK                6.0            1.1%                3.2           4.0%

 Japan           1,812.9          2.9%               585.3          6.2%

 Malaysia         24.7            1.9%                7.9           2.4%

 Germany           3.1            3.9%                1.4           3.2%

                                                                               8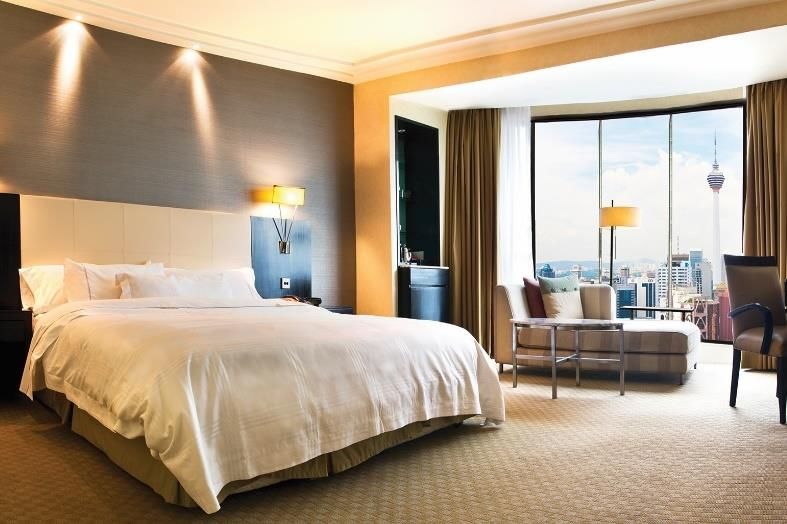
Australia Portfolio Performance                                  AUD (m) 1Q FY2018 1Q FY2017 Variance
                                                                 GOR        34.2       33.0         3.7%

                                                                 GOP        15.7       14.9         4.9%

❖ Novotel Melbourne on Collins (NMOC) ❖ Novotel Rockford Darling Harbour (NRDH)
❖ Sofitel Sydney Wentworth (SSW)                    ❖ Fraser Suites Sydney (FSS)
•   NMOC was the key contributor to the increase in GOR and GOP of Australia portfolio in 1Q FY2018.
•   Due to the renovation of NRDH, RevPAR for the portfolio declined 1.8% yoy on the back of lower
    overall occupancy. RevPAR for Sydney (excl. NRDH) and Melbourne properties improved by 1.0% and
    6.1% respectively for the quarter.
•   Sydney and Melbourne continued to enjoy busy events calendars, with Sydney in particular benefitting
    from the opening of the International Convention Centre.

            ADR                                                                    Ave RevPAR
           (AUD)                                 Ave OCC                              (AUD)

     262
                   252
                                                       92.2%                   228            232
                                         86.9%

                                     1Q FY2018                 1Q FY2017

                                                                                                           9
Singapore Portfolio Performance                                  SGD (m)   1Q FY2018 1Q FY2017 Variance
                                                                 GOR         22.0         21.7         1.7%
                                                                 GOP          9.0         8.6          4.5%

❖ InterContinental Singapore (ICSG)
❖ Fraser Suites Singapore (FSSG)
•   In 1Q FY2018, ICSG achieved higher RevPAR on the back of occupancy and ADR gains as well as
    higher F&B outlet revenue.
•   However, portfolio ADR and RevPAR were lower yoy by 2.0% and 1.0% respectively due to downward
    pressure on ADR at FSSG.

            ADR                                                                      Ave RevPAR
           (SGD)                               Ave OCC                                  (SGD)

                   300                 82.1%
     294
                                                         81.3%                      242          244

                                   1Q FY2018                 1Q FY2017

                                                                                                              10
UK Portfolio Performance GBP (m) 1Q FY2018 1Q FY2017 Variance
GOR 6.0 6.1 1.1%
GOP 3.2 3.3 4.0%
❖ Best Western Cromwell London (BWCL) ❖ Park International London (PIL)
❖ Fraser Place Canary Wharf (FPCW) ❖ Fraser Suites Edinburgh (FSE)
❖ Fraser Suites Glasgow (FSG) ❖ Fraser Suites Queens Gate (FSQG)
• GOR and GOP of the UK portfolio declined 1.1% and 4.0% respectively due to overall weaker room
revenue as well as increase in staff costs due to higher minimum wage rates.
• Pressure on GOP is expected to persist with the anticipation of further increase in minimum wage
rates.
ADR Ave RevPAR
(GBP) Ave OCC (GBP)
114 84.6% 86.8%
112 97
97
Axis Title
1Q FY2018 1Q FY2017
11Japan Portfolio Performance JPY (m) 1Q FY2018 1Q FY2017 Variance
GOR 1,812.9 1,762.5 2.9%
GOP 585.3 551.2 6.2%
❖ ANA Crowne Plaza Kobe (CPK)
• CPK’s GOR and GOP in 1Q FY2018 increased yoy by 2.9% and 6.2% respectively due to more events
being held at the hotel which led to better banquet performance.
• Apart from continuing to drive room revenue, the hotel remains focused on increasing revenue from
local and international conferences and events.
ADR Ave RevPAR
(JPY) Ave OCC (JPY)
15,255 15,801
80.1%
77.6%
12,218 12,258
1Q FY2018 1Q FY2017
12Malaysia Portfolio Performance MYR (m) 1Q FY2018 1Q FY2017 Variance
GOR 24.7 24.3 1.9%
GOP 7.9 7.7 2.4%
❖ The Westin Kuala Lumpur (TWKL)
• TWKL’s GOR and GOP grew yoy by 1.9% and 2.4% respectively due to higher F&B revenue on the
back of stronger banquet performance.
• The hotel’s RevPAR declined 1.8% in this quarter as a result of softer corporate demand.
ADR Ave RevPAR
(MYR) Ave OCC (MYR)
515 523
74.9% 74.9%
384 391
1Q FY2018 1Q FY2017
13Asset Enhancement Initiatives (AEI)
Novotel Rockford Darling Harbour – Now Known as Novotel Sydney Darling Square
(NSDS)
• Renovation on schedule to complete by 31 Jan 2018. Full room inventory back since 14 Dec 2017.
• Extension of the driveway, replacement of awning and renovation for Pumphouse restaurant to be
completed by Q4 FY2018.
• The franchise agreement with AccorHotels has been converted to a management agreement with
effect from 1 Jan 2018 at lower fees.
• To capitalise on the positive momentum of the Darling Square precinct, this hotel has been
renamed Novotel Sydney Darling Square.
ISLG new signage (front) ISLG new signage (side)
NSDS Guest Room NSDS Reception & Lobby Lounge
14Asset Enhancement Initiatives (AEI)
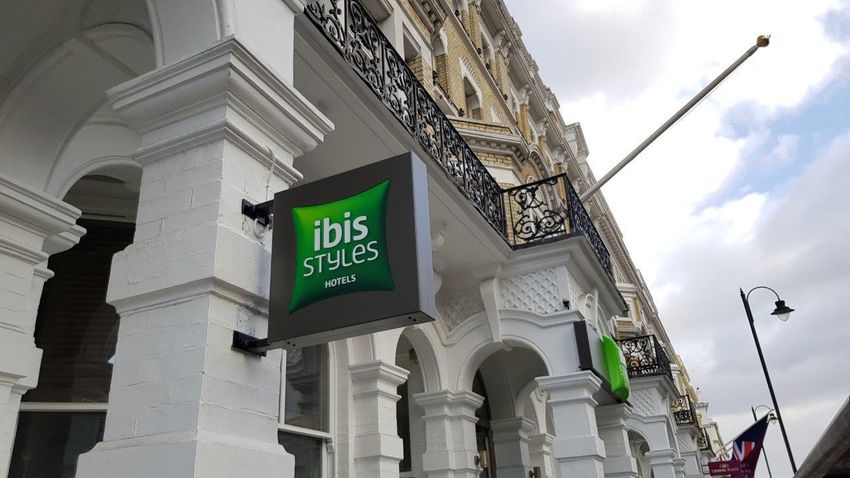
Best Western Cromwell London – Now Known as ibis Styles London Gloucester
Road (ISLG)
• Conversion from Best Western (franchised) to ibis Styles (AccorHotels managed) with effect
from 1 Jan 2018.
• Embarking on a GBP2.2 million renovation to re-position the hotel in line with the Ibis Styles
brand. Renovation works will cover guest rooms and public areas.
• Timeline:
- Feb 2018 – Aug 2018: design finalisation, mock-up rooms
- Sep 2018 – Feb 2019: site works
ISLG new signage (front) ISLG new signage (side)
15Capital Management Park International London
Risk and Capital Management
    As at 31 Dec 2017                                                             As at 31 Dec 2017

    Investment Properties                                    S$2,157.3m            Weighted Average Years to Maturity               2.61 years

    Property, Plant and Equipment                            S$259.5m              Unsecured Debt                                      96.1%

    Total Assets                                             S$2,496.9m            Effective Cost of Borrowing                         2.8%1

    Total Borrowings                                         S$821.3m             Borrowings on Fixed Rates                            88.5%

    Gearing                                                    33.0%              Interest Cover                                    5.5 times

    Net Asset Value (NAV) per Stapled Security               78.66 cents          FHT’s Issuer Rating by Moody’s                       Baa2

SGD (m)
          Debt Maturity Profile (excludes short-term loans)                                    Balance Sheet Hedging
 500.0
                    449.2                                                  GBP                                       55.5%
 450.0
 400.0
 350.0                                                                     EUR                        31.5%
 300.0
 250.0                                                                     AUD                      27.3%
 200.0
 150.0     121.5                              120.0            120.0       MYR                  22.1%
 100.0
  50.0                       0.01     0.0              0.0                 JPY                                                     78.8%
   0.0
           2018    2019     2020     2021     2022    2023     2024              0%         20%         40%          60%         80%          100%
  1 The effective cost of borrowing includes the full amortisation of the debt upfront cost which relates to the prepayment of S$110 million of
    Facility B of FH-REIT’s S$615 million Term Loan Facility. Excluding the effect of this one-time amortisation cost, the effective cost of
    borrowing is 2.6% per annum.

                                                                                                                                                     17
ANA Crowne Plaza Kobe
OutlookAustralia
• For Jan to Nov 2017, Tourism Australia reported an increase
in international arrivals of 6.9% yoy, with Chinese visitors
growing 12.2%.
• Sydney’s hotel market is expected to strengthen, with
continued strong demand bolstered by the opening
of the International Convention Centre. Stable occupancy
and anticipated increases in ADR are expected to push
RevPAR up further1.
• While Melbourne continues to enjoy strong visitor growth,
the market buoyancy of recent years is anticipated to
moderate over the medium term as the city’s hotel
development pipeline continues to build2.
Pictures from Novotel Sydney Darling Square and Sofitel Sydney Wentworth
1. Source: JLL – Asia Pacific Property Digest, Q3 2017
2. Source: JLL – Hotel Destinations Asia Pacific, Oct 2017
19Singapore
• Growth in visitor arrivals continued on a positive trajectory as
the Singapore Tourism Board reported a yoy growth of 5.8%
for Jan to Oct 2017. China and Indonesia were the top
source markets, accounting for 35.5% of total visitor arrivals.
• Singapore continues to grow its status as a leading MICE
destination. Prominent events lined up for 2018 include the
biennial Singapore Airshow, Food&HotelAsia, World Cities
Summit, Dental Aesthetics Meeting in Asia and ITLM Asia
Pacific.
• The decline in Singapore’s hotel trading performance is
expected to improve as the market is nearing the end of a
protracted rise in new hotel supply. Continued visitor growth
should provide a strong base for hotel demand1.
Pictures from Gardens by the Bay, InterContinental Singapore and Fraser Suites
Singapore
1. Source: JLL – Asia Pacific Property Digest, Q3 2017 and Hotel Destinations Asia
Pacific, Oct 2017
20United Kingdom
• According to Visit Britain, the UK received 33.3 million
overseas visitors for Jan to Oct 2017, up 5.0% yoy.
• However, for the same period, there were 4% fewer business
visits to the UK. It appears that headwinds from policy
uncertainty, including Brexit, have impacted corporate
demand1.
• Going forward, uncertainty in the UK economy, the slowing
effect of the weak British pound and increasing cost of labour
are expected to continue to weigh on the UK hotel industry1.
Pictures from Visit London, Fraser Place Canary Wharf and Fraser Suites Queens Gate
1 Source: PwC – As Good As It Gets – UK Hotels Forecast 2018, Sep 2017
21Japan
• For 2017, Japan National Tourism Organization recorded
19.3% growth in foreign visitors, with the number of Korean
and Chinese visitors growing yoy by 40.3% and 15.4%
respectively.
• The strong momentum of inbound tourism is expected to
continue, supported by key events including the Rugby World
Cup 2019, 2020 Tokyo Olympic Games and the highly
anticipated integrated resort development1.
• With the government’s efforts to develop tour routes in
regional cities, there appears to be more upside potential for
hotels outside of Tokyo1.
Pictures from IHG ANA Crowne Plaza Kobe
1 Source: Savills – Spotlight: Japan Hospitality, Sep 2017
22Malaysia
• According to Tourism Malaysia, tourist arrivals declined by
2.5% yoy to 21.5 million for Jan to Oct 2017. However,
Chinese tourists grew 8.1% yoy for the same period.
• While the hotel trading performance in Kuala Lumpur has
seen some improvement in 2017, the anticipated influx of
new supply is expected to place further pressure on room
rates1.
Pictures from Tourism Malaysia and The Westin Kuala Lumpur
1 Source: JLL – Hotel Destinations - Asia Pacific Oct 2017
23Germany
• The Federal Statistical Office of Germany recorded a 3.0%
yoy increase in the number of domestic and foreign overnight
stays for Jan to Nov 20171.
• In Dresden, the total number of domestic and foreign visitors
rose 4.6% yoy for Jan to Oct 20172.
• The capital city of the Free State of Saxony continues to
grow its pipeline of MICE events including Energie, Lab
Supply, Bauen Kaufen Wohnen, Hematology and Oncology
Conference, Sachsenback and International Symposium
Additive Manufacturing.
Pictures from Semperoper Dresden and Maritim Hotel Dresden
1 Source: www.destatis.de
2 Source: www.dresden.de
24Thank you. Sofitel Sydney Wentworth
Resilient and Diversified Portfolio Across Geography
                                         Edinburgh
                                          Edinburgh
                                       Fraser Suites Edinburgh
                                          ▪ Fraser Suites Edinburgh

Glasgow
                                        Europe
▪ Fraser Suites Glasgow
                      United
                     Kingdom              Germany

London                                                                                                                           KobeKobe
▪ ibis Styles London Gloucester Road                                                                                             ▪ ANA Crowne Plaza Kobe
▪ Park International London                                                                                            Japan
▪ Fraser Place Canary Wharf
▪ Fraser Suites Queens Gate

Dresden                                                                                                             Asia
▪ Maritim Hotel Dresden
                                                                                        Malaysia

                                                                                                    Singapore
                                                                                                                               Sydney

15                        9                 3,914                     Kuala Lumpur
                                                                                                                               ▪ Novotel Sydney Darling
                                                                                                                                Square
                                                                                                                               ▪ Sofitel Sydney Wentworth
                                                                                                                               ▪ Fraser Suites Sydney
Properties                Cities           Keys                       ▪ The Westin
                                                                            KualaKuala Lumpur
                                                                                   Lumpur                    Australia
                                                                                                                                   Melbourne
S$1.5b                                                                               Singapore
                                                                                     ▪ InterContinental Singapore
                                                                                                                                   ▪ Novotel Melbourne
                                                                                                                                     on Collins
Market Cap                                                                           ▪ Fraser Suites Singapore
(as at 24 Jan 2018)
                                                                                        Singapore

                                                                                                                                                            26
Portfolio Overview
Hotel Properties Managed by Third-Party Operators
Property Country Description Tenure1 Class Rooms
Only 5-star luxury hotel in
InterContinental Singapore to preserve Peranakan
Singapore 75 years Luxury 406
Singapore heritage in a shop house style
setting
4.5-star hotel located within close
Novotel Sydney Darling
Australia proximity of Sydney’s Darling 84 years Mid-scale 230
Square Harbour & Chinatown
Iconic 5-star hotel in Sydney’s
Sofitel Sydney core CBD within a short walk to
Australia 75 years Luxury 436
Wentworth major office buildings, tourist
attractions and transport hubs
Strategically located within
Novotel Melbourne on
Australia Melbourne’s core CBD area Freehold Upscale 380
Collins along Collins Street
ibis Styles London United Distinctive white Victorian façade
75 years Mid-scale 85
Gloucester Road Kingdom located in the heart of London
1 From 14 July 2014
27Portfolio Overview
Hotel Properties Managed by Third-Party Operators
Property Country Description Tenure1 Class Rooms
Park International United Elegant hotel ideally located in the
75 years Mid-scale 171
London Kingdom heart of Kensington & Chelsea
ANA Crowne Plaza Unique panoramic view of Kobe Upper
Japan Freehold 593
Kobe city from Rokko mountain Upscale
5-star luxury hotel located in the
The Westin Kuala Upper
Malaysia center of Kuala Lumpur’s bustling Freehold 443
Lumpur Upscale
Golden Triangle area
Heritage-listed and located in the
historical city centre of Dresden,
Maritim Hotel Dresden Germany Freehold Upscale 328
the capital city of the eastern
German state of Saxony
1 From 14 July 2014
28Portfolio Overview
Serviced Residences Managed by Frasers Hospitality
Property Country Description Tenure1 Class Rooms
Luxurious serviced residences in
Upper
Fraser Suites Singapore Singapore the prime residential district of 75 years 255
Upscale
River Valley
First luxury apartments in Sydney
Upper
Fraser Suites Sydney Australia designed by internationally 75 years 201
Upscale
renowned architects
Rustic 1750s sandstone building
United Upper
Fraser Suites Edinburgh located in the heart of Edinburgh’s 75 years 75
Kingdom Upscale
Old Town
United Stunning renovated 1850s building Upper
Fraser Suites Glasgow 75 years 98
Kingdom formerly the city bank of Glasgow Upscale
Fraser Suites Queens United Beautiful Victorian apartment hotel Upper
75 years 105
Gate Kingdom in Kensington Upscale
Stunning apartments located by
Fraser Place Canary United Upper
River Thames showcasing chic 75 years 108
Wharf Kingdom Upscale
contemporary design
1 From 14 July 2014
29You can also read