SUNTEC REIT 3Q 2021 UPDATE - 22 October 2021 - Singapore Exchange
←
→
Page content transcription
If your browser does not render page correctly, please read the page content below

SUNTEC REIT
3Q 2021 UPDATE
  22 October 2021

Agenda

 03                     15
 3Q 21 Highlights       Singapore Office Portfolio Performance

 04                     22
 Financial Highlights   Singapore Retail Portfolio Performance

 12                     27
 Capital Management     Australia & UK Portfolio Performance

                        31
                        Looking Ahead

                                                                 2
3Q 21 Highlights

        DISTRIBUTABLE INCOME FROM OPERATIONS
        S$63.7 million, +22.0% y-o-y

        DISTRIBUTION PER UNIT TO UNITHOLDERS
        2.232 cents, +20.8% y-o-y

         ACTIVE PORTFOLIO MANAGEMENT
         The Minster Building, City of London: Acquisition completed on 28 Jul 2021
         Suntec City Office Strata Units: Divestment completed on 21 Sep 2021

         SUSTAINABILITY
         Awarded Highest Accolade of GRESB Global Sector Leader for Office-Listed Category
         Ranked Number One in Asia (Office)

                                                                                             3
FINANCIAL
HIGHLIGHTS
3Q 21 Financial Performance

           Gross Revenue         Net Property Income             JV Income

            16.5%

                                       45.5%

                                                                  21.7%
                       92.7
    79.6                                          68.8

                               47.3                                          30.3
                                                         24.9

   3Q 20               3Q 21   3Q 20             3Q 21   3Q 20               3Q 21

                                                                                     5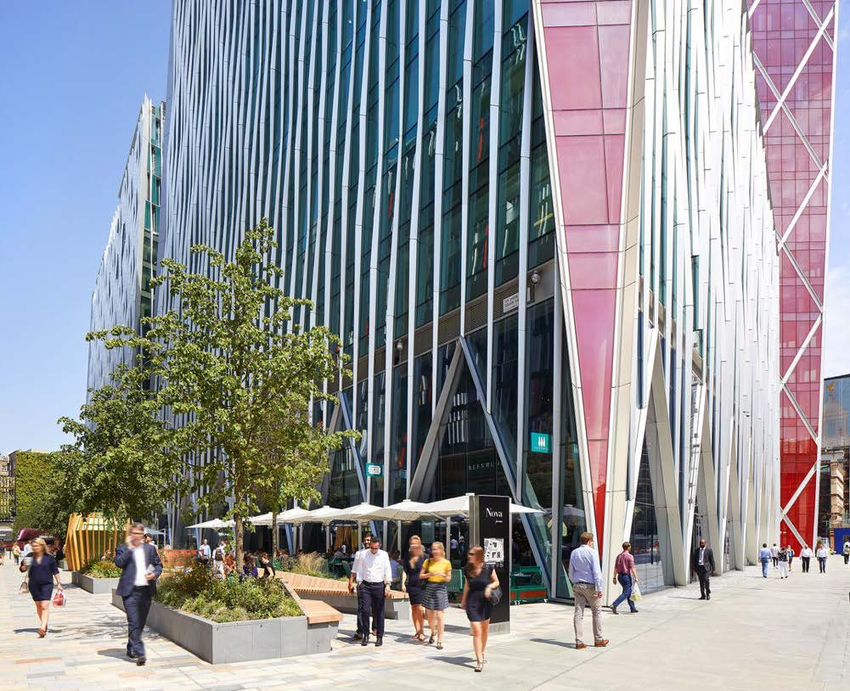
3Q 21 Gross Revenue increased 16.5% y-o-y
                  S$ mil

              TOTAL
               Total
                                                                                                                92.7         16.5%
                                                                                                     79.6

 Suntec City Office
                                                             33.6   - Lower occupancy
                                                             33.8

                                                                    + Lower rent assistance; higher occupancy; higher GTO rent;
                                                      23.7          higher marcom revenue
   Suntec City Mall
                                                   21.0
                                                                    - Lower fixed rent

Suntec Convention
                               2.7                - Lower revenue from corporate events & long term licences
                                4.0               + Contribution from hybrid events

177 Pacific Highway
                                           12.7   + One-off surrender fee received
                                        10.1

     21 Harris Street
                                3.8               + Higher occupancy
                               2.9

                                4.4               + 2Q rent of a tenant recognised in 3Q upon signing of tenancy agreement
    55 Currie Street
                                4.1               - Rent free incentives for renewal lease

   477 Collins Street
                                      7.3         + Contribution with effect from 1 August 2020; higher occupancy
                               3.7

    Minster Building
                                4.5               + Acquisition completed on 28 July 2021                                 3Q 21
                           -
                                                                                                                          3Q 20

                                                                                                                                     6
3Q 21 NPI & JV Income
S$ mil
OFFICE NPINPI
Office TOTAL
Total 53.5 28.9%
41.5
Suntec City Office 26.1 + Lower expenses due to lower sinking fund
24.4
177 Pacific Highway 8.8
11.0 + Higher revenue
21 Harris Street 3.0
2.3
+ Higher revenue
55 Currie Street 3.4
3.0 + Higher revenue
477 Collins Street 3.0
5.9 + Higher revenue
3Q 21
Minster Building -
4.1 + Acquisition completed on 28 July 2021 3Q 20
S$ mil
OFFICE JV INCOME
Office TOTAL
JV Income Total 31.4 20.8%
26.0
5.9
- Lower occupancy from exit of anchor tenant
One Raffles Quay
6.9 + Higher rent due to positive rent reversion
MBFC Towers 1 & 2 12.1 - Lower occupancy from reduction of FI space upon expiry;
13.3 higher leasing expense
9 Penang Road - - Rent commencement from 3Q 20; divested on 16 June 2021
0.5
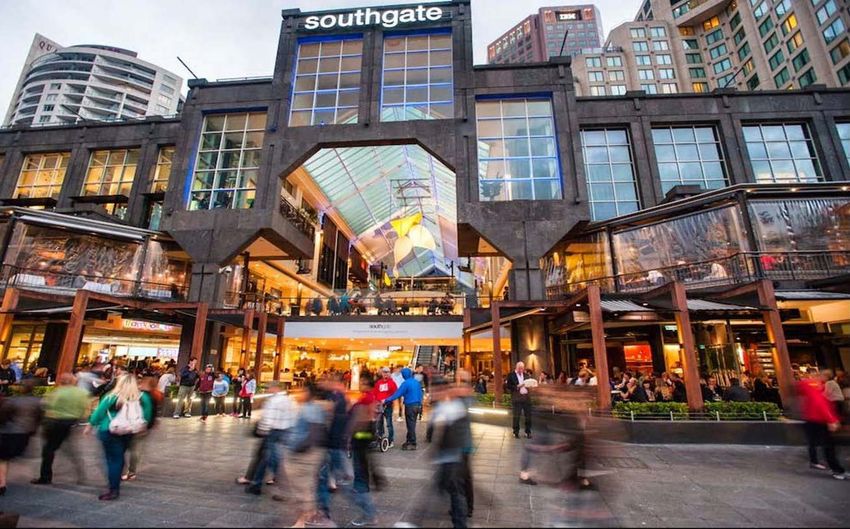
Southgate Office 5.2 - Lower occupancy
5.3
3Q 21
Nova Properties 8.2 + Acquisition completed on 18 December 2020
- 3Q 20
7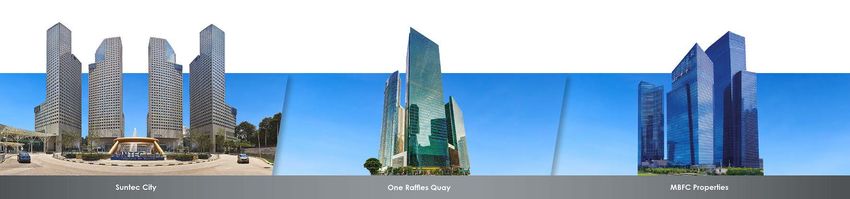
3Q 21 NPI & JV Income

                       S$ mil

          RETAIL TOTAL                                        14.9                                  86.3%
                                                8.0

                                                                 16.0   + Higher revenue; recovery of doubtful debts;
     Suntec City Mall
                                                      9.1               lower expenses due to lower sinking fund

                                0.5   + Lower rent assistance
 Marina Bay Link Mall           0.5   - Lower occupancy & rent
    Southgate Retail
              -1.6                    + Lower rent assistance
                                                                                                                        3Q 21
              -1.6                    - Lower occupancy & rent
                                                                                                                        3Q 20

                       S$ mil

SUNTEC CONVENTION
                                                                                                    78.8%
                -0.7                  + Lower staff cost & sinking fund
   -3.3                               - Lower revenue; lower government grants
                                                                                                                        3Q 21
                                                                                                                        3Q 20

                                                                                                                                8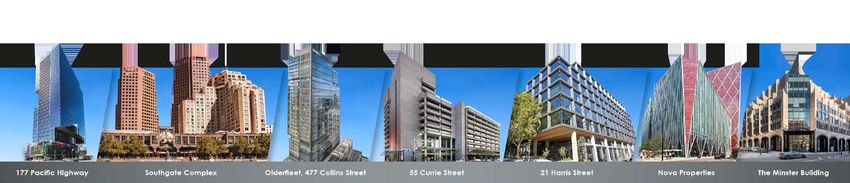
Distribution Income to Unitholders

         Distributable Income from Operations                               DPU to Unitholders
                         (S$ mil)                                              (SG cents)

                        22.0%
                                                                                20.8%

                                    63.7
               52.2                                                                         2.232
                                                                    1.848

              3Q 20                 3Q 21                           3Q 20                   3Q 21

Distributable Income from Operations                         DPU to Unitholders
S$63.7 million,+22.0% y-o-y                                  2.232 cents, +20.8% y-o-y
+ Contribution from Nova Properties, The Minster Building,   + Higher distributable income from operations
477 Collins Street
+ Lower retail rent assistance
+ One-off surrender fee from 177 Pacific Highway
- Lower occupancy partially mitigated by positive rent
reversions for SG office assets
- Higher financing cost to fund acquisitions

                                                                                                             9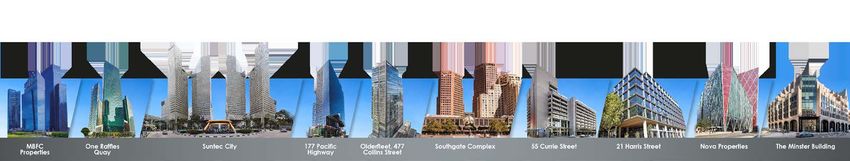
Diversified Portfolio across Sector and Geography

                                                                                Minster Building
Office,                                                                               4%
 86%                                                          Nova Properties
                                                                   8%

                                                   55 Currie Street                                                 Suntec City
                                                        3%                                                             40%
                                     Retail,
                                      15%
                                                477 Collins
                                                    6%

                                               Southgate

          S$99.1 million                                                   S$99.1 million
                                               Complex
                                                  4%
            NPI & JV Income                     21 Harris                          NPI & JV Income
                 3Q 21                             3%                                   3Q 21

                                      Convention,
                                         -1%

                                               177 Pacific Highway
                                                      11%                                                      Suntec Singapore
                                                                                                                      2%
                                                                                                   One Raffles Quay
                                                                          MBFC Properties
                                                                                                         6%
                                                                               13%

            Contribution by Sector                                          Contribution by Asset

                                                                                                                             10
Distribution Timetable
Distribution Payment
Distribution Period 1 July – 30 September 2021
Amount (cents/unit) 2.232
Ex-date 29 Oct 2021
Record date 1 Nov 2021
Payment date 29 Nov 2021
11CAPITAL MANAGEMENT
Key Financial Indicators
                                                                                As at 30 Sep ‘21                   As at 30 Jun ‘21

                  NAV Per Unit1                                                      S$2.047                             S$2.062

                  Total Debt Outstanding                                           S$5,155 mil                        S$4,889 mil

                  Aggregate Leverage Ratio2                                            44.3%                              43.1%

                  Weighted Average Debt Maturity                                    3.07 years                         2.99 years

                  All-in Financing Cost                                            2.32% p.a.                          2.41% p.a.

                  Adjusted ICR3                                                         2.7X                               2.8X

                  Weighted average interest maturity                                2.33 years                         2.38 years

                  Interest Rate Borrowings (fixed)                                     ~57%                               ~64%

                  % of AUD income hedged4                                              ~81%                               ~80%

 Notes:
 1. Excludes perpetual securities
 2. “Aggregate Leverage Ratio” refers to the ratio of total borrowings (inclusive of proportionate share of borrowings of joint ventures) and deferred
    payments (if any) to the value of the Deposited Property.
 3. Adjusted interest cover ratio (“Adjusted-ICR”) refers to the ratio that is calculated by dividing the trailing 12 months earnings before interest, tax, sinking
    fund contribution, depreciation and amortisation (excluding effects of any fair value changes of derivatives and investment properties, and foreign
    exchange translation), by the trailing 12 months interest expense, borrowing-related fees and distributions on hybrid securities (if any).
 4. Refers to income hedged for FY 21.

                                                                                                                                                                      13
Proactive Capital Management
Debt & Interest Maturity Profile Perpetual Securities
(First Reset)
1,600 1,200
1,445
1,400
221 1,000
1,200
1,019
800
1,000 900 891
280 1224
800 600
700 221
100
600
400
300
900
400
739
600 200
200
200 370
200
0
0
FY2025 FY2026
FY2021 FY2022 FY2023 FY2024 FY2025 FY2026 FY2027
Medium term notes Bank facility Green loan Perpetual Securities
Fixed/Hedge Expiry (S$350 mil)
(S$880 mil) (S$3,833 mil) (S$442 mil)
Completed Re-Financing for 2021
14SINGAPORE OFFICE PORTFOLIO PERFORMANCE
Singapore Office Committed Occupancy

           95.5%                             97.2%                                96.8%              96.1%           Core CBD
                                                                                                                    Occupancy
                                                                                                                      92.1%3

    Suntec City Office                  One Raffles Quay                    MBFC Towers 1 & 2   Singapore Overall

                              Singapore Office Portfolio Occupancy Remains Strong
    Notes:
    1. Combined occupancy for One Raffles Quay office and ancillary retail was 97.2%.
    2. Committed occupancy for Singapore Overall (including ancillary retail) was 96.1%.
    3. Source: CBRE as at 3Q 2021

                                                                                                                           16
Singapore Office Leasing Activity
Portfolio Work Done1 YTD 21: 585,300 sq ft Portfolio Work Done1 3Q 21: 179,900 sq ft
(60% are renewal leases) (57% are renewal leases)
2
New2 New
232,800 sq ft 77,400 sq ft
Renew Renew
352,500 sq ft 102,500 sq ft
2 2
New Tenants by Sector YTD 21 (sq ft)
Technology, media and telecommunications 31%
Banking, Insurance and Financial Services 19%
Manufacturing & Distribution 11%
Consultancy / Services 8%
Energy and Natural Resources 7%
Trading & Investments 4%
Real Estate and Property Services 4%
Pharmaceuticals & Healthcare 4%
Shipping and Freight Forwarding 2%
Others 10%
Notes:
1. Reflects net lettable area of new leases and renewals committed based on Suntec REIT’s interests in Suntec City Office, One Raffles Quay and Marina
Bay Financial Centre Office Towers 1 and 2.
2. Excludes new leases (about 11,500 sq ft) committed for units that were vacant for more than 1 year.
17Singapore Office Lease Expiry
% of Total NLA1 Q-o-Q Comparison
24.5% 24.7% 22.1% 24.5%
5.0% 19.4% 18.7% 13.9% 17.0%
7.3% 9.2%
7.8% 3.9%
2.0%
2021 2022 2023 2024 2025 2026 & Beyond
Vacant NLA Expiries as at 2Q 21 Expiries as at 3Q 21 WALE 2.79 Years
FY 2026 &
FY2021 FY2022 FY2023 FY2024 FY2025
Beyond
Sq ft 43,971 419,374 552,882 549,481 207,329 381,457
% 2.0% 18.7% 24.7% 24.5% 9.2% 17.0%
Well Spread Portfolio Lease Expiry Providing Support, Enhancing Resilience
Note:
1. Based on Suntec REIT’s interests in Suntec City Office, One Raffles Quay and Marina Bay Financial Centre Office Towers 1 and 2.
18Suntec City Office – Leasing Activity
Work Done1 YTD 21: 360,400 sq ft
(64% are renewal leases)
Rent Reversion2
New2
131,300 sq ft YTD 21 +2.8%
Renew
229,100
2 sq ft 1Q 21 2Q 21 3Q 21
-0.9% +2.1% +7.3%
New Tenants by Sector YTD 21 (sq ft)
Technology, media and telecommunications 29%
Banking, Insurance and Financial Services 12%
Consultancy / Services 10%
Energy and Natural Resources 10%
Real Estate and Property Services 8%
Trading & Investments 7%
Pharmaceuticals & Healthcare 4%
Manufacturing & Distribution 3%
Shipping and Freight Forwarding 1%
Others 16%
Notes:
1. Reflects net lettable area of new leases and renewals committed.
2. Excludes new leases (about 7,200 sq ft) committed for units that were vacant for more than 1 year.
19Suntec City Office - Committed Occupancy
& Average Gross Rent
psf pm
110% $9.09 $9.08 $9.50
$8.77 $8.78 $8.84 $8.91
$8.58 $8.68
$8.50
100%
100.0% $7.75
98.7% 98.1% 97.0% 96.0%
95.6% 95.5% $7.50
90% 93.4%
$6.50
92.1%
80%
$5.50
70%
$4.50
60%
$3.50
50% $2.50
4Q 19 1Q 20 2Q 20 3Q 20 4Q 20 1Q 21 2Q 21 3Q 21 3Q 21
Suntec Office Committed Occupancy Rate (%) Suntec Office Passing Rent psf ($)
CBRE 3Q 2021 Core CBD Occupancy Rate (%) CBRE 3Q 2021 Grade B Core CBD Rent (S$psf pm)
Strong Occupancy and Stable Gross Rent Above Market Level
20Suntec City Office – Lease Expiry & Expiry Rent
100.0% psf pm $10.0
90.0% $9.54 $9.5
$9.32 $9.32
80.0% $9.19 $9.25
$9.18
$9.0
70.0%
$8.5
60.0%
50.0% $8.0
40.0%
$7.5
30.0%
$7.0
20.0%
36.2%
25.5% $6.5
10.0%
16.5%
2.7% 10.1%
4.5%
$6.0
2021 2022 2023 2024 2025 2026 & Beyond
Expiry Rent Expiring
Balancing Occupancy with Higher Expiry Rents In 2022
21SINGAPORE
RETAIL PORTFOLIO
PERFORMANCE
22Suntec City Mall & MBLM – Occupancy & Work Done
Committed Occupancy Portfolio Work Done2 YTD 21: 221,300 sq ft
(58% are renewal leases)
Secondary
market
occupancy
93.2%1
New
91,900 sq ft Renewal
95.0% 92.2% 94.9%
129,400 sq ft
Suntec City Mall Marina Bay Link Mall Overall
Notes:
1. Source: JLL as at 2Q 2021
2. Reflects net lettable area of new leases and renewals committed based on Suntec REIT’s interests in Suntec City Mall, Suntec Singapore (Retail) and Marina Bay
Link Mall.
23Suntec City Mall & MBLM Lease Expiry
% of Total NLA1 Q-o-Q Comparison
22.6% 22.6%
21.9% 21.5%
21.8% 24.9%
13.6% 15.4%
6.2%
7.2% 7.2%
5.1%
7.8%
2.2%
2021 2022 2023 2024 2025 2026 & Beyond
Vacant NLA Expiries as at 2Q 21 Expiries as at 3Q 21 WALE 2.48 Years
FY2026 &
FY2021 FY2022 FY2023 FY2024 FY2025
Beyond
Sq ft 19,698 206,017 206,481 227,393 65,608 140,553
% 2.2% 22.6% 22.6% 24.9% 7.2% 15.4%
Well Spread Lease Expiry Provides Re-Positioning Opportunity
Note:
1. Based on Suntec REIT’s interests in Suntec City Mall, Suntec Singapore (Retail) and Marina Bay Link Mall.
24Suntec City Mall – Leasing Activity
• Excluding anchor leases, YTD 21 and 3Q 21 rent reversion will
both be -10%
Rent Reversion • Despite COVID-19 disruptions, 19 new-to-market or new-to-
Suntec brands were introduced in 2021
YTD 21 –14.6% • ~50% of these were to cater to Singaporeans’ desire for new
1Q 21 2Q 21 3Q 21 F&B concepts
-26.1% -7.2% -11.2%
• 35% of mall’s NLA will be occupied by activity-based and
experiential concepts
• Together with >25% of NLA for F&B, Suntec City mall will
strengthen its position as destination of choice
Future-Proofing of Suntec City Mall to Better Retain and Attract Customers
New and upcoming store openings:
25Suntec City Mall – Footfall and Tenant Sales
• Tenant sales continue to recover faster than footfall increase
• Recovery picked up pace in August following the announcement of ‘Preparatory Stage’
Tenant Sales and Footfall YOY Trend against 2019
0%
Oct Nov Dec Jan Feb Mar Apr May Jun Jul Aug Sep
1Q: -8%
2Q: -31%
-20% 3Q: -24%
1Q: -19%
2Q: -34%
3Q: -33%
-40% Phase 3 1Q: -34%
(28 Dec) 2Q -49%
3Q: -51%
P2HA
P3HA (22 Jul)
-60% P2HA (14 Jun)
(16 May)
-80%
Tenant Sales (Whole mall) Tenant Sales (Same store basis) Footfall
Continued Recovery of Footfall & Tenant Sales in 3Q 21
26AUSTRALIA & UK PORTFOLIO PERFORMANCE
Australia Committed Occupancy

Nationwide
   CBD
  Office
Occupancy
  86.0%1

                                                                   95.2%        98.3%
                 93.8%                              91.7%                                       92.8%
                                                                                                                  85.6%
                                    80.7%

              177 Pacific          21 Harris   Southgate Office   55 Currie   477 Collins   Australia Office Southgate Retail
               Highway             Street 2                        Street 2    Street 2         Overall

                                       Healthy Occupancy Across Australia Office Portfolio

     Notes:
     1. Source: JLL as at 2Q 2021
     2. Rent guarantee on vacant spaces.

                                                                                                                                28
Australia Portfolio Lease Expiry
% of Total NLA1 Q-o-Q Comparison
52.5%
49.4%
28.4%
24.7%
6.2% 7.4%
3.2% 4.4% 4.8% 4.1% 5.3%
2.7% 2.3% 2.5%
1.6% 0.5%
2021 2022 2023 2024 2025 2026 2027 &
Beyond
Vacant NLA Expiries as at 2Q 21 Expiries as at 3Q 21 WALE 5.79 Years
FY2027 &
FY2021 FY2022 FY2023 FY2024 FY2025 FY2026
Beyond
Sq ft 8,414 37,978 405,042 40,056 79,134 86,583 859,132
% 0.5% 2.3% 24.7% 2.5% 4.8% 5.3% 52.5%
Minimal Lease Expiries in 2021 & 2022
Notes:
1. Based on Suntec REIT’s interests in 177 Pacific Highway, 21 Harris Street, Southgate Complex (Office and Retail), 477 Collins Street and 55 Currie.
2. 3.5% of NLA is covered by rent guarantees (55 Currie Street, 21 Harris Street and 477 Collins Street).
29UK Portfolio Summary
Committed Occupancy Lease Expiry
% of Total NLA3 Q-o-Q Comparison
Central 100.0% 98.0%
London
Office
Occupancy
91.9%1
100.0% 96.7% 98.3%
1.7% 0.3%
Nova Minster Building 2 UK Overall 2021 2022 2024 -2026 2027 &
2023
Properties Beyond
Vacant NLA2 Expiries as at 2Q 21 Expiries as at 3Q 21
Occupancy Outperformed Market Level Long WALE of 10.9 Years
Notes:
1. Source: JLL as at 2Q 2021
2. Rent guarantee on vacant spaces.
3. Based on Suntec REIT’s interests in Nova Properties and Minster Building.
30LOOKING AHEAD
Singapore Office Portfolio

          • Return of workforce likely to increase from current level if situation stabilises

          • Singapore GDP growth expected to stay robust with progressive easing of border
            restrictions

          • Strong recovery of FDI in Singapore expected to drive employment with demand for real
            estate moving in tandem

          • Leasing activities driven by expansionary requirements and relocation from buildings
Outlook
            undergoing redevelopment/asset enhancement

          • Market rent recovery to continue, supported by limited new supply and demand from
            growth sectors - TMT, financial services and health-care related

          • Positive rent reversion expected for full year 2021

          • Revenue growth expected from higher occupancy and cumulative positive rent
            reversions for the past 13 quarters

                                                                                                   32
Suntec City Mall
• Footfall performing slightly better during the first 2 weeks of ‘Stabilisation Phase’ in Oct vs.
earlier periods with similar restrictions
• Footfall and tenant sales unlikely to be too affected by vaccination-differentiated Safe
Management Measures (SMM)
• Cautious optimism on the continued recovery of footfall and tenant sales
• Vast majority of tenants will receive additional rent assistance for 2nd P2HA period; total
Outlook assistance over both P2HA periods will exceed mandatory 0.5 months
• Rent reversion to remain weak due to uncertainty in operating environment and
cautious sentiments of retailers
• Mall occupancy on track to remain around 95% by end 2021
• Revenue recovery will be supported by higher occupancy and higher GTO rents, but
slowed by negative rent reversions from past few quarters
33Suntec Convention
• Recovery slow due to weak international business and leisure travel
• Domestic market key driver for recovery, aided by easing of restrictions on larger-scale
events in tandem with high vaccination rates
• Increased number of Vaccinated Travel Lanes (VTLs) aid recovery; but more VTLs from
different parts of the world, especially in Asia required
• Physical-virtual hybrid events a mainstay for MICE business
• Pent up demand for local consumer shows, dining events
Outlook
• Working closely with government agencies to host larger-scale pilot events
• Capturing new revenue streams to diversify business
• 100% of staff fully vaccinated, undergoing regular testing - a competitive advantage for
“fully vaccinated” events
• Investment in SMM infrastructure to better position as the MICE destination of choice
• Income contribution remains significantly impacted
34Australia Portfolio
• Extended lockdowns in Sydney and Melbourne dampened economic recovery
• Return of workforce in Adelaide about 70%; majority in Sydney/Melbourne not expected
to return until early 2022
• Nationwide CBD office vacancy of 14.0%1 expected to increase further
• Flexible remote working arrangement to remain; ‘flight to quality’ continues benefitting
new Grade A properties like 21 Harris Street and 477 Collins Street with occupancies
strengthening
Outlook
• Balance vacant spaces at 21 Harris Street and 477 Collins Street, protected by rent
guarantee
• CBD retail in Melbourne continues to be challenging with slow return of workforce
• Rent rebates or turnover-only rent structure for retail tenants (impacting less than 5% of
AU portfolio revenue)
• Revenue resilient underpinned by strong office occupancy, annual rent escalations and
long WALE with minimal lease expiries in 2021 and 2022
Note:
1. Source: JLL as at 2Q 2021
35United Kingdom
• Return to work at about 50% since lockdown ended in April ; hybrid work arrangement
remains
• Leasing activity continues to improve, with active demand in West End and City of
London recovering to pre-COVID levels, driven by TMT and Banking & Finance sectors
• High quality office buildings located near London’s key transport hubs remain well
Outlook
sought after
• Office revenue resilient underpinned by high occupancy, long WALE and no lease expiry
until 2027
• Retail income supported by 2-year guarantee; improvements in tenant sales expected
with further easing of restrictions
36Positioning For Recovery
1 Proactive Lease Management to Enhance Resilience of Properties
Strengthen Balance Sheet through Active Capital
2 Management
Further Enhance Suntec REIT’s Income Stability by Sourcing for
3 Good Quality Assets that are Accretive
4 Deliver Sustainable Returns and Long Term Value to Unitholders
37THANK YOU
38Contact
Melissa Chow
Manager, Investor Relations
melissachow@ara-group.com
5 Temasek Boulevard,
Tel: +65 6835 9232 www.suntecreit.com
#12-01, Suntec Tower 5
Fax: +65 6835 9672 www.ara-group.com
Singapore 038985
39About Suntec REIT
Singapore’s first composite REIT
S$4.0 Billion1
Market Capitalisation
London
S$11.6 Billion2
Assets Under Management
• Listed on 9 Dec 2004 on the SGX-ST
• High quality office assets,
complemented by retail and
Singapore convention components
• 10 properties – 3 in Singapore, 2 in
Adelaide Sydney, 2 in Melbourne, 1 in
Adelaide and 2 in UK
Sydney
Notes:
1. Based on 30/9/21 closing price of $1.42
Melbourne 2. Based on exchange rates of S$0.9825=A$1.00 and
S$1.8513=£$1.00 as at 30 Sep 2021
40Portfolio Snapshot
Suntec City
One Raffles MBFC
Quay Properties
Suntec City – Suntec Convention
Office & Retail
Description Integrated commercial World-class convention Two premium Two premium
development comprising and exhibition centre Grade A office Grade A office
five office towers and one towers towers and a
of Singapore largest retail subterranean mall
mall
Ownership 100% 66.3% 33.33% 33.33%
City/Country Singapore Singapore Singapore Singapore
Segment Office Retail Convention Office Office Retail
NLA1 (sq ft) Office:~1.3 mil ~430,000 ~440,000 Office:~546,000
Retail:~0.9 mil Retail:~32,000
Valuation Office: S$2,917.1 mil S$179.0 mil S$1,247.3 mil S$1,682.0 mil
Retail: S$2,225.4 mil
Cap rate Office: 3.75% 6.00% 3.625% Office: 3.625%
Retail: 4.75% Retail: 4.50%
Note:
1. Based on Suntec REIT’s interests in the respective properties.
41Portfolio Snapshot
177 Southgate Olderfleet 55 Currie 21 Harris Street Nova The Minster
Pacific Complex 477 Street Properties Building
Highway Collins Street
Description 31-storey Integrated Premium Twelve-storey, Nine-storey, Two Grade A Grade A
Grade A office development Grade, 40- Grade A Grade A Office Office building
building comprising two level state- office building office building buildings with
A-Grade office of-the-art ancillary retail
towers and a building development
retail podium
Ownership 100% 50% 50% 100% 100% 50% 100%
City/ Sydney, Melbourne, Melbourne, Adelaide, Sydney, London, London,
Country Australia Australia Australia Australia Australia UK UK
Segment Office Office Retail Office Office Office Office Office
NLA1 (sq ft) ~431,000 Office:~355,000 ~315,000 ~282,000 ~203,000 ~280,000 ~293,000
Retail:~53,000
Valuation A$645.0 mil A$385.5 mil A$445.0 mil A$150.0 mil A$300.0 mil £436.0 mil £370.0 mil
Cap rate 5.00% Office: 5.25% 4.63% 6.75% 5.13% 4.73% 4.40%
Retail: 5.75%
Note:
1. Based on Suntec REIT’s interests in the respective properties.
42Disclaimer
This presentation is focused on the comparison of business updates for the quarter ended 30 September 2021 versus the quarter
ended 30 September 2020.
The information included in this release does not constitute an offer or invitation to sell or the solicitation of an offer or invitation
to purchase or subscribe for units in Suntec REIT (“Units”) in Singapore or any other jurisdiction.
This presentation may contain forward-looking statements that involve assumptions, risks and uncertainties. Actual future
performance, outcomes and results may differ materially from those expressed in forward-looking statements as a result of a
number of risks, uncertainties and assumptions. Representative examples of these factors include (without limitation) general
industry and economic conditions, interest rate trends, cost of capital and capital availability, competition from other
developments or companies, shifts in the expected levels of occupancy rates, property rental income, changes in operating
expenses, property expenses and governmental and public policy changes and the continued availability of financing in the
amounts and the terms necessary to support future business. Past performance is not necessarily indicative of future
performance. Predictions, projections or forecasts of the economy or economic trends of the markets are not necessarily
indicative of the future or likely performance of Suntec REIT. You are cautioned not to place undue reliance on these forward-
looking statements, which are based on the current view of management on future events.
IMPORTANT NOTICE
1. The value of Units and the income derived from them, if any, may fall or rise. Units are not obligations of, deposits in, or
guaranteed by, ARA Trust Management (Suntec) Limited (as the manager of Suntec REIT) (the “Manager”) or any of its affiliates.
An investment in Units is subject to investment risks, including the possible loss of the principal amount invested.
2. Investors should note that they will have no right to request the Manager to redeem or purchase their Units for so long as the
Units are listed on the SGX-ST. It is intended that holders of Units may only deal in their Units through trading on the SGX-ST. The
listing of the Units on the SGX-ST does not guarantee a liquid market for the Units.
3. The past performance of Suntec REIT is not necessarily indicative of the future performance of Suntec REIT.
43You can also read