Freezing Tolerance and Chilling Fulfillment Differences in Cold Climate Grape Cultivars - MDPI
←
→
Page content transcription
If your browser does not render page correctly, please read the page content below
horticulturae

Article
Freezing Tolerance and Chilling Fulfillment Differences in Cold
Climate Grape Cultivars
Turhan Yilmaz, Dilmini Alahakoon and Anne Fennell *

                                           Agronomy, Horticulture and Plant Science, South Dakota State University, Brookings, SD 57007, USA;
                                           turhan.yilmaz@jacks.sdstate.edu (T.Y.); dilmini.alahakoon@sdstate.edu (D.A.)
                                           * Correspondence: anne.fennell@sdstate.edu

                                           Abstract: Grapevine sustainability is impacted by the timing of dormancy initiation and freezing
                                           tolerance in fall and winter and chilling fulfillment and bud break in the spring. These traits have
                                           genetic and local temperature contributing factors; therefore, this study was undertaken to develop
                                           an understanding of these characteristics in four recently developed cold climate cultivars. The cold
                                           hardiness and chilling fulfillment profiles were monitored in Brianna, Frontenac gris, La Crescent
                                           and Marquette using differential thermal analyses and bud break assays. Bud cold hardiness of all
                                           cultivars increased with the declining temperatures from November through February, after which
                                           the buds began to lose freezing tolerance. There were significant differences in cold hardiness and
                                           chilling fulfillment between cultivars during the endodormant and ecodormant period of winter.
                                           Marquette had the greatest freezing tolerance from early November through midwinter suggesting it
                                           has potential as a sentinel cultivar for comparisons of new cold climate selections. Brianna was slower
                                           to acclimate and deacclimated more rapidly than the other cultivars. Chilling fulfillment under
                                           natural field or constant 4 ◦ C conditions showed no main effect differences for chilling accumulation
                                           condition; however, there were significant cultivar, condition, and time point interactions, indicating
                                           the cultivars differed in chilling fulfillment responses.

                                 Keywords: differential thermal analysis (DTA); bud break; chilling fulfillment; acclimation; deaccli-

                                           mation; interspecific grape cultivars
Citation: Yilmaz, T.; Alahakoon, D.;
Fennell, A. Freezing Tolerance and
Chilling Fulfillment Differences in
Cold Climate Grape Cultivars.
                                           1. Introduction
Horticulturae 2021, 7, 4. https://
doi.org/10.3390/horticulturae7010004            Freezing injury is one of the most problematic issue impacting production of grapevine
                                           in Northern regions of the United States [1–3]. The freezing tolerance of grapevine species
Received: 12 November 2020                 and cultivars varies considerably with Vitis riparia having the greatest reported tolerance
Accepted: 22 December 2020                 of −40 ◦ C [4,5]. The cultivars belonging to V. vinifera, have high grape quality; however,
Published: 30 December 2020                their winter freezing tolerance is reported to range between −10 ◦ C and −26 ◦ C [1,6,7].
                                           Introduction of new cultivars since the 1980s, developed from complex interspecific hybrids
Publisher’s Note: MDPI stays neu-          of V. vinifera, V. riparia and V. labrusca, has resulted in new grape and wine production
tral with regard to jurisdictional clai-   in the regions of the North Central and North Eastern states in the USA and Southern
ms in published maps and institutio-       Canada [8,9]. These cold hardy wine grapes have been reported to survive temperatures
nal affiliations.                          from −25 ◦ C to −38 ◦ C in these regions; however, other reports indicate freezing injury
                                           can occur under less severe temperatures depending on the timing of the freeze event and
                                           the dormancy status of the vines [10]. South Dakota has winter temperatures that can
Copyright: © 2020 by the authors. Li-
                                           reach −30 ◦ C in some years [11]; however, it is noted that freezing injury can also occur in
censee MDPI, Basel, Switzerland.
                                           years with warmer winter temperatures. Typically, as temperatures decrease in fall and
This article is an open access article
                                           winter, the dormant buds survive increasingly negative temperatures, maintaining freezing
distributed under the terms and con-       tolerance at low mid-winter temperatures and then begin to deacclimate and lose freezing
ditions of the Creative Commons At-        tolerance with increasing temperatures and chilling fulfillment [7,12,13]. Temperature
tribution (CC BY) license (https://        conditions can fluctuate widely on a daily and weekly basis in a continental climate with
creativecommons.org/licenses/by/           potential sudden temperature drops after warming periods, which may contribute to
4.0/).                                     freezing injury early or late in winter season.

Horticulturae 2021, 7, 4. https://doi.org/10.3390/horticulturae7010004                                  https://www.mdpi.com/journal/horticulturae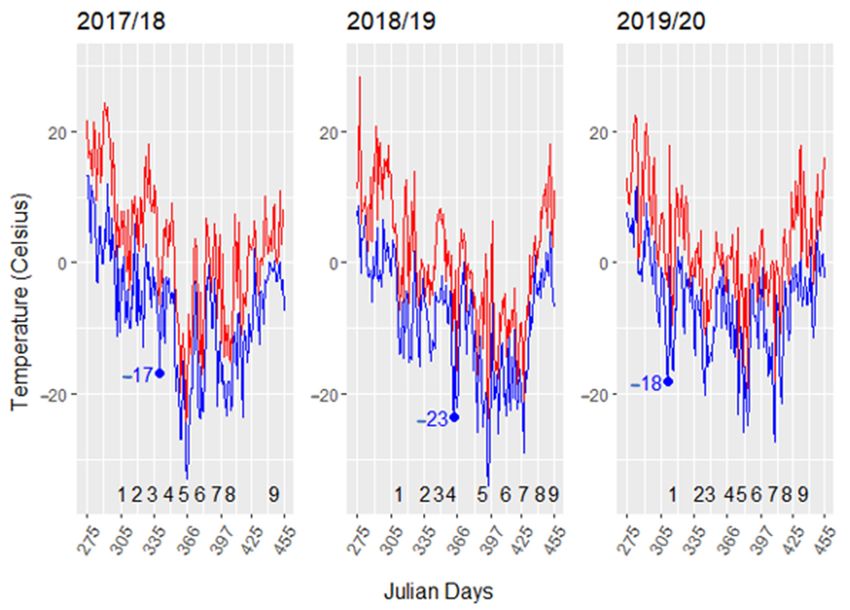
Horticulturae 2021, 7, 4                                                                                             2 of 11

                                 Freezing tolerance is dynamic, rather than a fixed character in each cultivar and is
                           affected by temperature fluctuations and bud dormancy status during the winter sea-
                           son [8,14]. Bud dormancy is typically divided into three stages with internal and external
                           factors controlling the stage, paradormant (correlative inhibition during the growing sea-
                           son), endodormant (growth restriction factors are within the bud), and ecodormancy
                           (chilling fulfilled, growth is limited by environmental conditions) [15]. The timing of sub-
                           zero temperatures, intermittent winter warming temperatures, and the dormancy status of
                           the buds may affect potential bud freezing damage. Sudden subzero temperature drops in
                           early fall, as buds are entering dormancy, or in the spring when bud chilling requirement
                           is fulfilled, can be damaging [8,16]. The transition from endodormancy to ecodormancy
                           is driven by a genotype specific amount of exposure to hours of low temperature (0 to
                           7 ◦ C) needed to achieve chilling fulfillment [17] and transition the vine to ecodormancy,
                           followed by bud break with the increasing spring temperature [15]. Bud break assays
                           can be used to estimate chilling requirement; however, these measures are frequently con-
                           founded with winter injury in grapevines [1]. Under non-injurious conditions, V. vinifera
                           cultivars typically require 50–400 chilling hours (0 to 7 ◦ C) while other species range be-
                           tween 250–2250 h [14]. To select cultivars suited for a region’s climatic conditions, it is
                           important to understand the interaction of chilling fulfillment and rate of bud break [14].
                           In regions with early warming periods, it is important to maintain vine dormancy to avoid
                           frost damage in the spring [14,18]. Cultivars with a greater chilling fulfilment requirement
                           and slower deacclimation rates would be useful for avoiding spring freezes in a changing
                           climate [16]. Sustainability of grapevines is dependent on the interaction of the grapevine’s
                           response to local temperatures during acclimation and deacclimation periods, as well as
                           the extreme winter low temperatures in a year. Therefore, the objective of this study was to
                           provide baseline information on four interspecific grape cultivars freezing tolerance and
                           chilling fulfillment patterns throughout the dormancy cycle in South Dakota, USA.

                           2. Materials and Methods
                           2.1. Plant Materials
                                 Four cultivars with complex interspecific pedigrees were examined (Vitis International Va-
                           riety Catalogue (VIVC) [19] variety number is listed in parenthesis: Brianna (VIVC 23260) [20],
                           Frontenac gris (VIVC 23928) [21], La Crescent (VIVC 17632) [22], and Marquette (VIVC
                           22714) [23]. Cane samples of the grape cultivars were collected from bearing vines trained
                           with bilateral low cordons and vertical shoot positioning at Tucker’s Walk commercial vine-
                           yard in Garretson, SD (lat. 43◦ 430 2.901” N, long. 96◦ 300 10.155” W) in USDA Plant Hardiness
                           Zone 4b [24]. Canes were collected bi-weekly from 2 November 2017 to 23 March 2018 (year 1)
                           and 7 November 2018 to 3 April 2019 (year 2) and 12 November 2019 to 11 March 2020 (year 3).
                           Sample days are noted in Julian days for each dormancy season starting from 1 January of a
                           given year through the next spring (next calendar year). Vines were sampled randomly across
                           the vineyard cultivar block for each sampling time. A random cane (containing nodes 5–10
                           numbered from cane origin/base) was collected from each of five vines for one replicate. A to-
                           tal of five replicates were tested for freezing tolerance and dormancy status for each cultivar
                           at each sampling time. To monitor controlled chilling fulfillment, 45 additional canes (one
                           per vine, containing nodes 5–10 from cane origin/base) were collected from vines distributed
                           across each cultivar block, on the first field sample date in November. Controlled chilling
                           canes were cut into single nodes and nodes from each cane were placed in ziplock bags at
                           4 ◦ C to fulfill chilling requirement.

                           2.2. Low Temperature Exotherms
                                Bud low temperature exotherms (LTEs) were determined using differential thermal
                           analysis with a Keithley Multimeter Data Acquisition System (model 2700-DAQ-40; Keith-
                           ley Instruments, Cleveland, OH, USA), a programmable freezer (Tenney Environmental
                           Test Chamber, model T2C, Thermal Product Solutions, Williamsport, PA, USA) and thermo-
                           electric modules (TEM) constructed as previously described by Mills et al. [7]. Five buds
Horticulturae 2021, 7, 4 3 of 11
(one from each of the individual canes) were placed in a TEM and five replicates (five buds
in each of five TEMs) were used for each cultivar. Temperature program was as described
by Mills et al. [7] (1 h at 4 ◦ C, followed by 4 ◦ C/h temperature decline to −40 ◦ C). LTEs rep-
resenting the bud killing temperature were identified for each replicate [7,13].
2.3. Dormancy Status
Dormancy status was monitored for field collected and control chilled buds at
two-week intervals using forcing assays. Dormancy status/bud break capacity was
determined by placing a five cm long node section (sixth node from cane origin/base)
in water at 22 ◦ C and 24-h day length (n = 5). Bud phenological stage was monitored
weekly using the modified E-L grapevine growth stage and E-L stage 4 (green tip visible)
was considered bud break [25]. Chilling was considered fulfilled when 50% of bud
reached E-L stage 4 within 4 weeks [14]. After four weeks, buds that did not break were
cut longitudinally to determine viability (green = alive, brown = dead). Chilling hours
were calculated as hours of exposure to temperatures between 0 ◦ C and 7 ◦ C in field
or controlled conditions [26]. Chilling hour accumulation for the field condition was
calculated from 1 October to the sample time by using hourly temperature data from
the Garretson station of South Dakota Mesonet [11]. Chilling hour accumulation for
the controlled chilling treatment was calculated by adding the field chilling hours from
1 October to the collection date for controlled treatment and adding hours accumulated
in 4 ◦ C controlled refrigeration cooler (24 chilling hours/day) until sample date for bud
break assay. The buds in controlled chilling treatment accumulated chilling hours more
quickly than under field conditions; therefore, four accumulated chilling hour groups
(200–500, 501–700, 701–900 and >901 (922 to 1538 and 917 to 1629 chilling hours in field
and controlled conditions, respectively) were used to compare the field and controlled
condition responses. The resulting experimental design was a three-way factorial with
two chilling treatments, four cultivars and four chilling periods.
2.4. Statistical Analysis
2.4.1. Freezing
Descriptive analysis was conducted using psych library in R [27]. Correlation analysis
was performed between cultivar LTEs and mean minimum temperature of the week prior
to sample collection using stats library in R [28]. Influence of cultivar, sampling time
(in Julian days), dormant season, and their interaction effects on LTEs were assessed by a
linear model (lm function) applied in the stats package in R software [28]. Seven models
(one model for each of the three seasons, two models for first two seasons, two models for
all seasons) were built to check cultivar, sampling time, season main effect, and cultivar
by sampling time, cultivar by season or cultivar by sampling time and season interactions.
The most appropriate model to describe the current experimental data was selected by
model adequacy. In addition, each model’s residual was checked for normality assumptions.
Freezing tolerance plots were plotted using ggplot2 in R [29].
2.4.2. Dormancy Status
Chilling fulfillment descriptive analysis was performed using psych library in R [27].
The effect of cultivar (4), chilling accumulation method (natural or controlled), chilling
hour accumulation group (200–500, 501–700, 701–900, and >901 chilling hours), season (3)
and their interactions on bud break growth stages were assessed by ANOVA using stats
package in R [28]. A model that included all main effects and interaction effects was tested
for normality assumptions.
3. Results
3.1. Dormant Season Temperature Variation 2017–2020
The three winter seasons had different low temperature severity (Figure 1). The 2017/18
to 2018/19 dormant seasons show wide fluctuation minimum hourly temperatures in Garret-normality assumptions.
3. Results
3.1. Dormant Season Temperature Variation 2017–2020
Horticulturae 2021, 7, 4 The three winter seasons had different low temperature severity (Figure 1).4 of 11
The
2017/18 to 2018/19 dormant seasons show wide fluctuation minimum hourly tempera-
tures in Garretson, SD. The 2017/18 and 2018/19 winters were similar with the exception
that
son, the
SD. lowest temperatures
The 2017/18 occurred
and 2018/19 laterwere
winters in 2018/19. Temperatures
similar with below
the exception that−15
the°C typi-
lowest
cally do not occur until late November or early December in South
◦ Dakota,
temperatures occurred later in 2018/19. Temperatures below −15 C typically do not occur as noted by
the first temperature below −15 °C in 2017/18 and 2018/19 temperatures (7
until late November or early December in South Dakota, as noted by the first tempera- December 2017,
Julian day −
ture below 342
15 and 292017/18
◦ C in December and2019,
2018/19Julian day 364). However,
temperatures (7 December in 2017,
2019/2020
Julianaday
−18342
°C
occurred very early
and 29 December (7 November
2019, Julian day2019,
364).Julian day 312).
However, In this three-
in 2019/2020 a −year
18 ◦ Cperiod, the very
occurred low-
est temperatures occurred most frequently in January and the March temperatures
early (7 November 2019, Julian day 312). In this three- year period, the lowest temperatures were
the most most
occurred variable ranginginfrom
frequently −11 to
January −29the
and °C.March
Meantemperatures
monthly temperatures
were the mostwerevariable
similar
for the three seasons, ◦
emphasizing the need to track daily temperatures (Supplementary
ranging from −11 to −29 C. Mean monthly temperatures were similar for the three seasons,
Table S1). the need to track daily temperatures (Supplementary Table S1).
emphasizing
1. Dormant
Figure 1. Dormant season
seasontemperatures
temperaturesfor
for2017
2017toto2020.
2020.TheThedaily
dailymaximum
maximum and minimum
and minimum temperatures areare
temperatures indicated by
indicated
by red
red andand
blueblue lines,
lines, respectively.
respectively. Numbers
Numbers from from
1 to 19 to 9 indicate
indicate tissue
tissue sampling
sampling timetime in each
in each dormant
dormant season.
season. The The
blueblue
dot
dot indicates
indicates the first
the first datedate
thatthat
the the minimum
minimum temperature
temperature waswas below
below −15 ◦C
−15 °Cinineach
eachdormant
dormantseason.
season.The
Thefirst
firstday
day of
of each
each
month for
month for aa dormant
dormant season
season (November
(November through
through April)
April) are
are 305,
305,335,
335,366,
366,398,
398,426,
426,and
and457
457Julian
Juliandays,
days,respectively.
respectively.
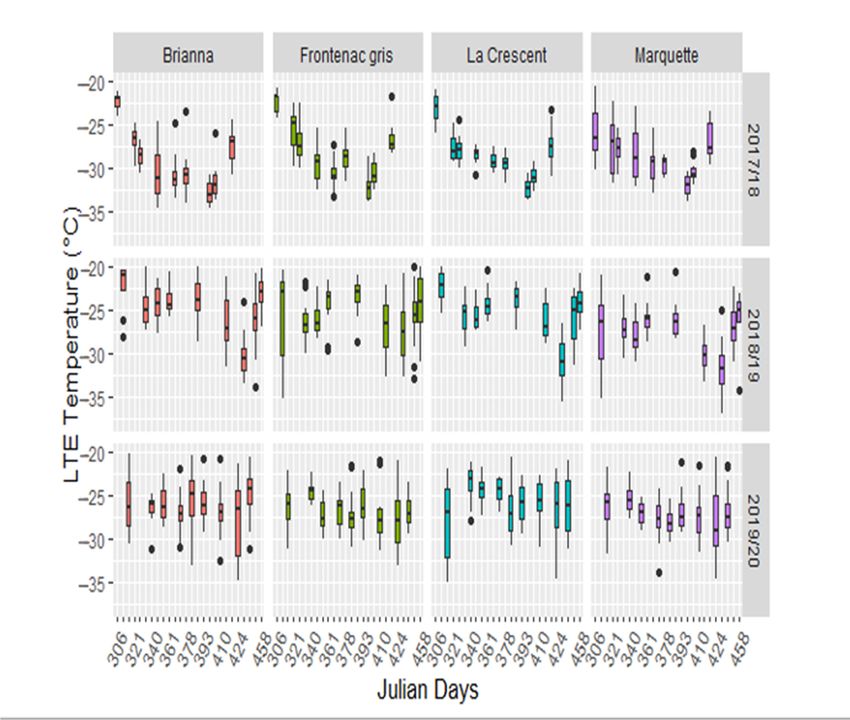
3.2. Bud Freezing Tolerance Differs between Seasons and Cultivars
3.2. Bud Freezing Tolerance Differs between Seasons and Cultivars
Cultivar, sampling time, season, and cultivar by sampling time interactions were sig-
Cultivar,
nificant sampling time,
(Supplementary Tableseason, and
S2). The cultivar
cultivar by sampling
LTEs time
were lower in interactions
2017/18 thanwere
the
2018/19 and 2019/20 dormant seasons (Figure 2). The earlier colder temperatures inthan
significant (Supplementary Table S2). The cultivar LTEs were lower in 2017/18 the
2017/18
2018/19 and 2019/20 dormant seasons (Figure 2). The earlier colder temperatures in
2017/18 winter season are reflected in lower LTEs in all cultivars (Supplementary Table S3).
Minimum LTEs varied by the winter season, occurring 29 January in 2017/18, 3 March in
2018/19 and 28 February in 2019/20. Buds began to deacclimate after January in 2017/18
and in mid-March in 2018/19 and 2019/20 (Figure 2, Supplementary Table S3). Brianna
and Marquette had consistently lower LTEs in mid-winter than other cultivars; however,
Brianna appeared to deacclimate more rapidly with higher LTEs in March (Supplementary
Table S3). Marquette had greater over all freezing tolerance with a consistently lower mean
LTEs in November and March than the other cultivars (Figure 2, Supplementary Table S3).and 28 February in 2019/20. Buds began to deacclimate after January in 2017/18 and in mid-
March in 2018/19 and 2019/20 (Figure 2, Supplementary Table S3). Brianna and Marquette
had consistently lower LTEs in mid-winter than other cultivars; however, Brianna appeared
to deacclimate more rapidly with higher LTEs in March (Supplementary Table S3). Mar-
Horticulturae 2021, 7, 4 quette had greater over all freezing tolerance with a consistently lower mean LTEs in
5 ofNo-
11
vember and March than the other cultivars (Figure 2, Supplementary Table S3).
Figure 2. Low temperature exotherms for Brianna, Frontenac gris, La Crescent, and Marquette across the 2017/18, 2018/19
Figure 2. Low temperature exotherms for Brianna, Frontenac gris, La Crescent, and Marquette across the 2017/18, 2018/19
and
and2019/20
2019/20 dormant
dormant seasons.
seasons.
The LTEs showed a parallel profile to the minimum temperatures in 2017/18 and
The LTEs showed a parallel profile to the minimum temperatures in 2017/18 and
2018/19. In 2018/19, the lowest temperatures and lowest LTEs were skewed towards Febru-
2018/19. In 2018/19, the lowest temperatures and lowest LTEs were skewed towards Feb-
ary in contrast to 2017/18 (Figures 1 and 2). There was little change in LTEs throughout
ruary in contrast to 2017/18 (Figures 1 and 2). There was little change in LTEs throughout
2019/20 after the early −18 ◦ C freezing temperature. There were significant correlations
2019/20 after the early −18 °C freezing temperature. There were significant correlations
between cultivar LTEs and the mean minimum temperature of the seven days prior to
between cultivar LTEs and the mean minimum temperature of the seven days prior to
sampling in 2017/18 and 2018/19 (Table 1). There were no significant correlations between
sampling in 2017/18
temperature and LTEs and
in 2018/19 (Table
the 2019/20 1). There
season were
(Table 1).no significant
The early −18correlations between
◦ C temperature in
the 2019/20 season resulted in bud damage that occurred before sample collectionin
temperature and LTEs in the 2019/20 season (Table 1). The early −18 °C temperature the
was
started; thereby, limiting the cultivar LTEs fluctuation with local temperature. Minimum
temperature and LTEs correlations were strongest for the 2017/18 season in all cultivars,
when tested across seasons the correlations decrease and are significantly impacted by the
2019/20 year. Modeling the contribution of cultivar, sampling time, season, and their inter-
actions showed the complexity of grapevine bud freezing tolerance and its interactions with
environmental changes (Table 2). All models showed significant environment (sampling
time or season) main effects. Complex models showed significant cultivar environment
interactions and increased model complexity did not violate normality assumptions. Cul-
tivar was a significant contributor to LTEs in 2017/18 and 2018/19, but not in 2019/20
(Table 2, models 1–3), suggesting that primary bud damage occurred with the early −18 ◦ CHorticulturae 2021, 7, 4 6 of 11
in 2019/2020. Comparison of complex models (cultivar, sampling time, season, and cultivar
by sampling time and/or season interactions) for the first two seasons with that of all three
seasons further supports presence of earlybud damage, as cultivar was not a significant
contributor when all three seasons were included (Table 2, bottom row). This indicated that
timing of acclimation initiation as well as extreme low temperatures early in the dormant
season are important factors in freezing tolerance.
Table 1. Pearson correlation coefficient between cultivar low temperature exotherms and mean seven-
day minimum temperature prior to sampling in 2017/18, 2018/19, and 2019/20 winter seasons.
Cultivar 2017/18 2018/19 2019/2020 All Seasons
Mean across cultivars 0.46 * 0/28 * 0.05 0.23 *
Brianna 0.45 * 0.45 * 0.06 0.27 *
Frontenac gris 0.52 * 0.08 * 0..11 0.18 *
La Crescent 0.45 * 0.40 * 0.01 0.25 *
Marquette 0.43 * 0.28 * 0.05 0.25 *
*, Significant at p-value < 0.05.
Table 2. Modeling cultivar, sampling time, season, and cultivar by sampling time and/or season interaction contributions
to the low temperature exotherms.
Factors in ANOVA
Season(s)
Season Cultivar Sampling Time Cultivar × Sampling Time Cultivar × Season
2017/18 NA * * * NA
2018/19 NA * * * NA
2019/20 NA NS * * NA
2017/18 + 2018/19 * * * * NA
2017/18 + 2018/19 * * * * *
2017/18 + 2018/19 + 2019/20 * * * * NA
2017/18 + 2018/19 + 2019/20 * NS * * *
*, Significant at p-value < 0.05; NA, not included in the model; NS, not significant at p-value < 0.05.
3.3. Bud Dormancy Release Showed Significant Cultivar by Treatment or Season Interactions
The controlled and natural field chilling conditions showed similar bud break phe-
nology across cultivars in each chilling hour accumulation group and the major effect
of chilling condition was not significant (Figure 3, Supplementary Table S4). Cultivar
differences in bud break stage are noted for the four chilling periods (200–500, 501–700,
701–900, >901). The main effects for cultivar, chilling hour accumulation group, and season
were significant. The two-way interaction effects of cultivar, chilling hour accumulation
group, and the season and chilling condition and the cultivar and season interactions were
significant indicating cultivar and seasonal components (Supplementary Table S4). Brianna
required lower chilling hour accumulation as evidenced by the advanced E-L phenology
stage in comparison to other cultivars (Table 3). Frontenac gris and La Crescent chilling
fulfillment response was similar and intermediate to Brianna and Marquette. Freezing
injury to the primary bud meristem can cause delay in bud break and it is noted that La
Crescent had a lower bud break phenology stage under natural conditions (Table 3) as
well as less negative mean LTEs (Supplementary Table S4), suggesting a delayed break
in response to freezing injury. In this study the specific impact of prior freezing damage
to primary buds, resulting in delays in bud break, could not be definitively determined
as emerging shoots were not differentiated as arising from the primary or secondary bud
meristems in the assay.Freezing injury to the primary bud meristem can cause delay in bud break and it is noted
that La Crescent had a lower bud break phenology stage under natural conditions (Table
3) as well as less negative mean LTEs (Supplementary Table S4), suggesting a delayed
break in response to freezing injury. In this study the specific impact of prior freezing
Horticulturae 2021, 7, 4
damage to primary buds, resulting in delays in bud break, could not be definitively7 of
de-
11
termined as emerging shoots were not differentiated as arising from the primary or sec-
ondary bud meristems in the assay.
Figure 3.
Figure Cultivar bud
3. Cultivar bud break
break changes
changes in
in response
response to
to similar
similar chilling
chilling hour
hour groups
groups in
in controlled
controlled and
and natural
natural chilling
chilling hour
hour
accumulation conditions
accumulation conditions in 2017/18,
2017/18,2018/19,
2018/19,and
and2019/20
2019/20 dormant
dormant seasons.
seasons.
Table phenology stage
Table 3. Bud phenology stagedetermined
determinedafter
after44weeks
weeksforcing
forcingfor
forBrianna,
Brianna, Frontenac
Frontenac gris,
gris, LaLa Crescent,
Crescent, andand Marquette
Marquette for
for 200–500,
200–500, 501–700,
501–700, 701–900,
701–900, or >901
or >901 chilling
chilling hourhour accumulation
accumulation in controlled (4 ◦(4
in controlled C)°C)
andand natural
natural field
field conditions.
conditions.
Mean Bud
Mean Phenology
Bud Stage
Phenology (Standard
Stage Deviation)
(Standard Deviation) in Chilling Groups
in Chilling Groups
Cultivar Condition
Cultivar Condition 200–500 501–700 701–900 >901
200–500 501–700 701–900 >901
Natural 2.8 ± 1.6 5.9 ± 2.4 7.7 ± 2.3 6.6 ± 2.5
Brianna (a) ± ± ±
Brianna (a)
Natural
Controlled 2.8
2.0 ± 1.2 1.6 5.9
3.3 ± 0.7 2.4 7.7
4.2 ± 2.2 2.3 7.2 ±±2.2
6.6 2.5
Natural
Controlled 1.6± 1.2
2.3 ±2.0 3.0 3.3 ± 0.7
± 2.2 5.14.2 ± 2.2
± 2.8 7.2±±2.6
4.9 2.2
Frontenac gris (b)
Controlled
Natural 2.1 ±2.3
0.9± 1.6 2.2 3.0
± 1.3
± 2.2 4.45.1
± 2.5
± 2.8 6.0
4.9±±2.5
2.6
Frontenac gris (b) Natural 2.4 ± 1.1 3.5 ± 2.4 3.9 ± 3.1 2.7 ± 2.7
La Crescent (b) Controlled 2.1 ± 0.9 2.2 ± 1.3 4.4 ± 2.5 6.0 ± 2.5
Controlled 2.1 ± 0.8 2.8 ± 1.9 4.2 ± 2.2 5.6 ± 2.1
La Crescent (b)
Natural
Natural 1.6± 1.1
2.6 ±2.4 2.7 3.5 ± 2.4
± 2.0 3.43.9 ± 3.1
± 2.4 2.7±±3.6
4.6 2.7
Marquette (c)
Controlled
Controlled 0.7± 0.8
2.0 ±2.1 1.9 2.8 ± 1.9
± 1.0 2.24.2 ± 2.2
± 1.2 5.6±±2.3
3.8 2.1
Mean phenology stage ±Natural
standard error for three
2.6 ±years
1.6 of measure.2.7
Differing
± 2.0 letters in parenthesis
3.4 ± 2.4 after cultivar4.6
indicate
± 3.6
Marquette (c)
phenology stage, in response to chilling hour accumulation, was significantly different between cultivars.
Controlled 2.0 ± 0.7 1.9 ± 1.0 2.2 ± 1.2 3.8 ± 2.3
Mean phenology stage ± standard error for three years of measure. Differing letters in parenthesis after cultivar indicate phenology stage,
in response to chilling hour accumulation, was significantly different between cultivars.
4. Discussion
Grapevine bud freezing tolerance increases from October to February with decreas-
ing and subzero freezing temperatures [30]. Typically, the maximum freezing tolerance
occurs in January and then begins to decrease with increasing temperatures in February or
March [31–33]. Interspecific cultivars are reported to have a wide range of inherent cold
hardiness and winter survival characteristics [2,33]. The results of this study showed the
complex interactions of the grapevine cultivar freezing tolerance and bud dormancy phe-
notype in response to changing temperatures. Sampling time and season influenced bud
freezing tolerance in interspecific cultivars and data modeling predicted factors influencingHorticulturae 2021, 7, 4 8 of 11
bud freezing tolerance across years with varying field conditions. Differing field temper-
atures impacted LTEs (temperatures of bud injury due to intracellular freezing) at the
various sampling times; however, differences between cultivars were consistent from year
to year. As shown for other grape cultivars, in mild winters, LTEs are less negative than
in colder winters [8,13]. This can be seen in the LTEs for Brianna averaging −24.7 ◦ C and
−26 ◦ C in 2018/19 and 2019/20, respectively. January is generally considered the period
of the dormant season when vines will be at their maximum freezing tolerance. The mus-
cadine cultivars Carlos and Summit were maximally hardy in January [34]. In V. vinifera
cultivars and hybrids Vignole and St. Vincent the bud cold hardiness correlates with the
recent cold temperatures [35]. In this study, the lowest cultivar LTEs occurred in January in
2018 and 2020; however, in 2019 the lowest LTEs occurred in March in conjunction with
field temperatures approaching −30 ◦ C.
The influence of local temperatures at different times in the dormant season have
been reported for several cultivars [35]. For example, Chardonnay was found to be more
freezing tolerant than Cabernet Sauvignon; however, Chardonnay is noted to transition
to ecodormancy and break bud earlier than Cabernet Sauvignon [36]. Similar responses
are apparent in this study, including inherent cultivar difference in freezing tolerance.
Marquette was more freezing tolerant than Brianna in 2018/19 and 2019/20. In contrast,
in 2017/2018 Marquette and Brianna showed similar freezing tolerance throughout the
dormant season. The temperature profiles from this three year period emphasizes the
need for cultivars that acclimate quickly and have moderate to slow deacclimation charac-
teristics [35]. In 2019/20, there was an early atypical low temperature in November that
appeared to damage primary buds and resulted in little change in freezing tolerance during
the rest of the season. Brianna appeared to deacclimate more rapidly, whereas Marquette
has a slower deacclimation profile. The bud break phenology at different chilling hours
suggest that Brianna requires lower chilling than the other three cultivars, which indicates
that although it is a cold hardy grape it may be susceptible to injury in late winter due to
rapid bud break [14].
Long term sustainability of cultivars is influenced by their ability to acclimate with
changing dormant season temperatures. La Crescent and Marquette were identified as
suitable cultivars for Wisconsin [37]. In contrast, La Crescent had a higher survival rate
than Marquette in Vermont [38]. Marquette had more than 90% bud survival in a six year
study in Iowa and the primary bud injury was lower than that of Brianna, Frontenac
Gris, and La Crescent [39]. Brianna had greater primary bud kill than La Crescent and
Marquette [40]. In this study, Brianna is noted as a cold hardy cultivar; however, it has
the potential risk of early bud break due to a lower chilling requirement. Marquette was a
superior cultivar in South Dakota for freezing tolerance and higher chilling requirement
than Brianna, Frontenac gris, and La Crescent.
A relationship between the loss of freezing tolerance and greater chilling accumulation
in grapevines has been reported [41]. Thus potential differences in cultivar chilling fulfill-
ment requirements should be considered when choosing cultivars for specific regions as it
may contribute to long term sustainability [1]. Increasing temperatures or warming periods
in late winter and early spring can trigger deacclimation and promote bud break, therefore,
early chilling fulfillment and early break can put cultivars at risk to freezing stress [6,18].
In this study, Brianna showed increased bud break at lower chilling hour accumulation
than the other cultivars and Brianna also had higher LTEs in the corresponding timeframes
suggesting that chilling fulfillment may decrease freezing tolerance stability and negatively
influence long term sustainability. It is of note that the controlled chilling and natural
field chilling produced a similar bud break phenology. This makes it possible to avoid the
confounding factor of primary bud injury on bud break phenology. Damage of the primary
bud frequently delays bud break with the secondary bud emerging more slowly than a
healthy primary bud. It is not possible to separate out prior freezing damage in natural
conditions on the rate of bud break in the forcing assays without destructively viewing the
bud. Thus, collection of materials shortly after leaf drop and testing bud break phenologyHorticulturae 2021, 7, 4 9 of 11
over a series of chilling hours can be used to provide chilling requirement information for
new cultivars without the confounding factor of freezing injury. Additional study of con-
trolled chilling and controlled non-lethal freezing acclimation conditions would be needed
to determine specific interactions between freezing tolerance and chilling accumulation.
5. Conclusions
Grapevine bud freezing tolerance is a critical factor in sustainable grape production;
however, the results of this study indicate the importance of determining both freezing
tolerance and chilling requirements of new cultivars to identify their potential success
in northern cold climate regions. All cultivars showed distinct acclimation and chilling
fulfilment characteristics, with Marquette exhibiting the greatest freezing tolerance in early
and mid-winter. There was a positive correlation between the 7-day minimum temperature
average and LTEs in 2017/18 and 2018/19. Modeling the potential contribution of factors
(cultivar, sampling time, and season) to LTEs indicated that in dormant seasons with a
gradual decrease in fall to winter temperatures (2017/18 and 2018/19) all main factors
and their interactions contributed to LTEs. In 2019/20 an early low temperature of −18 ◦ C
resulted in major bud damage and contributed to limited changes in LTEs in response
to low temperature in mid-winter. This early low temperature injury emphasized the
need for early acclimating cultivars in Northern Central Plains and that very early low
temperature extremes can cause damage in cold hardy interspecific cultivars. There is also
a risk associated with early deacclimation as noted in Brianna due to its lower chilling
requirement than found in the other cold hardy cultivars. Marquette had a greater chilling
requirement than Brianna, La Crescent, and Frontenac gris. The chilling fulfilment studies
indicated that main effect of natural accruing and constant controlled environment temper-
atures showed similar bud break stage results; however, there were significant interactions
between cultivar and treatment and season indicating greater complexity to the chilling
fulfillment trait.
Supplementary Materials: The following are available online at https://www.mdpi.com/2311-752
4/7/1/4/s1, Table S1. Mean monthly maximum and minimum temperatures during the dormant
seasons of 2017/18, 2018/19 and 2019/20. Table S2. ANOVA for cultivar, sampling time, season,
and interaction effects on LTEs. Table S3. Mean bud LTEs for Brianna, Frontenac gris, La Crescent,
and Marquette during the dormant seasons of 2017/18, 2018/19 and 2019/20. Table S4. ANOVA for
controlled and natural chilling on grapevine bud break across three seasons.
Author Contributions: Conceptualization, A.F., T.Y.; Methodology A.F., T.Y. and D.A.; Data curation
T.Y. and D.A.; Formal analysis and manuscript development T.Y. and D.A.; Review and Editing A.F.
All authors have read and agreed to the published version of the manuscript.
Funding: This research was partially funded by the South Dakota Research Station through multistate
Project 3AR668.
Acknowledgments: David and Sue Greenlee of Tucker’s Walk Vineyard and winery, Garretson, SD,
for allowing us to sample vines.
Conflicts of Interest: The authors declare no conflict of interest.
References
1. Fennell, A. Freezing tolerance and injury in grapevines. J. Crop. Improv. 2004, 10, 201–235. [CrossRef]
2. Svyantek, A.; Köse, B.; Stenger, J.; Auwarter, C.; Hatterman-Valenti, H. Cold-Hardy Grape Cultivar Winter Injury and Trunk
Re-Establishment Following Severe Weather Events in North Dakota. Horticulturae 2020, 6, 75. [CrossRef]
3. Zabadal, T. Winter Injury to Grapevines and Methods of Protection (E2930); Michigan State University: East Lansing, MI, USA, 2015.
4. Pierquet, P.; Stushnoff, C. Relationship of low temperature exotherms to cold injury in Vitis riparia Michx. Am. J. Enol. Vitic. 1980,
31, 1–6.
5. Pierquet, P.; Stushnoff, C.; Burke, M. Low temperature exotherms in stem and bud tissues of Vitis riparia Michx [North America].
J. Am. Soc. Hortic. Sci. 1977, 102, 54–55.
6. Lipe, W.N.; Baumhardt, L.; Wendt, C.; Rayburn, D. Differential thermal analysis of deacclimating Chardonnay and Cabernet
Sauvignon grape buds as affected by evaporative cooling. Am. J. Enol. Vitic. 1992, 43, 355–361.Horticulturae 2021, 7, 4 10 of 11
7. Mills, L.J.; Ferguson, J.C.; Keller, M. Cold-hardiness evaluation of grapevine buds and cane tissues. Am. J. Enol. Vitic. 2006,
57, 194–200.
8. Londo, J.P.; Kovaleski, A.P. Characterization of wild North American grapevine cold hardiness using differential thermal analysis.
Am. J. Enol. Vitic. 2017, 68, 203–212. [CrossRef]
9. Reynolds, A.G. Grapevine Breeding Programs for the Wine Industry; Elsevier: Amsterdam, The Netherlands, 2015.
10. Hemstad, P.; Luby, J.J. Utilization of Vitis riparia for the development of new wine varieties with resistance to disease and extreme
cold. In Proceedings of the VII International Symposium on Grapevine Genetics and Breeding, Montpellier, France, 6 July 1998;
pp. 487–496.
11. Mesonet at SDSTATE. Available online: https://www.sdstate.edu/mesonet (accessed on 20 November 2020).
12. Ferguson, J.C.; Moyer, M.M.; Mills, L.J.; Hoogenboom, G.; Keller, M. Modeling dormant bud cold hardiness and budbreak in
twenty-three Vitis genotypes reveals variation by region of origin. Am. J. Enol. Vitic. 2014, 65, 59–71. [CrossRef]
13. Ferguson, J.C.; Tarara, J.M.; Mills, L.J.; Grove, G.G.; Keller, M. Dynamic thermal time model of cold hardiness for dormant
grapevine buds. Ann. Bot. 2011, 107, 389–396. [CrossRef]
14. Londo, J.P.; Johnson, L.M. Variation in the chilling requirement and budburst rate of wild Vitis species. Environ. Exp. Bot. 2014,
106, 138–147. [CrossRef]
15. Lang, G.; Early, J.; Martin, G.; Darnell, R. Endo-, para-, and ecodormancy: Physiological terminology and classification for
dormancy research. HortScience 1987, 22, 371–377.
16. Londo, J.; Kovaleski, A.P. Deconstructing cold hardiness: Variation in supercooling ability and chilling requirements in the wild
grapevine Vitis riparia. Aust. J. Grape Wine Res. 2019, 25, 276–285. [CrossRef]
17. Fuchigami, L.; Weiser, C.; Kobayashi, K.; Timmis, R.; Gusta, L. A degree growth stage (GS) model and cold acclimation in
temperate woody plants. Plant cold hardiness and freezing stress. Mech. Crop. Implic. 1982, 2, 93–116.
18. Meier, M.; Fuhrer, J.; Holzkämper, A. Changing risk of spring frost damage in grapevines due to climate change? A case study in
the Swiss Rhone Valley. Int. J. Biometeorol. 2018, 62, 991–1002. [CrossRef]
19. Maul, E.; Sudharma, K.N.; Ganesch, A.; Brühl, U.; Hundemer, M.; Kecke, S.; Mahler-Ries, A.; Marx, G.; Schreiber, T.; Walk, M.; et al.
30 years VIVC—Vitis International Variety Catalogue. In Proceedings of the XI International Conference on Grapevine Breeding
and Genetics, Beijing, China, 28 July–2 August 2014; Available online: www.vivc.de (accessed on 12 December 2020).
20. Okie, W. Register of new fruit and nut varieties. HortScience 2004, 39, 1509–1523. [CrossRef]
21. Luby, J.; Hemstad, P. Grape plant named ‘Frontenac gris’. U.S. Patent Application No. 10/775,435, 25 April 2006.
22. Okie, W. Register of new fruit and nut varieties list 41. HortScience 2002, 37, 251–272. [CrossRef]
23. Hemstad, P.; Luby, J. Grapevine plant named ‘Marquette’. U.S. Patent Application No. 11/580,356, 16 December 2008.
24. USDA. United States Department of Agriculture. USDA Plant Hardiness Zone Map. Available online: https://mauroseed.com/
pages/usda-planting-zone-map?gclid=Cj0KCQiAlZH_BRCgARIsAAZHSBlLbpQSJzHpikz5SGDi1FCbvorASxtrspMSoGrDJjBSC\
yaiENEtRSUaAgawEALw_wcB (accessed on 28 December 2020).
25. Coombe, B.G. Growth stages of the grapevine: Adoption of a system for identifying grapevine growth stages. Aust. J. Grape
Wine Res. 1995, 1, 104–110. [CrossRef]
26. Dokoozlian, N. Chilling Temperature and Duration Interact on the Budbreak of ‘Perlette’ Grapevine Cuttings. HortScience 1999,
34, 1–3. [CrossRef]
27. Revelle, W. Psych: Procedures for Psychological, Psychometric, and Personality Research; Northwestern University: Evanston, IL, USA, 2020.
28. R Core Team. R: A Language and Environment for Statistical Computing; R Foundation for Statistical Computing: Vienna, Austria, 2013;
ISBN 3-900051-07-0. Available online: http://www.R-project.org/ (accessed on 28 December 2020).
29. Wickham, H. Ggplot2: Elegant Graphics for Data Analysis; Springer: New York, NY, USA, 2016.
30. Wolf, T.K.; Cook, M.K. Seasonal deacclimation patterns of three grape cultivars at constant, warm temperature. Am. J. Enol. Vitic.
1992, 43, 171–179.
31. Bourne, T.; Moore, J. Cold hardiness in grape cultivar development. Fruit Var. J. 1991, 45, 26–28.
32. Bourne, T.F.; Moore, J.; George, M.F. Primary bud hardiness of four genotypes of grapes in Arkansas. J. Am. Soc. Hortic. Sci. 1991,
116, 835–837. [CrossRef]
33. Wolf, T.K.; Cook, M.K. Cold hardiness of dormant buds of grape cultivars: Comparison of thermal analysis and field survival.
HortScience 1994, 29, 1453–1455. [CrossRef]
34. Clark, J.R.; Wolf, T.K.; Warren, M.K. Thermal Analysis of Dormant Buds of Two Muscadine Grape Cultivars and of Vitis
labrusca L.‘Mars’. HortScience 1996, 31, 79–81. [CrossRef]
35. Sanliang Gu, S.; Shufu Dong, S.; Jianqiang Li, J.; Susanne Howard, S. Acclimation and deacclimation of primary bud cold
hardiness in ‘Norton’, ‘Vignoles’ and ‘St. Vincent’grapevines. J. Hortic. Sci. Biotechnol. 2001, 76, 655–660. [CrossRef]
36. Cragin, J.; Serpe, M.; Keller, M.; Shellie, K. Dormancy and cold hardiness transitions in winegrape cultivars Chardonnay and
Cabernet Sauvignon. Am. J. Enol. Vitic. 2017, 68, 195–202. [CrossRef]
37. Atucha, A.; Hedtcke, J.; Workmaster, B.A. Evaluation of cold-climate interspecific hybrid wine grape cultivars for the upper
Midwest. J. Am. Pomol. Soc 2018, 72, 80–93.
38. Berkett, L.P.; Bradshaw, T.L.; Kingsley-Richards, S.L.; Cromwell, M.L. 2008 Grape Bud Survival on Eight Winegrape Cultivars
in Vermont. In Proceedings of the 2nd Annual National Viticulture Research Conference, University of California-Davis,
Davis, CA, USA, 9–11 July 2008; p. 11.Horticulturae 2021, 7, 4 11 of 11
39. Domoto, P.A.; Nonnecke, G.R.; Hannan, J.M.; Portz, D.N.; Riesselman, L.B.; Havlovic, B.J.; Howell, N.P.; Pecinovsky, K.T.;
Van Dee, K. 2003 Wine Grape Cultivar Trial Performance; RFR A1039; Iowa State University: Ames, IA, USA, 2011.
40. Domoto, P.A.; Nonnecke, G.R.; Tabor, P.; Riesselman, L.B. Cold Hardy Wine Grape Cultivar Trial; RFR A1214; Iowa State University:
Ames, IA, USA, 2013.
41. Kovaleski, A.P.; Reisch, B.I.; Londo, J.P. Deacclimation kinetics as a quantitative phenotype for delineating the dormancy transition
and thermal efficiency for budbreak in Vitis species. AoB Plants 2018, 10, ply066. [CrossRef]You can also read