From Balkanized Cleveland to Global Cleveland
←
→
Page content transcription
If your browser does not render page correctly, please read the page content below
White Paper: From Balkanized Cleveland to Global Cleveland

 From Balkanized Cleveland to
      Global Cleveland
                          A Theory of Change for Legacy Cities
        By Richey Piiparinen and Jim Russell, Senior Consultants at Strategic Urban Solutions

                     A White Paper Funded by Ohio City Inc.
                                          November 2013
White Paper: From Balkanized Cleveland to Global Cleveland

Acknowledgement
The current white paper was funded by Ohio City Incorporated. Ohio City Incorporated, led by Executive
Director Eric Wobser, leads the development of Ohio City by serving a diverse community of committed
people, driving new investments in and preserving the history of a unique place, and promoting a socially-
enriching urban neighborhood. The organization recently adopted a new strategic plan which can be
viewed here.
White Paper: From Balkanized Cleveland to Global Cleveland

       Introduction
       With the 2010 census tallied, Cleveland officially hit a 100-year low for population. The community
       sprang into action without fully understanding the reasons for decline. The goal of this concept paper is to
       reframe the challenges facing the city and region, thereby informing a more effective policy agenda.
       Cleveland didn’t decline because industry left. Cleveland didn’t decline because people left. Vacant
       houses are not Cleveland’s cross to bear. Cleveland’s ultimate problem is that it is cut off from the global
       flow of people and ideas. Cleveland needs to be more tapped into the world.
       What follows is a conceptual frame to guide the region toward global connectivity and, ultimately,
       economic redevelopment. It focuses on migration and neighborhood development as the means to
       achieve a globalized Cleveland. The concept paper is a first step to creating an empirical roadmap that can
       guide subsequent analysis and strategic implementation.

Image 1 Courtesy of Time Magazine

       Balkanized Cleveland Loses Ground
       There are winners and losers in urban America. The winners, termed “spiky” locales1, are centers of
       innovation, and they include the likes of New York City, Boston, Chicago and Silicon Valley. Like the
       manufacturing centers before them, innovation centers are developed via migration. Yet this migration is
       not driven by demand for labor, like in 20th-century industrialized cities, but by demand for ideas.
       Economist Enrico Moretti explains2:
       More than traditional industries, the knowledge economy has an inherent tendency toward geographical
       agglomeration. In this context, initial advantages matter, and the future depends heavily on the past. The
       success of a city fosters more success, as communities that can attract skilled workers and good jobs tend
       to attract even more. Communities that fail to attract skilled workers lose further ground.

       1
           See: http://isites.harvard.edu/fs/docs/icb.topic30774.files/2-2_Florida.pdf
       2
           See: http://www.hmhbooks.com/newgeographyofjobs/pdfs/TheNewGeographyofJobs_excerpt.pdf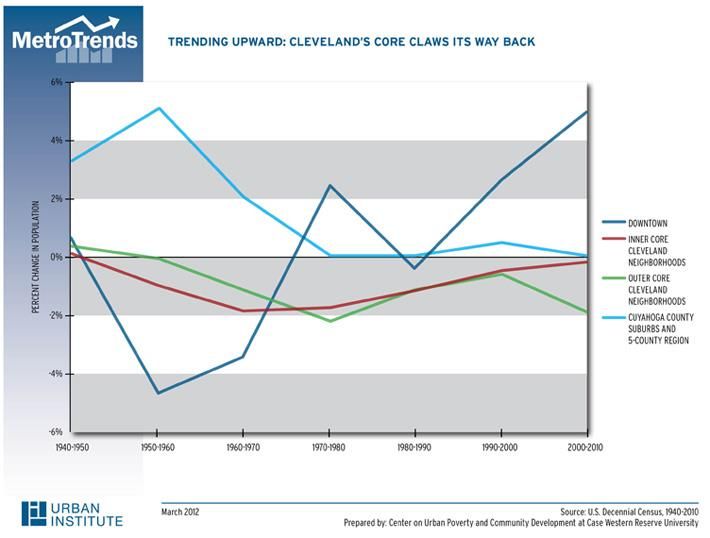
White Paper: From Balkanized Cleveland to Global Cleveland

In other words, successful urban centers require a constant inflow of migrants. While cries of “brain
drain” are predominant, retaining residents is less import than attracting migrants, and this is evidenced
by the fact that the Metropolitan Statistical Areas (MSA’s) of New York City, Los Angeles, Washington,
D.C., and Chicago led the country in the number of residents leaving a region from 2000 to 20103. (See
Appendix A for list of metros with most residents leaving.) Cleveland’s metro ranked 35th in the number
of residents out-migrating from 2000 to 2010, despite being the 28th largest metro in the country4. In fact,
the Cleveland metro showed stable population figures from 1990 (2,102,248) to 2010 (2,077,240).
But those same metros that have the highest outmigration rates also exhibit the highest inmigration rates.
Again, the Cleveland metro lags, ranking 44th in the number of inmigrants from 2000 to 20105. (See
Appendix B for list of metros with most residents arriving.) Too, the number of Greater Clevelanders
born in Ohio is high (75%)6. Contrast this with the country’s economic epicenters, with the number of
locally-born residents of Los Angeles, New York City, Washington, D.C., and Chicago ranging from
approximately 30% to 60%7. Taken together, Cleveland lacks a demographic “churn” indicative of
knowledge economies.
It is important to note how this “churn” helps cities. Knowledge-based economies run on the quality of
ideas. Ideas are not only a function of intelligence or education, but also the depth of information a
person, or a city, receives. Historically, a lack of information—via a lack of demographic inflow—has
“Balkanized” social networks in Rust Belt cities. This has led to a culture of parochialism, which has hurt
economic development.
For instance, in the seminal study entitled “Why the Garden Club Couldn’t Save Youngstown”8, author
Sean Safford concludes Youngstown’s inability to innovate from its steel days was due to the fact its
“economic and social core was populated by the third and fourth generations of the city’s original elite,
[so] relatively little “turnover” had occurred”. For Stafford, it was this “configuration of [Youngstown’s]
social capital” that negated the region’s ability to evolve its economy.
This insularity pervades throughout the entirety of a legacy city’s social system. “Old economies” are
reflected in “the old neighborhood”, in which a dearth of inmigration and lack of mobility can seal a city
off from the global flow of ideas, thus creating a localized society that tends to “inbreed homophily”—
defined as “the likelihood a person only speaks to members of a same group”. The echo chamber
undermines progress. From a research paper “Migrant Networks and the Spread of Misinformation”9, the
authors contrast open versus closed networks:
Two examples for migrant networks with different degrees of integration are illustrated in Figure 1. The
figure on the left describes an ethnic enclave. Its members, represented by the circles, have close
connections within the network strong ties, but very few connections to the outside world, represented by
the crosses. An enclave is a typical example for a network with a high degree of closedness…The graph

3
  Source: Telestrian via Internal Revenue Service, 2000 to 2010
4
  Source: U.S. Census Bureau, 2010
5
  Source: Telestrian via Internal Revenue Service, 2000 to 2010
6
  Source: U.S. Census Bureau, 2007-2011 American Community Survey
7
  See: http://www.csu.edu/cerc/researchreports/documents/DemographicDynamismMetropolitanChangeChicago1999.pdf
8
  See: http://web.mit.edu/ipc/publications/pdf/04-002.pdf
9
  See: http://www.iza.org/conference_files/Transatlantic_2013/elsner_b7340.pdf

White Paper: From Balkanized Cleveland to Global Cleveland

on the right represents a well-integrated network, whose members have weak connections among each
other but strong connections to the outside world…
                                     Figure 1
A local culture that is
tightly wound by closed
social networks—i.e., a
reliance on mostly family
and friends—will disallow
new information from
entering the network’s idea
bank. Taken to scale,
neighborhoods become cut
off from neighborhoods
(e.g., East Side vs. West
Side), the city from its
suburbs, and the region from the world. Worse, the provincial environment can make it hard for new
arrivals, be they native-born newcomers, repatriates, or the foreign born. Writes one young Clevelander
upon her move back from San Francisco10:
I need to keep believing that the game changers and boomerangers, the passionate progressive civic
leaders and the creative entrepreneurs that I came here to join, to be part of their reshaping and
rejuvenation of Cleveland, are here. I need to believe that there are cool people I’ll find and connect
with…who resemble the masses of interesting, dynamic, creative, intellectually thirsty
friends/colleagues/acquaintances/random strangers I left behind in San Francisco, but I may need to
accept that they are fewer and harder to find.
Echoes a 34-year old immigrant from Shanghai living in Cleveland’s Tremont neighborhood11:
"I want a city that is intellectually stimulating. I want to be challenged. It seems like Cleveland can strive
for mediocrity…It seems like an international mentality is a liability [in Cleveland]”.
This is not to say there’s no hope. In fact, Cleveland is demographically churning. But to discover this,
you must to know how and where to look. This is important, because you can’t strengthen what you can’t
uncover, let alone what you misunderstand.

Cleveland Churns
When imagining the demographic future of Cleveland, overall population figures have sufficed. The
narrative of the region usually is played out this way: Cleveland lost 17% of its population loss from 2000
to 2010. Cuyahoga County, the regional hub, lost 110,000 plus residents, with regional growth largely
occurring in the exurban neighboring counties.
While this narrative is intuitive, it misses the “demographic dynamism”12 occurring beneath the surface.
Specifically, by disaggregating demographic data by age and race at finite geographic levels across time,
you begin to notice microtrends of urban infill. This is important. Because encouraging emerging

10
   See: http://rustbeltchic.com/three-months-in/
11
   See: http://www.freshwatercleveland.com/features/demographicdynamism091913.aspx
12
   See: http://www.csu.edu/cerc/researchreports/documents/DemographicDynamismMetropolitanChangeChicago1999.pdf
White Paper: From Balkanized Cleveland to Global Cleveland

demographic trends flowing into the city is far more efficient than attempting to reverse long-
standing demographic trends of outmigration.
A starting point for this microtrend analysis was undertaken by one of the co-authors for the Urban
Institute. A “reverse of the donut hole” concept was used to ascertain whether or not nascent urban infill
was occurring. And if so, where?
The analysis, entitled “Not Dead Yet: The Infill of Cleveland’s Urban Core”13, showed the city’s
downtown grew by 96% from 1990 to 2010, reaching 9,098 residents. Most of the growth was due to a
rapid increase in young adults aged 22 to 34.
The analysis examined whether this growth was “spilling” into inner-core neighborhoods. Analyzing
long-term trend lines (see Figure 2), the city’s inner-core neighborhoods surrounding downtown had also
experienced positive trends. Still, these trends do not show population growth, but rather a decline in the
rate of population loss. Was this because less people were leaving inner-core neighborhoods, or was
continued outmigration neutralized by young adults moving back in?
Figure 2

To help uncover hidden population growth, a technique termed “simple cohort analysis”14 was used. For
example, if 1000 15-24 year-olds were present in the Ohio City neighborhood in 2000, then we would
expect to find 1000 25-34 year-olds there a decade later if no one moved in or out, or died. That

13
     See: http://www.metrotrends.org/spotlight/Cleveland_Spotlight.cfm
14
     See: http://blog.case.edu/msass/2013/02/14/Briefly_Stated_No_13-02_Mapping_Human_Capital.pdf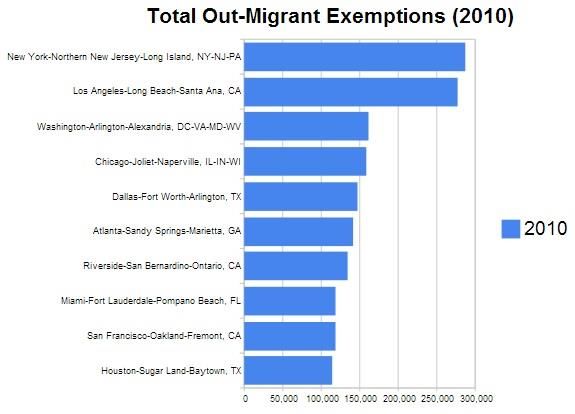
White Paper: From Balkanized Cleveland to Global Cleveland
“expected” number is compared to the “observed” population of the age cohort, allowing the researcher to
infer migration (positive or negative).
Figure 3
The results in Figure 3 showed there was an influx of 25-34 year-olds into the neighborhoods of Ohio
City and Tremont that are pushing the population change in line with that of downtown. Going back to
Figure 2, one can imagine the dark blue “Downtown” trend line “pulling up” the red “inner core” trend
line. This influx has likely affected the area’s socioeconomic status. Analyzing resident salaries for the
zip code 44113—which makes up Tremont, Ohio City, and parts of downtown—the number of
employees making more than $3,333 a month increased from 1,679 (23% of the neighborhoods’ working
population) in 2002, to 2,767 (42% of the neighborhoods’ working population) in 201115. Such trends are
important in a city with a historically declining tax base and high poverty rate.
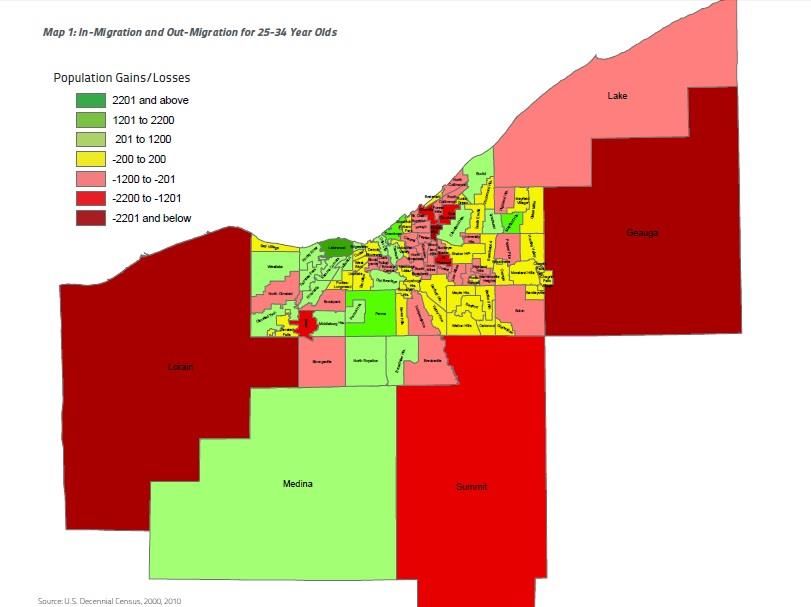
Beyond the core, a subsequent study found young adult growth into other inner-city neighborhoods as
well, including Edgewater, Kamms Corners, and Old Brooklyn, as well as the historic inner ring suburbs
of Lakewood, Cleveland Hts., and Parma.16 (See Appendix C for a map of city neighborhoods
experiencing young adult growth.) In all, the results support a tentative “reverse of the donut hole”. Yet
the infill is nascent, and growing it requires knowledge of where the flow may be coming from and why.
15
Source: Longitudinal Employee Household Dynamics, U.S. Census
16
See: http://blog.case.edu/msass/2013/02/14/Briefly_Stated_No_13-02_Mapping_Human_Capital.pdf
White Paper: From Balkanized Cleveland to Global Cleveland

The “Push” and “Pull” of Rust Belt Chic Migration
Migrations patterns are developed by “push” and “pull” factors that occur in a global context. Cleveland’s
embryonic infill, termed “Rust Belt Chic” migration17, is not simply about “preference for urban living”,
but is tied to macroeconomic shifts. The cities that understand these shifts are the metropolises that can
strategize to grow the infill to a critical mass.
The Push Factor: The “Spiky” Metro Leaks
As a rule, “spiky” metros continuously pull in talent. In the industrial Midwest, Chicago has historically
been fed by Greater Cleveland and the like. Notes author Edward McClelland18:
Chicago is the drain into which the brains of the Middle West disappear. Moving there is not even an
aspiration for ambitious Michiganders. It’s the accepted endpoint of one’s educational progression:
grade school, middle school, high school, college, Chicago.
This is the prevalent narrative: “backwater” Rust Belt city loses its educated to “cool” global city. What is
less talked about is just how many people leave global cities. The cities with the highest outmigration
rates are metros that have historically attracted Midwestern talent (see Figure 4). In examining
Cleveland’s urban infill, what may be occurring is reverse brain drain, or rather “brain circulation”, with
the outmigration from global city providing the demographic dynamism fueling Ohio City, Tremont,
Downtown, and other neighborhoods seeing young adult growth.

Figure 4

Using IRS data for 2000-2010, nearly 10,000 people moved from the New York metro to the Cleveland
metro (See Appendix D for table of top metros sending people to Greater Cleveland)19. In fact, in the
migrant exchange, more people came to Greater Cleveland (200 people) than left for metro New York.

17
   See: http://www.salon.com/2012/05/12/rust_belt_chic_declining_midwest_cities_make_a_comeback/
18
   See: http://www.chicagomag.com/Chicago-Magazine/June-2013/How-Chicago-Became-the-Undisputed-Star-of-the-Midwest/
19
   Source: Telestrian via Internal Revenue Service, 2000, 2010
White Paper: From Balkanized Cleveland to Global Cleveland

Outside of Ohio, no metro sends more people to Cleveland than New York. The Chicago metro is a close
second. Somewhat unique in the United States, Cleveland has excellent churn with these two global cities.
Data from the Census corroborates this “ironic
                                                          Table1: Top Locations Feeding Cuyahoga County
migration” from global city into Greater                  FIPS       County         State            Net
Cleveland. Table 1 shows that Cuyahoga                    Code                                       Migration
County gained the second most people from                    26163 Wayne            Michigan                655
Kings County, New York, which is the county                          County
seat of Brooklyn. Also on the list is Queens                 36047 Kings County New York                    283
County, NY; Chicago’s Cook County;                           25021 Norfolk          Massachusetts           239
                                                                     County
Pittsburgh’s Allegheny County; and Norfolk
                                                             17031 Cook County Illinois                     226
County, a county of Greater Boston.                                  Erie County    New   York              221
                                                             36029
What is going on here? The authors theorize                  36081 Queens           New York                213
                                                                     County
that a new migration pattern is emerging.
                                                             42003 Allegheny        Pennsylvania            194
Specifically, much like the manufacturing                            County
economy before it, the innovation economy—                   22015 Bossier          Louisiana               150
epitomized by the spiky knowledge hubs of                            Parish
Silicon Valley and New York—may be                           26161 Washtenaw        Michigan                148
diffusing due to the diminishing scale of returns                    County
                                                             13063 Clayton          Georgia                 145
of agglomeration. These diminished returns are
                                                                     County
keyed by a high cost of labor for knowledge               Source: U.S. Census Bureau, 2006-2010 5-year
workers in spiky metros, with the labor                   American Community Survey
overhead tied to exorbitant cost of living
indexes in cities such as San Francisco, New York, Chicago, and Boston20. Another issue is the fact that
technological advances have in effect leveled the playing field for Middle America. It is becoming more
common, for instance, to telecommute to a job in New York from a home office in Cleveland.
Also noteworthy are potential trends relating to firm location as talent continues “leaking” from global
cities. Specifically, other regions, like Portland, attract talent, but their educational ecosystems are less
developed. Conversely, the industrial Midwest has an advanced educational and innovation ecosystem.
According to the Chronicle of Higher Education, half of the top 10 states for out-of-state freshman
enrollment reside in the Rust Belt (Pennsylvania is 1, Ohio is 7)21. Moreover, the region is still the
“nursery of applied science”, hosting 4 of the top 10 engineering schools in the country, as well as the
largest concentration of nation’s engineers, some 320,00022. This matters greatly in terms innovation, as
the field of engineering accounts for nearly 70% of the nation’s corporate research and development
activity, according to Joel Kotkin in the article “Rust Belt Chic and The Keys to Reviving the Great
Lakes”23.
This scenario that’s unfolding in which coastal talent is arriving, or re-arriving, into the legacy city
landscape can foretell an economic sea change. This is because firms, due to labor costs, are increasingly
following people. (See Googles recent move to Pittsburgh to be close to Carnegie Mellon24.) A business

20
   See: http://www.theatlanticcities.com/housing/2013/10/where-even-middle-class-cant-afford-live-any-more/7194/
21
   See: http://chronicle.com/article/List-Freshman-Class/129559/
22
   See: http://www.forbes.com/sites/joelkotkin/2013/08/30/rust-belt-chic-and-the-keys-to-reviving-the-great-lakes/
23
   See: Ibid
24
   See: http://www.post-gazette.com/stories/business/technology/google-to-expand-pittsburgh-office-690637/
White Paper: From Balkanized Cleveland to Global Cleveland model centered on talent attraction into spiky metros is becoming a competitive disadvantage to firms. From the Harvard Business Review25: It goes without saying that no matter how much talent a company might have, there are many more talented people working outside its boundaries. Yet all too many companies focus solely on acquiring talent, on bringing talent inside the firm. Why not access talent wherever it resides? It is hypothesized that more firms will be asking the same question, and it will be those legacy cities, like Cleveland, who best understand the opportunity at hand that will be providing the answers. The Pull Factor: Big Fish Small Pond Talent Migration In April of 2013, U-Haul’s annual National Migration Trend Report showed Pittsburgh ranked tops in the country for “growth cities”, or the number of people moving into an area26. Pittsburgh beat out Austin, Texas. Columbus, Ohio ranked 9th. Also, as shown in Figure 5, Ohio gained nearly 400,000 workers with a college degree from 2000 to 2012, ranking the state 13th overall, ahead of Colorado and Massachusetts27. Figure 5 What is the pull? The authors hypothesize there is a psychogeographic attraction toward a life that entails making real change in a community. This is called “big fish small pond talent migration”28. It is part regional pride for “boomerangers” longing to revitalize home, but also part opportunity. From the New York Times article “Replanting the Rust Belt”29: Mr. [Jonathon] Sawyer lived and cooked in New York City for five years, working for the chef Charlie Palmer, before he and his wife decided to raise their children back in their hometown. 25 See: http://blogs.hbr.org/2009/03/the-strategic-advantage-of-glo/ 26 See: http://www.bizjournals.com/pittsburgh/news/2013/04/12/pittsburgh-tops-u-hauls-moving-study.html 27 Source: Telestrian via the American Community Survey, 2000, 2012 28 See: http://burghdiaspora.blogspot.com/2013/01/big-fish-small-pond-talent-migration.html 29 See: http://www.nytimes.com/2013/05/08/dining/replanting-the-rust-belt.html?pagewanted=all&_r=0
White Paper: From Balkanized Cleveland to Global Cleveland

But he was determined that if he came back, it would be partly to help the city transcend its Rust Belt
reputation.
The “big fish small pond” migration story is gaining a saturation point narratively speaking. “[A] critical
mass of diehard young Clevelanders are either staying or coming back to turn the place around,” notes a
recent Atlantic Cities article “The Passion of Young Cleveland”.30 The article interviews 29-year old
architect and Harvard grad Marika Shioiri-Clark, a former resident of San Francisco, Boston, Mumbai,
and Paris, who states that it’s “much easier to be an entrepreneur [in Cleveland]. There’s a much lower
threshold in terms of risk and price."
Such is a vastly different talent attraction paradigm than Creative Class theory migration, which posits
that urban amenities and creative place-making will attract the next generations’ economic change
agents31. But you don't move to Cleveland to live out your Portland or Brooklyn fantasy on the cheap.
You migrate for opportunity. Despite the challenges and the warts, Cleveland offers something that New
York doesn’t.
Furthermore, what cannot be overlooked is the “cool fatigue” that’s affecting many global city
inhabitants. There is an increasing chorus of concern that global cities are turning into “vast gated
communities where the one per cent reproduces itself”32. Here, rising housing costs, deepening income
inequalities, cultural homogenization due to vast commercialization of local neighborhood identity, it all
provides psychogeographic fuel for seeking alternative, “frontier” locations.
“The jobs crisis has caused young people to thumb their noses at the biggest cities and move to places like
New Orleans, Austin, or the Rust Belt to save money, help with revitalization efforts, or become a big fish
in a small pond…” writes a young New Yorker struggling to remain in the city33.
Taken together, talent is slamming into a ceiling in thick labor market metros. They are increasingly
finding a better return on their skills in Rust Belt cities like Cleveland.

Migration is Economic Development
The importance of Cleveland’s nascent infill as a means to arrest its economic and demographic decline
cannot be overstated. Yet this will only occur if migration is leveraged so as to develop real economic
growth. In other words, simply developing “creative class” enclaves in the likes of Ohio City and
Tremont will do nothing to transition Cleveland from a segregated, siloed city with high rates of poverty
into a globalized, integrated city comprised of neighborhoods that produce human capacity. Below
sketches a roadmap for how such a transition can occur.
From Balkanized Cleveland to Global Cleveland
The diffusion of the innovation economy happens at the scale of the Rust Belt neighborhood. The
intensity and scale of globalization in spiky cities force out hundreds of thousands of residents every year,
driving world-class talent to Cleveland’s gentrifying areas. In short, Tremont, Ohio City, etc. provide an
atmosphere of city living cultivated in a global city.
The long-term economic potential for this talent migration rests not in how many microbrews are
consumed or condos are leased, but rather how it affects Cleveland’s global interconnectivity. These

30
   See: http://www.theatlanticcities.com/arts-and-lifestyle/2013/11/passion-young-cleveland/7486/
31
   See: http://www.washingtonmonthly.com/features/2001/0205.florida.html
32
   See: http://www.ft.com/intl/cms/s/2/a096d1d0-d2ec-11e2-aac2-00144feab7de.html#axzz2WTkLrPTI
33
   See: http://www.theatlanticcities.com/neighborhoods/2012/06/how-recession-has-made-me-gentrifier-my-home-town/2289/
White Paper: From Balkanized Cleveland to Global Cleveland

migrations are rearranging Cleveland’s historical insular social networks, with the gentrifying
neighborhoods acting as urban portals to the global flow of information.
Often, Cleveland’s interconnectivity is weaved as thus: college graduates hailing from Greater Cleveland
move to global city and experience neighborhoods filled with outsiders. A successful global city network
is one of weak ties and openness to people living outside of the community. This environment socializes
Cleveland expatriates for knowledge transfer, as well as inter-regional and international trade. Think of an
act of migration, then, as a laying down of human “fiber optics” that connect two points in space.
Upon repatriation to Cleveland, return migrants bring with them this social orientation that opens up
certain neighborhoods to globalization. The neighborhood’s evolving interconnectedness makes the area
more attractive to outsiders who have no connection to Cleveland, pulling more globally-connected
citizens—be they native newcomers or the foreign born—into the city.
Eventually, returning to the
Figure 1, neighborhoods
such as Ohio City begin
losing their “ethnic enclave”
orientation, instead
resembling loosely
connected social networks
that disable the
informational inertia
associated with inbreeding
homophily. Specifically, loosely connected networks have far better “signaling” capacity to a migrant
network’s country or city of origin. This is called the “strength of weak ties”34. Be it through Facebook,
cell phone use, etc. the “word” gets out, and the migration chain between two points strengthens. Notes
migration scholar Douglas Massey in the classic article “Economic Development and International
Migration in Comparative Perspective”35:
“Migration may begin for a variety of reasons, but once the migration reaches a critical threshold,
expanding networks cause the cost of movement to fall and the probability of migration to rise; these
trends reinforce one another, and over time migration spreads outward to encompass all segments of
society. This feedback occurs because the networks are created by the act of migration itself.”
While the international economic development literature on the importance of migrant networks is vast36,
what is important to know is rather intuitive: an inflow of people brings in a depth of information, and a
city’s economic fortunes are only as good as its citizenry’s exposure to new ideas and the evolution that
comes with change.
Beyond Gentrification
The mistake cities make when it comes to reinvestment into the urban core is to settle with the low-
hanging fruit of gentrification. Here, the neighborhood is seen as a center of consumption, with trickle
down effects from increased commerce hypothesized to reach low-income residents residing in gentrified
zones. This does not happen. In fact, as researched by urbanist Richard Florida, the arrival of the “creative
class” en masse can have negative effects for low- and middle-income residents, primarily through

34
   See: http://sociology.stanford.edu/people/mgranovetter/documents/granstrengthweakties.pdf
35
   See:http://worldroom.tamu.edu/Workshops/Migration06/EuropeanUnion/EU%20articles/Economic%20Development%20and%20International%20Migration.pdf
36
   See: http://www.umass.edu/digitalcenter/research/pdfs/JF_NetworkSociety.pdf
White Paper: From Balkanized Cleveland to Global Cleveland

        displacement. “On close inspection,” Florida writes in the Atlantic Cities, “talent clustering provides little
        in the way of trickle-down benefits [to the poor].”37
        Most city officials feel the negative effects of gentrification are the inevitable cost of progress. “"I have
        never…come up with a satisfactory answer of how to make sure everyone benefits [from gentrification],”
        notes New York’s City Planning Director38. Others, like scholar Storm Cunningham, feel creating
        equitable neighborhoods that leverages reinvestment for all demographics is simply not a priority.
        Cunningham writes39:
        Avoiding unfair pain, and damage to heritage, must be a conscious and measured component of the
        redevelopment project’s goals. It seldom is: too many developers and planners make it sound like such
        suffering is the inevitable price of progress. Bull: it’s just a lack of sufficient desire to avoid it.
        This avoidance depends on a re-prioritization of capital from one chiefly financially-based, to
        community- and human-focused. This shift is not simply out of benevolence, but rather for the betterment
        of the regional economy. In order for Cleveland to sustain long-term economic growth, neighborhoods
        must be seen as producers of human capital, not simply centers of consumption. Developing human
        capital depends on cultivating capacity which, in turn, hinges on the neighborhood context.

        It says here that the unique dynamics within Cleveland’s unfolding gentrification can position
        the city to be a model in the development of the equitable, integrated neighborhood. It is a
        model that can eventually be scaled citywide.
        Unlike in New York, San Francisco, Chicago, etc., Cleveland’s “gentrifying” areas are becoming at once
        younger, less white, and more minority. That is, Cleveland’s gentrification is a process of middle class
        reinvestment into areas that are simultaneously diversifying. Table 2 shows the Cleveland neighborhoods
        experiencing the top young adult growth. Collectively, these six neighborhood’s white population
        declined from 1990 to 2010 by 21%, whereas the percent change in blacks for the gentrifying
        neighborhoods increased by 103%, though the city as whole saw its black population decrease by 13%.
        The Hispanic population increased by 58% in these neighborhoods, compared to 15% for the city. For
        Asians, the increase was 79%, vs. 12% citywide.

Table 2: Gentrifying Neighborhoods Becoming More Racially Diverse
                     White, White, Black, Black, Asian, Asian, Hispanic, Hispanic, White Black           Hispanic Asian
                     number, percent, number, percent, number, percent, number, percent, Percent Percent Percent Percent
Neighborhood         2010     2010    2010    2010     2010     2010    2010      2010     Change Change Change Change
Downtown                 4004     44%    4088     45%       707      8%       288       3%     87%   76%     172%      470%
Ohio City                4593     50%    3135     34%       137      1%      2107      23%    -27%   25%     -23%      136%
Tremont                  4274     62%    1583     23%        74      1%      1455      21%    -32%   34%     -23%        95%
Kamms Corners           16223     89%    1022      6%       324      2%       971       5%    -19%  680%     216%        56%
Old Brooklyn            26224     82%    2559      8%       435      1%      4414      14%    -23%  675%     432%        20%
Edgewater                4941     65%    2015     26%       151      2%       686       9%    -36%  227%      64%       -35%

        One reason for this unusual pattern relates to the housing crisis in Cleveland, which may have created for
        lower barriers of entry into neighborhoods that were historically “no go’s” for minorities. Migration from
        the historically black East Side to the historically white West Side nearly doubled from 11% to 20% in

        37
           See: http://www.theatlanticcities.com/jobs-and-economy/2013/01/more-losers-winners-americas-new-economic-geography/4465/
        38
           See: http://www.theatlanticcities.com/housing/2013/10/what-we-havent-figured-out-question-gentrification/7166/
        39
           See: http://www.theatlanticcities.com/housing/2013/08/what-happens-when-critics-gentrification-are-gentrifiers-themselves/6468/
White Paper: From Balkanized Cleveland to Global Cleveland
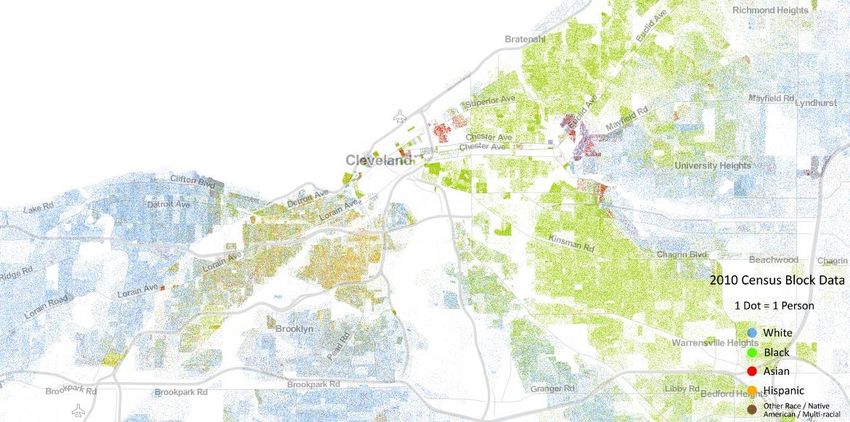
Image 2 Organic Diversity in Cleveland
the last decade. Combine this desegregation patterning with the fact that younger suburban whites are
crossing into the city limits to live, and what you have is a nascent rewiring of Cleveland’s historic
divides between suburb vs. city and white vs. non-white. Just as repatriates, native-born newcomers, and
the foreign born connect Cleveland to the world, inter-regional migration that mixes class and race
connects Cleveland to itself. Image 2 visualizes the diversification occurring, particularly on the Near
West Side.
Writer Afi-Odelia Scruggs recently chronicled this emergent racial mixing in the piece “River Crossings”
for Cleveland Magazine.40 “I joked that the Cuyahoga River might as well be the Red Sea, because
getting Clevelanders to cross it took an act of God,” notes Scruggs. She speaks to a number of younger
African Americans, like small business owner Ra Washington, who have moved into the West Side.
Noting the generational difference in perceptions of the city, Scruggs writes:
Washington says he runs into folks who think like his aunt: The neighborhood isn’t for them. But he
brushes them off. They’re the old-timers who lived through white flight and the Hough riots, not the 20-
somethings who wear skinny black jeans, have sleeve tattoos and browse the store for crime novels and
fiction.
“The younger people weren’t part of that, so they have no concept of the racial history,” Washington
says. “They want to talk about the now.”
Nonetheless, ensuring this organic diversification continues in the face of increasing investment is the
challenge of the day, not just in Cleveland, but for the whole of urban America. To date, no city has
40
See: http://goo.gl/Z5Cl8GWhite Paper: From Balkanized Cleveland to Global Cleveland systematically ensured a process of policies that prioritizes the long-term benefits of integrated, equitable communities over the short-term benefits of consumer-driven gentrification. The benefits include increased economic mobility for individuals who grow up in integrated neighborhoods. For instance, a new study called “The Equality of Opportunity Project”41 found that Cleveland ranked 45th out of 50 metro areas in terms of upward mobility, meaning a child in Cleveland raised in the bottom fifth of an income class only has a five percent chance of rising to the top fifth in her lifetime. The study, however, concludes that “upward mobility tended to be higher in metropolitan areas where poor families were more dispersed among mixed-income neighborhoods”. Such demographic shifts in Cleveland and other Rust Belt cities can change long-term economic trajectories, but only if policies and strategies are institutionalized so that urban infill does not entail re- segregating the city through the construction of creative class enclaves. Bowling with Strangers In the book “Bowling Alone”, author Robert Putnam laments the decline of social capital, or the power of groups, that has occurred in America across time. Putnam, a Port Clinton, Ohio native, states an overemphasis on individualization—and the breakdown of civic society and the “old neighborhood”—has contributed to the decline of the middle class, suggesting recently that the lack of “egalitarian ethos…of the 1950’s” has enabled economic inequality to worsen42. In many respects, traditional efforts at community revitalization—particularly through federal programs like Choice Neighborhoods43 that are implemented in America’s most segregated, poverty-stricken areas—is aimed at building a sense of the “old neighborhood” back. But such retention measures, while laudable, have not succeeded at turning around communities, if only because—while social capital may increase—the neighborhoods still act “as lonely islands” cut-off from the global economy44. Why have such retention strategies struggled? What is missing is Stafford’s finding in “Why the Garden Club Couldn’t Save Youngstown”, or that too much social capital can be just as bad as not enough; that is, too much trust in others like you can parallel not enough trust in others unlike you, leading to immobility, insularity, and stagnation of ideas. What Cleveland needs is less social capital, or more outsiders and natives crossing psychogeographic divides that have served to Balkanize Cleveland. As noted, such movement is beginning to unfold. The catch here is that simply diversifying a neighborhood won’t necessarily lead to evolving communities and a deepening urban network. For instance, how diversity is playing out in D.C.45: Both groups [whites and blacks] feel entitled and resent the other’s sense of entitlement. Over time the neighborhood’s revitalization engineers a rigid caste system eerily reminiscent of pre-1965 America. You see it in bars, churches, restaurants and bookstores. You see it in the buildings people live in and where people do their shopping. In fact, other than public space, little is shared in the neighborhood. Not resources. Not opportunities. Not the kind of social capital that is vital for social mobility. Not even words. 41 See: http://obs.rc.fas.harvard.edu/chetty/website/IGE/Executive%20Summary.pdf 42 See: http://opinionator.blogs.nytimes.com/2013/08/03/crumbling-american-dreams/ 43 See: http://portal.hud.gov/hudportal/HUD?src=/program_offices/public_indian_housing/programs/ph/cn 44 See: http://blog.metrotrends.org/2013/08/city-neighborhoods-lonely-island/ 45 See: http://nextcity.org/culture-livability/entry/forefront-excerpt-separate-and-unequal-in-d.c
White Paper: From Balkanized Cleveland to Global Cleveland

What is occurring relates to a recent controversial finding of Putnam’s that shows that diversifying
neighborhoods can act as environments that decrease social capital too much. “People living in ethnically
diverse settings appear to ‘hunker down’”, writes Putnam, or “to pull in like a turtle”46.
Part of the reason for this is that neighborhood diversity can equate to living “by” each other and not
“with” each other. This is because neighborhood integration is still raw in the American zeitgeist, with
heterogeneity, according to Putnam, engendering mistrust. A next step is needed. Here, community
leaders should heed lessons from the concept of “creative destruction” in the private sector. From the
article “The Downside of Diversity”47:
If diversity, at least in the short run, is a liability for social connectedness, a parallel line of emerging
research suggests it can be a big asset when it comes to driving productivity and innovation…
… [T]hose in more diverse communities may do more bowling alone, but the creative tensions unleashed
by those differences in the workplace may vault those same places to the cutting edge of the economy and
of creative culture.
In other words, the same process that leverage heterogeneity in the marketplace to evolve innovation can
be used in city making to evolve communities. This, then, represents a key opportunity for Cleveland
to reconstitute a new neighborhood model by harnessing the potential inherent in its diversifying
neighborhoods. This opportunity is greater in Rust Belt communities given—as of yet—the absence of
housing market pressure that tends to filter people along similar demographic lines. The mission is
simple: how can cities foster mobility without a sacrifice of trust? Or, how can diverse neighborhoods
become more socially integrated?

The answer entails thinking about social capital in a new way: neither a presence nor absence
of it, but a continuum of social capital with insularity based on comfortability on one end, and
insularity based on mistrust on the other. The sweet spot of social capital is somewhere in the
middle, which entails not bowling with your buddies or bowling alone, but bowling with strangers—until
they no longer aren’t.
Tactics to foster “bowling with strangers” are common in community development. For instance, Kauser
Razvi, Principal of Strategic Urban Solutions, created a public “Third Space” called “Literary Lots” that
used storytelling and placemaking to foster family interaction in Ohio City48. Ohio City Inc. has helped
implement T-ball and soccer, which is bringing a mix of residents together on a continual basis49. In
Collinwood, Zoetic Walls, a series of ongoing murals by internationally-renowned street artists, is getting
a divided neighborhood of older ethnic groups and African Americans talking, with the art, which some
see as provocative, acting as the vessel of social capital change50.
While such community programming is common, it is often implemented in a piecemeal fashion,
untethered to a theory of change. The current paper bridges micro tactics to macroeconomic theory at the
level of the neighborhood. Put simply, where people live informs them no less than where they work or
go to school. Neighborhoods are factories of human capital. Equitable, integrated environments maximize

46
   See: http://www.boston.com/news/globe/ideas/articles/2007/08/05/the_downside_of_diversity/?page=full
47
   See: Ibid
48
   See: http://literarylots.org/
49
   See: http://vimeo.com/47909938
50
   See: http://www.coolcleveland.com/blog/2013/09/controversy-in-collinwood/
White Paper: From Balkanized Cleveland to Global Cleveland
potential. America needs to go past the gentrification model of revitalization. The cities that still have a
fighting chance, like Cleveland, should lead.
Summary
The current paper provides a macroeconomic theory that can guide Cleveland’s revitalization. While the
literature described previously is substantive, the takeaways that can lead to an actionable plan going
forward are relatively straightforward. They include:
Takeaway 1: Knowledge and information are the driver of the modern economy, those cities
without migration “churn”, or demographic dynamism, are at a significant disadvantage.
Takeaway 2: Cities lacking churn need to increase it. Demographic research methods that “peek
under the hood” can identify microtrends of growth, even into so-called “shrinking cities”. These
microtrends need to mapped and understood—i.e., what are the “push” and “pull” factors driving
migration—so that strategies can be implemented to grow and leverage the inflow. Sources of
churn include native-born newcomers, Cleveland repatriates, or the foreign born.
Takeaway 3: The economic importance of migrants is not simply to grow a city’s consumptive
capacity, but rather to broaden a city’s global interconnectivity.
Takeaway 4: Due to the regional disadvantages related to the housing crisis and population
decline, gentrification into Cleveland’s core neighborhoods provides an opportunity, as the areas
are becoming at once younger and more diverse—and thus are ideal to test a set of policies and
strategies that can ensure diversity remains.
Takeaway 5: Diversity does not equal integration. To create new forms of community and social
capital leaders need to ensure “creative class” enclaves do not negate the economic potential of
integrating societies. To date, such neighborhood innovation, termed “bowling with strangers”,
has not been institutionalized and scaled, primarily due to a lack of theoretical context.White Paper: From Balkanized Cleveland to Global Cleveland
Appendix A
Total Out-Migrants (2000-2010)
Rank Geography Total
1 New York-Northern New Jersey-Long Island, NY-NJ- 3838366
PA
2 Los Angeles-Long Beach-Santa Ana, CA 3444804
3 Washington-Arlington-Alexandria, DC-VA-MD-WV 2017509
4 Chicago-Joliet-Naperville, IL-IN-WI 1983707
5 Dallas-Fort Worth-Arlington, TX 1635291
6 San Francisco-Oakland-Fremont, CA 1575588
7 Atlanta-Sandy Springs-Marietta, GA 1497626
8 Miami-Fort Lauderdale-Pompano Beach, FL 1481684
9 Riverside-San Bernardino-Ontario, CA 1401677
10 San Diego-Carlsbad-San Marcos, CA 1342453
11 Boston-Cambridge-Quincy, MA-NH 1302148
12 Houston-Sugar Land-Baytown, TX 1274308
13 Philadelphia-Camden-Wilmington, PA-NJ-DE-MD 1240325
14 Phoenix-Mesa-Glendale, AZ 1152549
15 Seattle-Tacoma-Bellevue, WA 1139950
16 Detroit-Warren-Livonia, MI 999499
17 Tampa-St. Petersburg-Clearwater, FL 917908
18 Orlando-Kissimmee-Sanford, FL 904867
19 San Jose-Sunnyvale-Santa Clara, CA 885110
20 Virginia Beach-Norfolk-Newport News, VA-NC 869140
21 Denver-Aurora-Broomfield, CO 859914
22 Baltimore-Towson, MD 815779
23 Minneapolis-St. Paul-Bloomington, MN-WI 775629
24 Las Vegas-Paradise, NV 695122
25 Portland-Vancouver-Hillsboro, OR-WA 641152
26 Sacramento--Arden-Arcade--Roseville, CA 637936
27 St. Louis, MO-IL 632837
28 San Antonio-New Braunfels, TX 630724
29 Kansas City, MO-KS 587046
30 Charlotte-Gastonia-Rock Hill, NC-SC 558221
31 Austin-Round Rock-San Marcos, TX 555291
32 New Orleans-Metairie-Kenner, LA 543462
33 Jacksonville, FL 526554
34 Columbus, OH 524426
35 Cleveland-Elyria-Mentor, OH 514938White Paper: From Balkanized Cleveland to Global Cleveland
Appendix B
Total In-Migrants (2000-2010)
Rank Geography Total
1 New York-Northern New Jersey-Long Island, NY-NJ- 2312963
PA
2 Los Angeles-Long Beach-Santa Ana, CA 2271082
3 Atlanta-Sandy Springs-Marietta, GA 2006179
4 Washington-Arlington-Alexandria, DC-VA-MD-WV 1995236
5 Dallas-Fort Worth-Arlington, TX 1961164
6 Riverside-San Bernardino-Ontario, CA 1885699
7 Phoenix-Mesa-Glendale, AZ 1545691
8 Houston-Sugar Land-Baytown, TX 1537245
9 Chicago-Joliet-Naperville, IL-IN-WI 1519873
10 Miami-Fort Lauderdale-Pompano Beach, FL 1340548
11 San Francisco-Oakland-Fremont, CA 1285969
12 San Diego-Carlsbad-San Marcos, CA 1229989
13 Tampa-St. Petersburg-Clearwater, FL 1160700
14 Philadelphia-Camden-Wilmington, PA-NJ-DE-MD 1153175
15 Seattle-Tacoma-Bellevue, WA 1150911
16 Orlando-Kissimmee-Sanford, FL 1083555
17 Boston-Cambridge-Quincy, MA-NH 1069379
18 Las Vegas-Paradise, NV 958290
19 Denver-Aurora-Broomfield, CO 936574
20 Virginia Beach-Norfolk-Newport News, VA-NC 866456
21 San Antonio-New Braunfels, TX 809795
22 Baltimore-Towson, MD 801131
23 Charlotte-Gastonia-Rock Hill, NC-SC 767973
24 Sacramento--Arden-Arcade--Roseville, CA 766128
25 Minneapolis-St. Paul-Bloomington, MN-WI 757669
26 Austin-Round Rock-San Marcos, TX 743381
27 Portland-Vancouver-Hillsboro, OR-WA 729497
28 Detroit-Warren-Livonia, MI 705686
29 San Jose-Sunnyvale-Santa Clara, CA 666364
30 Jacksonville, FL 641105
31 Kansas City, MO-KS 627975
32 St. Louis, MO-IL 612685
33 Raleigh-Cary, NC 564982
34 Columbus, OH 561817
35 Nashville-Davidson--Murfreesboro--Franklin, TN 561758
44 Cleveland-Elyria-Mentor, OH 399513White Paper: From Balkanized Cleveland to Global Cleveland Appendix C
White Paper: From Balkanized Cleveland to Global Cleveland

        Appendix D
                         Metros with Top In Migration for Cleveland-Elyria-Mentor, OH (2000-2010)

Rank    Geography                       2000    2001   2002      2003 2004     2005   2006   2007   2008   2009   2010   Total
    1   Akron, OH                       5261    5265   5195      5182 5506     5164   5386   5104   5121   5474   5190   57848
    2   Columbus, OH                    1542    1569   1580      1509   1418   1501   1456   1309   1550   1387   1246   16067
    3   Youngstown-Warren-              1026     939     879      840    835    902    910    860    890    904    716    9701
        Boardman, OH-PA
    4   New York-Northern New            749     798     804      800    764    840    692    989    860    727    745    8768
        Jersey-Long Island, NY-NJ-
        PA
    5   Chicago-Joliet-Naperville,       898     833     969      848    805    767    758    683    690    602    600    8453
        IL-IN-WI
    6   Toledo, OH                       664     757     690      739    742    690    640    723    784    670    639    7738
    7   Sandusky, OH                     682     737     742      673    741    694    655    665    637    656    608    7490
    8   Detroit-Warren-Livonia, MI       637     612     674      555    599    567    688    529    739    597    526    6723
    9   Canton-Massillon, OH             647     625     579      554    508    588    548    443    551    590    584    6217
   10   Pittsburgh, PA                   707     690     672      488    508    531    539    510    441    427    399    5912
   11   Cincinnati-Middletown, OH-       573     618     544      527    517    550    545    526    440    474    473    5787
        KY-IN
   12   Los Angeles-Long Beach-          448     363     337      400    400    340    382    456    403    352    317    4198
        Santa Ana, CA
   13   Washington-Arlington-            340     372     368      355    380    290    358    392    345    292    234    3726
        Alexandria, DC-VA-MD-
        WV
   14   Miami-Fort Lauderdale-           306     303     425      273    263    361    373    357    401    361    269    3692
        Pompano Beach, FL
   15   Atlanta-Sandy Springs-           290     291     309      346    287    300    322    317    390    362    351    3565
        Marietta, GA
   16   Phoenix-Mesa-Glendale, AZ        293     348     299      214    282    331    341    311    331    314    302    3366

   17   Tampa-St. Petersburg-            272     249     311      338    263    219    286    417    300    359    324    3338
        Clearwater, FL
   18   Dayton, OH                       312     299     324      345    253    346    287    288    287    269    222    3232
   19   Boston-Cambridge-Quincy,          217     212     265     217    250    295    265    247    241    203    222    2634
        MA-NH
   20 Philadelphia-Camden-                280     272     249     207    229    258    193    305    160    273    166    2592
        Wilmington, PA-NJ-DE-MD
Source: Telestrian, via Internal Revenue Service, 2000 to 2010
You can also read