Funding for Justice 2008 to 2018: Justice in the age of austerity - Professor Martin Chalkley - The Bar Council
←
→
Page content transcription
If your browser does not render page correctly, please read the page content below
Funding for Justice   1

Funding for Justice 2008 to 2018:
Justice in the age of austerity

Professor Martin Chalkley

Published for the Bar Council of England & Wales

November 1, 2018

                                                             1
2 Funding for Justice
Contents
1. Author 3
2. Introduction 4
3. Scope and background 5
Jurisdictions 5
Spending on the justice system and access 5
The economy 6
Government expenditure 7
Ministry of Justice expenditure 9
Crown Prosecution Service expenditure 9
Commentary 9
4. Tax-payer funding for different elements of justice 13
Cautions and caveats 13
Summary by key areas 14
Commentary 15
5. User charges and funding 16
Commentary 17
6. Summary and future research 18
Appendix 1: Technicalities 20
Appendix 2: Data used for comparison across functions 23
2Funding for Justice 3
1. About the author
Martin Chalkley is a professor of economics at the University of York. He has worked
on justice issues, legal aid and remuneration since 1995 when he was one of the
architects of the original Advocates’ Graduated Fees Scheme. Since then he has worked
with the Bar Council, Ministry of Justice and CPS in respect graduated fees for criminal
and family advocates. He has advised on equality and diversity matters, training for the
Bar and pupillage. His primary academic work is on the economics of health care,
incentives and public funding.
34 Funding for Justice
2. Introduction
Providing a justice system and access to it are fundamental functions of the state. These
functions are not luxuries or extravagances but are necessary to a well-functioning
society and economy. For England and Wales, oversight of this provision rests with the
Ministry of Justice which, like many government departments, has been subject to
austerity measures brought about as a consequence of the 2008 financial crisis.
The purpose of this paper is to provide an overview of the effects of austerity on the
resources that government has devoted to the justice system. It will come as no surprise
to learn that resources have been reduced over the period 2008-2018, but the extent of
the reduction, where it has been focused and the potential implications of that in the
context of viewing this area of expenditure as an investment in a well-functioning and
fair society, have not hitherto been described. In the broader view, an under-resourced
justice system imposes costs on society and damages economic welfare. Short-term
savings may result in long-term burdens.
It is hoped that this paper will provide impetus for further research on this topic and
stimulate a debate regarding how to best present an economic case for greater
investment in the justice system.
The structure of the paper is as follows. Section 2 sets out the overall economic context,
including how the economy has performed, what government spending has been – both
in total and according to functional headings – and how spending on the justice system
compares to these. Some technical issues involved in collating and interpreting the data
that are used are detailed in Appendix 1.
Within the overall envelope of expenditure, it is possible to separate out some key and
important elements of spending on the justice system. The essential infrastructure of
courts, judges and associated judicial services; the provision of access to justice for
those without means and the custodial and rehabilitation services associated with
criminal justice are different elements of the state’s provision of a justice system.
Section 3 considers how these elements have fared differentially.
One implication of reduced public funding support for access to justice is that private
citizens are required to contribute more. There are multiple aspects to this; increased
expenditure on privately financed professional legal services; increased reliance on
self-help including becoming a litigant-in-person and increased charges being paid for
4Funding for Justice 5
the use of the justice system (through court fees and other user charges). Section 4 sets
out some figures in relation to the last of these.
Section 5 summarises findings and makes recommendations for future research.
3. Scope and background
Jurisdictions
Any attempt to understand the nature and extent of funding of the justice system in the
United Kingdom encounters a number of institutional and reporting complexities.
Whilst much economic data is gathered and reported at the UK level, a number of
functions of the state are devolved and reported upon separately for the constituent
countries, especially Scotland. The justice system considered in this paper is that of
England and Wales, but it is easier to express expenditures in relation to overall UK
government spending and UK national income.
Spending on the justice system and access
The justice system comprises many elements and as such there are numerous
departments and agencies of government that have a role to play in its provision. The
main focus in this paper is on the role played by the Ministry of Justice, which is
charged with implementing government policy in respect of the justice system of
England and Wales, and is responsible for the provision of legal aid, the court and
tribunal system and the detention and rehabilitation of offenders. The prosecution of
the most serious criminal offences is the responsibility of the Crown Prosecution
Service and its expenditure over the last 10 years is also examined.
Other elements of what could broadly be called the justice system: the detection and
investigation of crime, the prosecution of some criminal offences, the provision of
services to support victims and witnesses, and the market for privately funded legal
services, are outside the remit of the Ministry of Justice and the Crown Prosecution
Service and are not considered here. That is not to say they are unimportant and should
be ignored, but simply that they fall outside the scope of this paper.
56 Funding for Justice
The economy
The financial crisis that began in 2008 is well-documented to have had a serious effect
on economies around the world. It is associated with reduced output and growth. In
particular, the years around the crisis saw output, as measured by the total value of
goods and services, actually decline.
In the 10 years since the onset of the crisis there has been economic growth. The overall
value of output of the UK economy in 2017 was approximately £2044bn. The estimate
for 2018 is £2100bn. Compared to 2008, this represents an increase of around 33 per
cent. Price inflation has been modest and amounts to approximately 18 per cent over
the 10 years. Real GDP, which is the value of goods and services after accounting for
the timing of the price changes, grew by approximately 13 per cent over the last 10
years. The underlying figures are depicted in Figure 1.
Figure 1: GDP in current and constant (2016) prices 2008-2018. Source: Office for
National Statistics
Whilst the last decade has been characterised as one of austerity, it is nevertheless a
period during which the economy has grown both in cash and in real terms. If the justice
system is seen as serving the economy, by providing the infrastructure and services that
6Funding for Justice 7
ensure well-functioning markets, respect for the law, individuals’ rights and property,
it would not be unreasonable to expect the justice system to grow along with the
economy.
There are reasons to suppose that the publicly funded elements of access to justice might
even be expected to increase over a period of austerity notwithstanding underlying
economic growth. Austerity has been associated with low wage growth and increasing
poverty amongst the most disadvantaged members of society1 who are most likely to
require state assistance in accessing justice.
Government expenditure
Austerity is closely associated with reduced public services driven by the need to reduce
government expenditure and debt.
In 2017, government expenditure (specifically Total Managed Expenditure) was
approximately £770bn or around 40 per cent of GDP. In 2008 expenditure was
approximately £606bn and again around 40 per cent of GDP. There have been
fluctuations in this proportionality between government expenditure and GDP over
time, but the figure is relatively stable. As the economy grows so does government
expenditure. This implies that in real terms government expenditure has also grown
over the period 2008-2018 by 13 per cent.
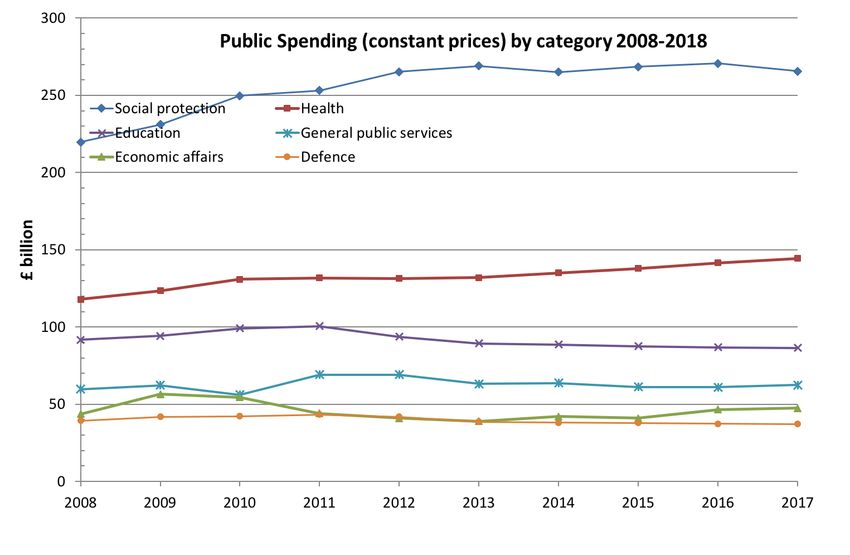
Public sector accounts break down expenditure by broadly defined functions; social
protection; health; education; general public services; economic affairs and defence.
The constant price pattern of real expenditure for these functions is depicted in Figure
2.
1
Research on this issue is reported in the article https://www.theguardian.com/commentisfree/2018/mar/14/austerity-poor-
disability-george-osborne-tories.
78 Funding for Justice
Figure 2: Public expenditure by function in constant prices 2008-2018. Source:
author’s calculations and ONS Statistical Release February 2018
An upward sloping line indicates growth in real expenditure for that category. Health
and social protection have shown a substantial real growth. For other categories, real
expenditure has been almost flat over this period. The figures for overall growth in real
expenditure from 2008 to 2018 are set out in Table 2.
Category Growth in real
expenditure
2008-2018
Social protection 23%
Health 25%
Education -5%
General public services 5%
Economic affairs 10%
Defence -6%
Table 2: Growth in real public expenditure from 2008 to 2018 by category. Source:
As in Figure 2.
8Funding for Justice 9
Ministry of Justice expenditure
Overall, the Ministry of Justice accounts for less than £10 billion, a little over 1 per cent
of total government spending.2 Against the broader setting of the economy and public
spending, how has the Ministry of Justice fared? Table 3 sets out one of key measures
of overall spending, Resource DEL for 2008 – 2018 in both nominal and real terms.
Total Resource Total Real Resource
Year DEL £billion DEL £billion(2016)
2008 8.84 10.08
2009 9.04 10.03
2010 8.96 9.82
2011 8.97 9.64
2012 8.89 9.42
2013 8.59 8.93
2014 8.11 8.29
2015 7.73 7.78
2016 7.35 7.35
2017 7.41 7.26
2018 7.63 7.36
% change -14% -27%
Table 3: Ministry of Justice total resource DEL, nominal and real, 2008-2018. Source:
Ministry of Justice annual reports and accounts (various) and author’s own
calculations.3
It is thus clear that the resources that the state has applied to the justice system and for
access to justice, through its main departmental mechanism, have declined over this
period both in cash and real terms. The overall reduction in real terms is approaching
30 per cent.
Crown Prosecution Service Expenditure
Overall expenditure of the Crown Prosecution Service is currently £0.5bn or around
0.05 per cent of government spending. Table 3a sets out how this expenditure has
evolved over the last 10 years.
2
This figure in contrast to the numbers in Table 2 includes the Ministry’s other income. See Section 5.
3
The figures in Table 2 are close but not identical to other reported measures showing the decline in Ministry of Justice
resources. For example, on page 8. Of the National Audit Office “Short Guide to the Ministry of Justice” there are figures for the
Ministry’s Net Cash Requirement. For 2013 this is £8.2billion compared with the £8.6 billion reported in the table. A number of
adjustments are made to move from Resource DEL to Net Cash Requirement, but these do not alter the measurement of changes
in funding over time. Resource DEL has the advantage that it is broken down by areas of activity that are reported in subsequent
sections of this paper.
910 Funding for Justice
Total
Resource Real Total
DEL Resource DEL
Year £billion £billion (2016)
2008 0.65 0.74
2009 0.65 0.72
2010 0.66 0.72
2011 0.62 0.67
2012 0.58 0.62
2013 0.56 0.58
2014 0.55 0.56
2015 0.51 0.51
2016 0.49 0.49
2017 0.49 0.48
2018 0.51 0.49
% change -22% -34%
Table 3a: Crown Prosecution Service total resource DEL, nominal and real, 2008-
2018. Source: Crown Prosecution Service annual reports and accounts (various) and
authors own calculations.
The picture revealed in these figures is similar to that for the Ministry of Justice. The
resources that the state has provided for the prosecution of serious criminal offences
has declined substantially both in cash and real terms. The decline is greater than for
the Ministry of Justice overall and amounts to 34 per cent in real terms – a loss of more
than one-third.
Over this same period there has been a substantial fall in the number of defendants
processed by the criminal magistrates’ courts and Crown Courts. For magistrates’
courts the reduction is 19 per cent; for the Crown Courts there has been a fall of 17 per
cent.4 Hence, there has been a substantial fall in the resources devoted to prosecution
per defendant.
Commentary
The period of austerity that has characterised the last 10 years is sometimes associated
with stagnant or falling economic activity. In fact, with the exception of the years
around the financial crisis the economy has grown in terms of the value of goods and
4
Source: Author’s calculations based on Criminal Justice Statistics, March 2018, Table 3.1 (Defendants dealt with by
magistrates’ courts and Crown Courts – All offences). Available here.
10Funding for Justice 11
services produced, but more importantly in real terms. That indicates that the economic
“cake” has become larger.
It is not the case that the Government’s share of that cake has shrunk. It has stayed
almost constant at around 40 per cent and hence the Government’s claim over resources
has also increased in real terms.
As might be expected, not all elements of government spending have increased in the
same proportions. One of the key aspects of the financial crisis was the need to bail-out
the financial sector through a purchase of debt. That process increased government
borrowing, increased debt servicing costs and placed severe constraints on further
government borrowing. Hence, many areas of public expenditure have been
constrained and have not increased in real terms; education and defence are notable
examples and have seen expenditures decline by 5 per cent in real terms. Nevertheless,
other categories of expenditure – health and social protection – have substantially
increased in real terms.
Against this backdrop the experiences of the Ministry of Justice and the Crown
Prosecution Service have been remarkably poor. Any real terms decrease in resources,
against the context of a growing economy, must be seen as an adverse outcome. There
is no reason to suppose that demand for justice overall or for access to justice has
declined over the last 10 years. To the contrary, increasing poverty and stagnant wages
might be associated with increasing demands and a growing economy indicates more
economic transactions that have to be regulated and sometimes mediated through legal
processes. And yet the Ministry of Justice has seen a 27 per cent reduction in its real
Resource DEL. This is a much greater reduction than in other areas of expenditure and,
by any standards, a huge loss. Even in cash terms the Resource DEL has fallen by 14
per cent. It is often this latter figure that attracts attention, but it masks the extent to
which real resources have been withdrawn. The number of defendants that the Crown
Prosecution Service has prosecuted through the courts has declined over this period by
around 20 per cent which indicates that real resources have declined in real terms per
defendant.
An observer might well conclude that the UK Government has taken a conscious
decision to substantially withdraw public funding for the support of the justice system
and for promoting access to justice.
1112 Funding for Justice
As noted at the start of this section, the Ministry of Justice has a broad range of
functions, some of which are delegated to agencies which it funds. The extensive, even
dramatic, decline in overall expenditure cascades down to these functions and the
agencies which support them. Just as not all areas of government expenditure are equal
in terms of funding changes, not all of the Ministry’s functions have experienced the
same reductions. Examining differences across functions is the purpose of Section 4 of
this paper.
12Funding for Justice 13
4. Tax-payer funding for different elements of justice
Cautions and caveats
A movement away from aggregate measures raises problems of comparability and
consistency. Institutional reforms result in changing the names, constitution and
responsibilities 5 of many of the constituent agencies, boards and organisations that
deliver various elements of the justice system under the direction of the Ministry of
Justice. Hence, tables of statistics vary over time in regard to the labelling and number
of entries. For this paper a few key selected headline rows have been selected for further
analysis and where it has been necessary the figures have been calculated from a
number of annual reports by aggregating over previously defined organisations. The
current terminology is used whilst the data may relate to a different terminology and
have been aggregated for consistency.
A more substantial issue arises in relation to understanding the total resources that are
available to perform a particular function (for example providing courts and tribunals)
as distinct from those that are made available through the Ministry of Justice. A number
of agencies have sources of revenue that are separate from the funds provided through
the Ministry. Mostly these revenues come from the charges that are raised for the use
of services or from recoveries that the agencies are able to make from the legal process,
such as cost recovery. There are additional revenues from fines and penalties, and in
the case of prisons from the sale of goods that are manufactured within prisons. This
section of the paper focuses only on the resources provided through Ministry and hence
is titled Tax-payer funding. Where, as has been the case, tax-payer funding has been
reduced, services may have been maintained or even expanded by reliance on fees and
charges. That process raises fundamental questions about the equity and coverage of
the justice system which is briefly addressed in Section 5. An obvious concern is that
individuals are deprived of professional services or of access to courts and the justice
system but undertake to represent themselves.
5
For example, the Legal Aid Board has transformed into the Legal Aid Agency and the National Offender Management Service
has become HM Prison and Probation Service. Tribunals which were previously a separate entry have been brought into HM
Courts and Tribunal Service.
1314 Funding for Justice
Summary by key areas
The data used for making comparisons across different functions is set out in Appendix
1. All figures are for Resource DEL and adjustments to real values are made using the
GDP deflator in Table 1.
Growth Growth
Cash Real
Policy, Corporate Services and Associated -78% -82%
Offices
National Offender Management Service - HM -7% -22%
Prison and Probation Service
HM Courts & Tribunals Service 55% 31%
Legal Aid Agency -19% -32%
Youth Justice Board -75% -79%
Criminal Injuries Compensation Authority -29% -40%
Criminal Cases Review Commission -25% -37%
Judicial Appointments Commission -30% -41%
Higher Judicial Salaries 14% -4%
Other -68% -73%
Total Resource DEL -14% -27%
Table 4: Growth (decline) in cash and real tax-financed expenditure on specific
functions and agencies 2008-2018. Source: Ministry of Justice Annual Reports for
years from 2011 to 2018 and author’s calculations.
Not surprisingly, given the very large decline in overall expenditure, most areas within
the Ministry of Justice funding domain have seen large, real terms, declines in Resource
DEL. Indeed, the only exception to this is HM Courts and Tribunals Service. The
figures in Appendix 1 show a more nuanced picture. This service was also subject to
declining cash and real expenditure up until 2016. Only in the last two years is that
trend reversed with substantial increases. These increases coincide with the
implementation of an ambitious and initially costly reform programme, the intention of
which is to streamline the court system, reduce the number of courts and implement
alternative mechanisms (virtual courts and digital working) to deliver the services of
courts. Hence, the last two years’ figures should be viewed as transitory and the longer-
term trend for the HM Courts and Tribunals Service tax-financed funding follows the
general pattern observed across other functions and agencies.
The picture for HM Courts and Tribunals Service is also complicated by the reliance
on fees and fines for funding of courts. Whilst Table 4 gives the contribution that the
Ministry of Justice makes to the funding of courts it does not show how overall
14Funding for Justice 15
expenditure on court services has evolved. Changes in both the accounting methods
and in the organisation of courts and tribunals make it difficult to establish consistent
figures for overall expenditure before 2010. Over the eight years from 2010 to 2018
expenditure on courts and tribunals has fallen from £1.96bn to £1.84bn – a decline of
six per cent. Accounting for inflation as elsewhere in this paper, this corresponds to a
17 per cent real decline. Netting out the increasing contribution to this funding of fees
and fines suggests that the decline in tax-payer funding for courts and tribunals has been
greater. The calculation of this greater overall figure is left to future investigation.
One consequence of increased expenditure by the Ministry of Justice in any one area,
such as the HM Courts and Tribunals Service, is that other areas will suffer even greater
losses. The big losers within the Ministry of Justice are: Legal Aid with a 32 per cent
real decline; the Youth Justice Board with a 79 per cent real decline; and other
Commissions and Authorities with between 37 and 41 per cent real declines.
Reorganisation and rationalisation of the administrative and policy functions of the
Ministry have seen expenditure on these decrease by more than 80 per cent in real
terms.
Commentary
The magnitude of the reduction in real expenditure by the Ministry of Justice makes it
inconceivable that the slack could be taken up by a combination of efficiency or
administrative savings. By examining the components of expenditure it can be seen that
the reductions have been wholesale across areas which correspond to front-line delivery
of services. This applies equally to court services where the recent increases are due to
longer term system reform rather than immediate service delivery and where
expenditure on the services of courts and tribunals has also decreased substantially in
real terms.
In the case of all of these areas of expenditure there is a priori reason to suppose that
the decline in resources will be reflected in a decline in the volume and quality of the
justice system and access to it. In respect of Legal Aid, for example, the reduction is a
combination of less people being assisted (through reductions in the scope of Legal Aid
support) and assistance being reduced (through lower fees and more restrictions on
costs) for those who are still eligible. In respect of other elements of the justice system
the primary source of cost is in wages and salaries for which there has been modest real
growth over the past ten years.
1516 Funding for Justice
5. User charges and funding
As noted in Section 4 the tax-financed funding received through the Ministry of Justice
can be augmented by a combination of fees, fines, recoveries from other government
departments and income from prison industries.
It has not been possible to find the detailed breakdown of these different elements of
income for the period under investigation. Neither has it been possible to attribute these
incomes to particular functions within the justice system. Hence, an aggregate summary
is reported here.
As tax-payer financing has declined the Ministry has become increasingly reliant on
other sources of income. These other sources comprised approximately 12 per cent of
total expenditure in 2008 and have risen to accounting for approximately 20 per cent of
income in 2018. That rise implies an increase of 34 per cent in real terms and 58 per
cent in cash terms. Hence, there is an increasing burden being placed on either the users
of the justice system or those who are subject to fines, or both of these. Fine income
appears to be broadly stable over the period so that a substantial part of the burden falls
on users. Aggregate court fees have, for example, increased by 27 per cent over the
period whilst as discussed above expenditure on courts has declined by six per cent.
The effect of the increase in other income sources is to offset some of the effects of the
decline in tax-payer funding for the justice system a whole. The relevant figures are set
out in Table 5.
2008 2018 Percentage
Change
Cash Terms (£billion) 8.8 7.6 -14%
Tax Funded Expenditure 1.2 1.9 58%
Other Income 10.0 9.5 -5%
TOTAL
Real Terms (£billion 2016)
Tax Funded Expenditure 10.1 7.4 -27%
Other Income 1.4 1.8 34%
TOTAL 11.5 9.2 -20%
Table 5: Ministry of Justice Expenditure 2008-2018 broken down by tax-financed and
other income in real and cash terms. Source: Ministry of Justice and HM Courts and
Tribunal annual reports and author’s own calculations.
16Funding for Justice 17
Commentary
The withdrawal of tax funding for the justice system and access has been accompanied
by an increasing reliance on other sources of income, some of which impose costs upon
the users of the system. Those increases have been substantial and must in all likelihood
inhibit access. However, the overall picture of a justice system in England and Wales
that is operating under substantially less resources than 10 years ago remains. Against
an economy that has grown 13 per cent in real terms, the justice system has declined by
20 per cent in real terms, even after accounting for increased resources from its users.
1718 Funding for Justice
6. Summary and future research
The analysis set out in this paper provides an overview of, and a context for
understanding, the changes in public funding of the justice system of England and
Wales over the last 10 years.
The context is important because it is sometimes assumed that the cuts endured in
funding for justice are an inevitable consequence of a decade of austerity and are
comparable to the experiences across all publicly funded services. It has been
demonstrated that neither assumption is correct. In spite of the financial crisis the UK
economy has grown in real terms. The Government has expanded its overall real
expenditure in line with that growth. The necessity of addressing the debt finance
resulting from the financial crisis has undoubtedly put pressure on publicly funded
services, but some like health have nevertheless benefited from increased real terms
resourcing whilst even those that have endured cuts have seen only modest reductions
in real resources.
In contrast the justice system as reflected in the expenditure of the Ministry of Justice
on frontline service provision and access to justice has seen massive real terms
reductions. In the context of an economy that has grown 13 per cent in real terms, tax-
financed funding for the Ministry has declined by 27 per cent. That is a huge withdrawal
of public finance support for what must be regarded as a fundamental and integral part
of the state’s functions and obligations. The withdrawal is ever greater for the Crown
Prosecution Service, being 34 per cent in real terms. Even after allowing for the
declining number of prosecutions this constitutes a withdrawal of resources from the
vital function of prosecuting alleged criminals.
The real terms reductions have applied almost across the board to different elements of
the justice system – to Legal Aid (32 per cent), the provision of court services (17 per
cent) and to numerous supporting agencies and boards tasked with preserving access
to justice and a high quality judicial system.
Accompanying reductions in tax-payer support, the justice system has placed
increasing reliance on user-charges and other sources of income that now constitute 20
per cent of total spending.
There has been little if any articulation or discussion of these important headline facts
and figures. The fundamental question is whether it is desired or desirable so to
18Funding for Justice 19
fundamentally reduce the public funding support for the justice system and access. If it
is not, then there must be acknowledgement of the fact that the cuts to justice are savage
and need to be addressed.
Suggested future research
The specifics of how funding cuts have impacted on services are important. Two
particular domains, Legal Aid and Court Services, would seem to warrant detailed and
serious investigation. Much is already known about the mechanisms underpinning the
cuts in Legal Aid which fundamentally have revolved around reducing the coverage of
the system and in reducing legal professionals’ fees, but a summary of Legal Aid
volumes and values broken down by different forms of assistance could usefully be
undertaken too.
In addition, an understanding of the functioning of the court system and how this is
reflected in published statistics is currently lacking. The HM Courts and Tribunals
Service annual reports are not particularly helpful in this regard – they change format
across years and are not accompanied by tables of statistics in downloadable form.
In the author’s view, HM Courts and Tribunals Service should commit to establishing
the best and most accessible sources of data to gain a better understanding of how the
volume and value of court services has evolved over the last 10 years and how user
charges have impacted on utilisation and access.
Expanding the available evidence base in these ways would lay the foundation for a
more ambitious but vitally important agenda. An adequately-funded justice system is
not a luxury but a pre-requisite for a well-functioning society.
1920 Funding for Justice
Appendix 1: Technicalities
Defining a year
The definition of a year to which data relates is complicated by reporting being done
mostly on the basis of financial years which overlap calendar years. For ease of
exposition the use of a single numbered year (e.g. 2018) should be interpreted as
referring to the financial year ending in the calendar year 2018. For some statistics
calendar years are the more natural unit, but the adjustments required to put everything
on a financial year basis are often small and do not add value or insight to the analysis.
Government reporting and data
Published statistics, especially the detailed figures which are used in this paper relating
to the Ministry of Justice and the Crown Prosecution Service, are produced to satisfy
reporting requirements specified by Parliament.
Concern about public sector expenditure and borrowing means that these requirements
are often focused on setting out the overall claim that a department makes on taxpayer
resources and this sometimes runs counter to understanding what contribution the
department makes to the overall provision of services. For example, the Ministry of
Justice annual reports only consistently provide a detailed breakdown of expenditure in
the Public expenditure core financial tables. Table 1, in these reports sets is headed
“Total Departmental Spending” and breaks down spending according to both a number
of headings and according to definitions such as Resource Departmental Expenditure
Limits (DEL) and Resource Annually Managed Expenditure (AME). A guide to this
reporting framework can be viewed here.
Some of the figures reported do indeed relate to actual expenditure but others net out
from that expenditure any revenues that are received in relation to it. Hence what
appears as expenditure is actually expenditure net of some receipts. This applies to
Legal Aid and HM Courts & Tribunal Service, for example. The effect can be illustrated
by comparing the summary figures of spending on one basis with the other. In the
annual report for 2016-17 expenditure on the Legal Aid Agency is given on page 9 as
£1.88bn whereas total expenditure being the sum of Resource DEL and Resource AME
(from Table 1 on page 158-159) is £1.72bn. The difference is largely accounted for by
receipts in the form of contributions.
Whilst the differences in the figures arrived at in any one particular year can be
substantial and make it difficult to reconcile the reports of the Ministry of Justice with
20Funding for Justice 21
those of its agencies, the impact on measures of the trend growth or decline in
expenditure are largely unaffected by which definition is used. An exception is where
revenues have been expanded and issue of revenues (user fees and charges) is dealt
with separately in Section 5. For the remainder of this paper expenditure is mostly
reported on the basis of Resource DEL which gives a consistent basis for making
comparisons across time, and closely tracks other definitions of expenditure.
Changing prices
A comparison of financial data over time has to take account of changing prices. The
adjustment of a monetary value to account for changing prices usually involves
reducing (deflating) that value by the extent of price increases. The resulting figure is
variously described as being in constant prices (as compared to current prices) or as
being in real terms (compared to being in nominal terms). The question of which price
changes to measure is often contentious. The ideal is to have a price index that reflects
the particular goods and services whose value is being measured but that is seldom
available, so that more general economy-wide price indices are used.
Since this paper focuses on government expenditures and the services being provided
are not marketed the use of a consumer-oriented price index is inappropriate.
Henceforth price adjustments are made using the GDP Deflator which is a measure that
reflects the prices of all goods and services that form a part of the measurement of Gross
Domestic Product. The relevant details can be found here. The deflator series is indexed
to 2016 prices, equal to 100, and is detailed in Table 1.
GDP
Year Deflator
2008 87.7
2009 90.1
2010 91.3
2011 93.0
2012 94.3
2013 96.3
2014 97.8
2015 99.3
2016 100.0
2017 102.0
2018 103.6
Appendix Table 1: Price index used for calculating constant (2016) price values;
Source UK Government Statistics
2122 Funding for Justice
VAT and tax
A concern is sometimes expressed that measuring government expenditures which
include an element of VAT overstates the extent of commitment that is being made.
Whilst it is true that part of expenditure will in fact flow back to government, the
convention is to record all expenditures gross of taxes. This is a complex topic and in
practical terms it is very difficult to establish the net effect on government finances of
different elements of spending. If the government purchases services or goods some
(but not all because suppliers claim back VAT on their inputs) of the VAT paid will
flow back to the Treasury. The same applies to payments made to individuals who
subsequently spend on goods (and thus generate VAT) and pay taxes on their income.
The expenditures reported in this paper are those that the departments or agencies
concerned report and will include taxes paid.
22Funding for Justice 23
Appendix 2: Data Used for Comparison across functions
Resource DEL £000 2008 2009 2010 2011 2012 2013 2014 2015 2016 2017 2018
Policy, Corporate Services and Associated
Offices 571,784 559,772 528,224 489,563 1,036,308 880,079 766,491 905,456 666,985 (100,468) 123,413
National Offender Management Service - HM
Prison and Probation Service 4,003,517 4,193,407 4,173,617 4,056,421 3,493,446 3,533,100 3,580,997 3,480,153 3,660,493 3,722,864 3,709,003
HM Courts & Tribunals Service 1,016,891 1,068,979 1,071,599 1,092,170 1,091,883 1,203,496 1,027,975 944,099 833,483 1,565,064 1,576,656
Legal Aid Agency 2,081,515 2,200,195 2,180,818 2,320,497 2,183,985 2,041,537 1,970,043 1,735,858 1,611,142 1,639,385 1,680,067
Youth Justice Board 418,399 485,953 471,009 454,457 377,819 326,766 224,345 191,467 164,546 149,432 104,755
Criminal Injuries Compensation Authority 210,320 287,300 272,234 301,576 450,036 345,651 262,109 194,650 139,789 135,229 148,812
Criminal Cases Review Commission 6,988 6,792 6,973 6,185 5,283 4,876 5,173 5,504 5,298 5,349 5,240
Judicial Appointments Commission 6,946 8,143 7,534 6,201 5,013 4,921 4,202 4,032 3,832 3,622 4,852
Higher Judicial Salaries 130,236 139,854 144,255 143,281 142,039 152,513 148,610 148,066 149,465 152,165 148,407
Other 389,106 88,648 105,587 97,968 109,169 100,378 120,136 118,738 113,076 133,289 125,889
Total Resource DEL 8,835,702 9,039,043 8,961,850 8,968,319 8,894,981 8,593,317 8,110,081 7,728,023 7,348,109 7,405,931 7,627,094
Real Resource DEL £000(2016) 2008 2009 2010 2011 2012 2013 2014 2015 2016 2017 2018
Policy, Corporate Services and Associated
Offices 652,152 621,279 578,559 526,412 1,097,784 914,843 783,733 911,839 666,985 (98,498) 119,125
National Offender Management Service -
HM Prison and Probation Service 4,566,235 4,654,170 4,571,322 4,361,743 3,700,684 3,672,661 3,661,551 3,504,686 3,660,493 3,649,867 3,580,119
HM Courts & Tribunals Service 1,159,821 1,186,436 1,173,712 1,174,376 1,156,656 1,251,035 1,051,099 950,754 833,483 1,534,376 1,521,869
Legal Aid Agency 2,374,084 2,441,948 2,388,629 2,495,158 2,313,543 2,122,180 2,014,359 1,748,095 1,611,142 1,607,240 1,621,686
Youth Justice Board 477,207 539,349 515,892 488,663 400,232 339,674 229,392 192,817 164,546 146,502 101,115
Criminal Injuries Compensation Authority 239,882 318,868 298,175 324,275 476,733 359,305 268,005 196,022 139,789 132,577 143,641
Criminal Cases Review Commission 7,970 7,538 7,637 6,651 5,596 5,069 5,289 5,543 5,298 5,244 5,058
Judicial Appointments Commission 7,922 9,038 8,252 6,668 5,310 5,115 4,297 4,060 3,832 3,551 4,683
Higher Judicial Salaries 148,541 155,221 158,001 154,066 150,465 158,537 151,953 149,110 149,465 149,181 143,250
Other 443,797 98,388 115,648 105,342 115,645 104,343 122,838 119,575 113,076 130,675 121,514
Total Resource DEL 10,077,611 10,032,234 9,815,827 9,643,354 9,422,649 8,932,762 8,292,516 7,782,501 7,348,109 7,260,717 7,362,060
2324 Funding for Justice
24You can also read