Future Mobility Scenarios for Hamburg, Germany
←
→
Page content transcription
If your browser does not render page correctly, please read the page content below
27th ITS World Congress, Hamburg, Germany, 11-15 October 2021

                                              Paper ID #

                Future Mobility Scenarios for Hamburg, Germany

  Laura Bieker-Walz1 , Ihab Kaddoura2 , Zhuoxiao Meng2 , Michael Ortgiese1,2 , and Peter Wagner1,2,*
                              * Corresponding
                                            author: peter.wagner@dlr.de
                          1 Institute
                                 of Transportation Systems, DLR, Germany
 2 Department of Transport Systems Planning and Telematics, Technische Universität Berlin, Germany

Abstract This contribution describes the set-up for performing a simulation-based assessment of four
future scenarios for the mobility in the Greater Hamburg area, Germany. It is based on work done
within the project ”Real-Lab Hamburg”, which is presented elsewhere in this ITS World Congress. The
approach performed in this project mixes different approaches for such a future mobility system so that
they may reinforce each other. It also presents a combination of more conventional, and more speculative
approaches like automated driving.
Currently, few results are available, but at the time of the conference, the scenarios will have been simu-
lated and analyzed.
Keywords: Future mobility · agent-based simulation · assessment

Introduction

The future of mobility may look very different from today, two of the more important threads are the
Mobility as a Service (MaaS) and autonomous vehicles and autonomous transport. Especially regarding
the latter, there is a lot of excitement, and a huge flow of scientific papers that deal with the prospects
and ramifications of autonomous transport [1–3].
Here, a more modest approach is taken (with one exception) where we rely in most of the cases on
methods that are currently in the field, although in a more conceptional phase.
The exception is the scenario described in more detail below, where we assume that most of the private
transport will be substituted by a fleet of shared vehicles (sometimes named DRT = demand-responsive
transit) that also offers shared and non-shared trips where the transport vessels may have different sizes.
It is clear, that mobility systems needs to become CO2 -neutral in a very short amount of time. Currently,
they are far from it, for Germany it is known that for 2030, the transport sector should emit about 31%
of CO2 less compared to 1990, this amount to 67 million tons CO2 to be saved annually.

Real-Lab Hamburg
This work is being done within the German project Real-Lab Hamburg. It consists of 11 sub-projects, the
ones important for the simulation scenarios will very shortly characterized below. They are picked for
their technology readiness, since they are going to presented separately at this ITS World Congress. Of
course, they are not meant to be a complete set of examples of future mobility, neither is this description
a complete one.

Communication
This will not be part of the scenarios, but we think it is important as well: The project has invested in
research toward an advanced participation procedure in order to take into account citizens’ and end users’
needs as well as their ideas for future mobility. Moreover, a comprehensive communication strategy is
being developed to win people over to the project goals of a sustainable and digital mobility. The details
are described in a companion paper submitted to this conference [4]. Here, it is sufficient to know that
this sub-project sports what is known as a mobility lab in which the project team enables groups of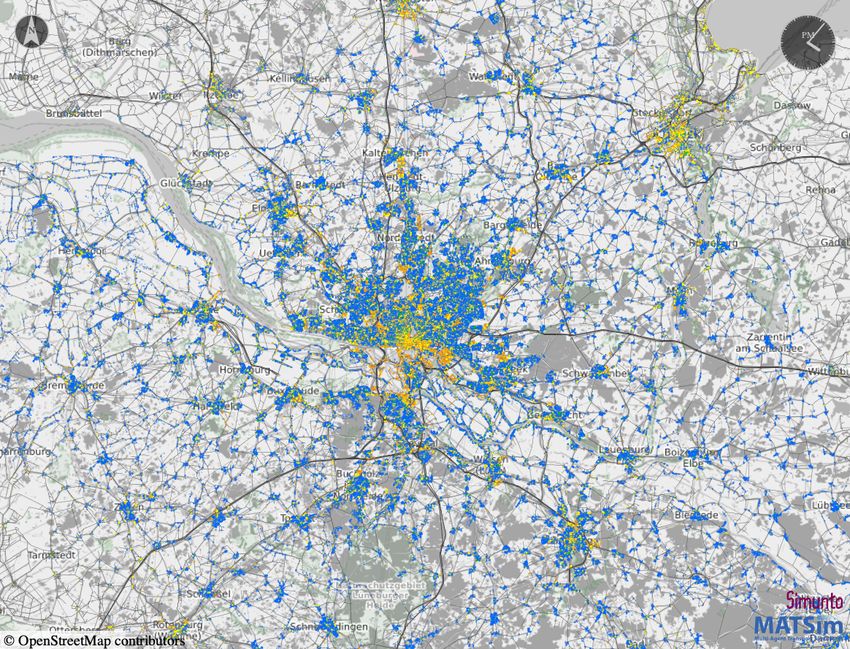
citizens to develop ideas for the future mobility of Hamburg. The results will then be analyzed and
communicated to different relevant stakeholder groups (e. g. public administration, industry, mobility
services, and science). The insights gained via participation are expected to yield additional information
that may shape the scenarios below, and they may provide input what people like and what they do not
like.
The scenarios
Four different future scenarios, together with the base scenario, have been defined. Note, that the demand
is the same in all of the five scenarios, it is the demand from 2019.
Base2019 The base scenario, it defines the status before the Corona pandemic. The modal share of
motorized private transport (car and ride mode) in Hamburg is 36%, that of public transport 22%
of the trips (MiD 2017).
RealLab2030 In this scenario, the extensions of the technologies presented in the next section, and
discussed in detail below, are extended to the entire city. This then maps what is achievable with
these technologies in terms of transport efficiency overall, and to CO2 emissions in particular.
RealLab2030plus This is the same scenario as the previous RealLab2030, but with the addition of
Hamburg’s planned Hamburgtakt by 2030. The Hamburgtakt represents a significant expansion of
the current public transport system, with halved cycle times and some extensions and densification
of the existing (2020) network. The city has started with the implementation, but it will not finish
before 2025.
ProClimate2030 In addition to RealLab2030, measures are taken to reduce the attractiveness of private
transport and to increase the attractiveness of other modes of transport. The main tool for this is
a congestion charge, which is complemented by a range of other measures. (New partitioning of
road space, additional cycle lanes, parking space management, increasing road safety, improve the
quality of stay in urban spaces).
DRT2030 This is the scenario with the strongest conceivable digitalization: a DRT service (DRT =
demand-responsive transit) with differently sized automatically driving vehicles is set up parallel
to the motorized individual traffic. As in ProClimate2030, a congestion charge is introduced to
favour DRT and public transport in terms of costs. Normal public transport will remain in place.
It will also be important to ensure that the remaining modes such as cycling and walking are not
cannibalized.
The Tool-chain
The whole tool-chain consists of the usual steps: input, the simulation itself, and the assessment. In
addition, five different scenarios are input as well, and all of this is described in this section.
Input
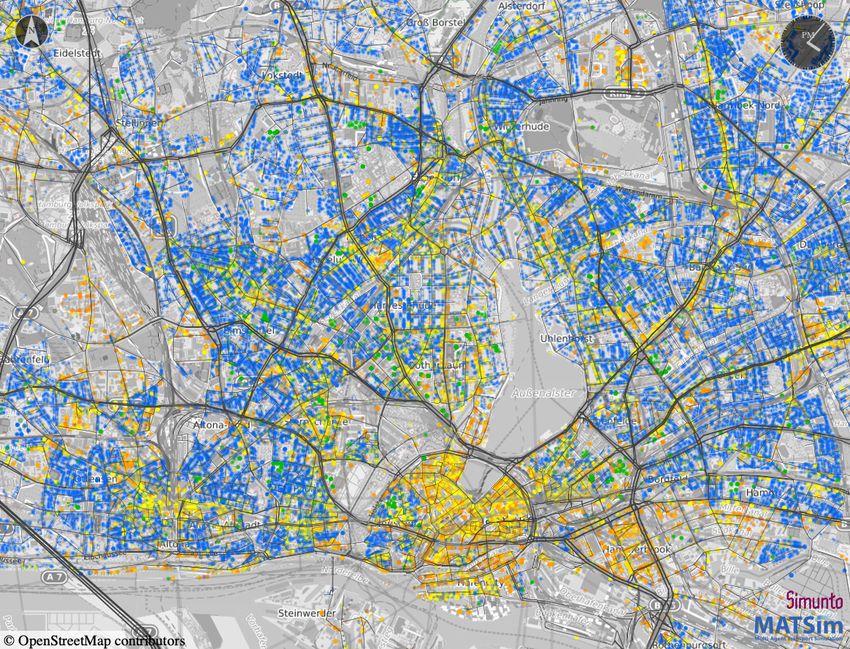
The input consists essentially of the network and demand data in the Greater Hamburg area (see Figure
1 and 2). In addition, a certain amount of other input data is required, in particular to calibrate the
simulation to the state of the real-world transportation system of the Greater Hamburg area.
The network is derived from OpenStreetMap (OSM) [5] and modified (mostly simplified) to be used as
transport network. This network format used is made so that it can subsequently used without change in
a more detailed microscopic simulation like SUMO [6]. This mechanism is described in another paper
submitted to this conference [7].
Demand is a mixture from different sources, the most important of it is the data that stem from data from
cell-phone readings that are being commercialized by a certain company.
In addition to this, the following data have been used:
2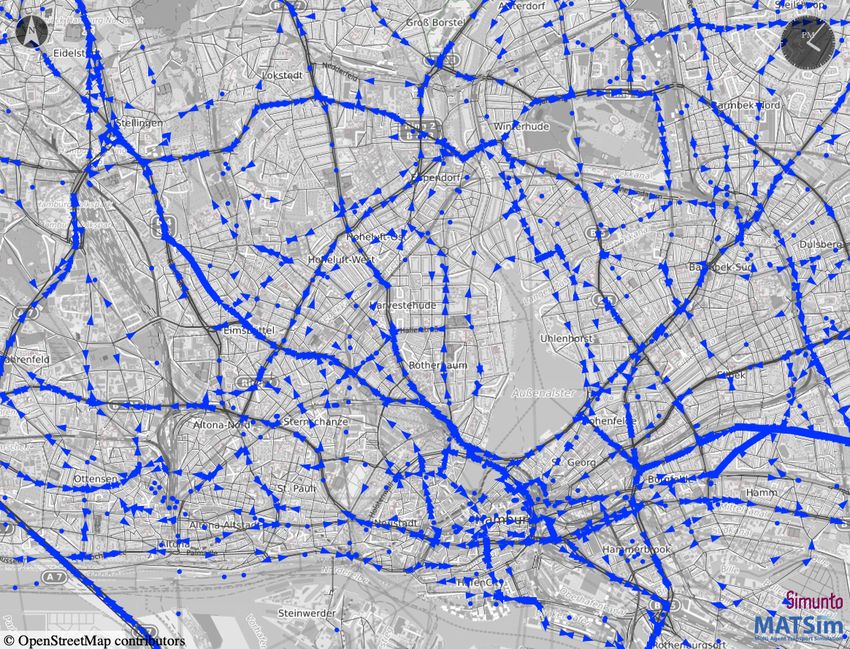
(a) Simulated activities: blue = home; orange = work;   (b) Simulated vehicles (in blue): road users and public
   green = education; yellow = shopping, leisure, other    transit vehicles

         Figure 1: Simulated activities and vehicles in the Greater Hamburg area (25% sample)

   (a) Simulated activities: blue = home; orange = work;   (b) Simulated vehicles (in blue): public transit vehicles
   green = education; yellow = shopping, leisure, other    and cars

       Figure 2: Simulated activities and vehicles in the Hamburg city center area (25% sample)

    • GTFS (General Transit Feed Specification) data of the PT provider in Hamburg, the Hamburger
      Hochbahn, both for 2019 and as a planning alternative for 2030.
    • Demand for goods and commercial transport are provided by the BVM, which is Hamburg’s au-
      thority for traffic and mobility (our translation), and from the commercial transport model of the
      DLR.
    • Data of the recent Mobility in Germany survey [8] are used for calibration, as well as count data
      that stem from Hamburg’s Urban Data Platform.
    • Socio-demographic data.
    • Data about the urban structure, and data about the locations where the agents can perform their
      activities.

Simulation
The simulation itself is performed by using the agent-based simulation framework MATSim (Multi-
Agent Transport Simulation, see www.matsim.org) [9]. In MATSim, transport users are modeled as
individual agents that each have a so-called daily travel plan (see Figure 3) which describes the intended
travel behavior, including the activity-trip-chain, departure times, transport modes and routes. For each
of the more than 3 million residents living in the study area or transport users traveling through or into
the study area daily travel plans are created and then simulated in order to test whether the simultaneous
                                                      3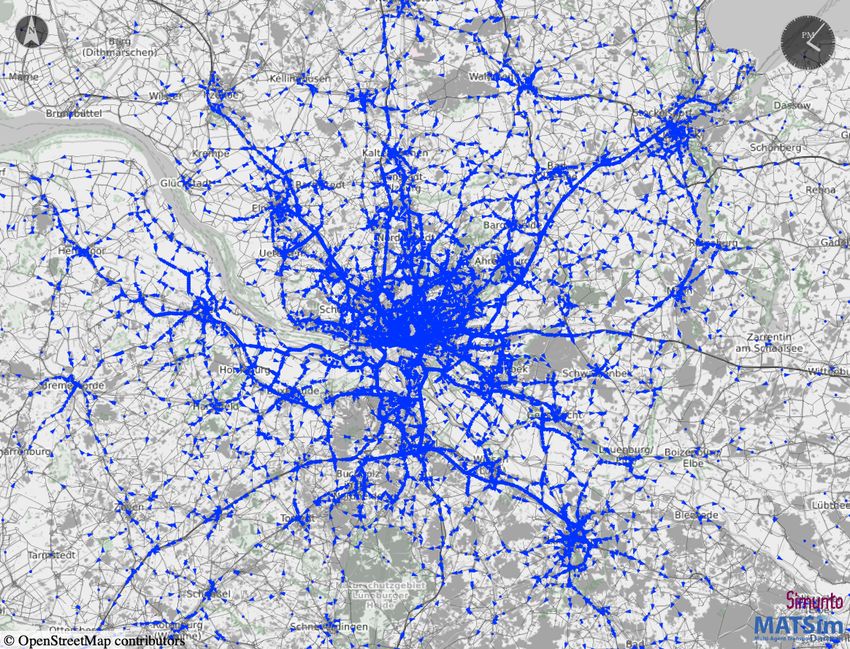
Figure 3: Simulated daily activity-trip-chains of some agents. Solid line: car or ride mode; Dashed line:
public transit, bicycle or walk mode. Each color represents the activities and trips of the same person.

execution of all plans yields the correct traffic patterns observed in the Greater Hamburg area. To simulate
the interaction of transport supply and travel demand, an evolutionary iterative approach is applied which
involves the following three steps:
   1. Travel plans are simultaneously executed and traffic flows are simulated applying a queue model
      with dynamic traffic congestion and spill-back.
   2. Executed travel plans are evaluated based on predefined utility functions and behavioral parame-
      ters.
   3. Agents are enabled to adjust their travel plans along predefined choice dimensions (in this study:
      transport mode, departure time and route).
This iterative cycle is repeated until the plausible travel plans are generated and an approximation of the
stochastic user equilibrium is reached.
The link between the technologies described below, and the behaviour of the agents is made by a sim-
plified discrete choice approach: In a first step, plausible choice sets are generated by mutating existing
travel plans, e.g. agents try out a new mode of transportation or choose a new transport route. In a second
step, during choice set selection, the agents choose among their acquired set of travel plans based on the
(expected) utility applying multinomial logit model. The utility is computed as a function of features as-
sociated with a certain travel plan (daily monetary costs, trip travel-times, waiting times, distance-based
costs, . . . ), each of which weighted by individual factors that describe how strong they contribute to the
(dis-)utility. If these factors, and their distributions in the population are known, they should describe the
travel behavior of the agents to sufficient accuracy, and, even more important, the reaction of the agents
to the scenarios defined above.
                                                      4
Assessment
Finally, not only the traffic patterns can be extracted from the simulation results, but also almost any
other feature of interest to the analyst. All features are available in a high spatio-temporal resolution,
where the spatial resolution is given by the underlying OSM network, and the temporal resolution can
be as fine as one second. For all the links in the network, the load, the speed, the loss time, and the
pollutants produced by the transport system can be computed out of the simulation. In addition, more
aggregate information like the modal share are extracted from the simulation, and parameters describing
the operation of various vehicle fleets. This latter information can be used to test for economic viability
of the different services embedded in the simulation.
Relevant technologies within this project
These technologies are being deployed during the course of this project. Here, only those are regarded
that could be expected to have an effect on future traffic, and that are translatable into parameters and
procedures of the simulation tool. This essentially amounts to an entry in the cost-function described
above.
Mobility platform
The mobility platform of the project is provided by the PT-provider of Hamburg, the Hochbahn. It
features the possibility to choose between a set of different modes (PT only, PT plus feeder service, car-
sharing) and to book each of them with ease and directly out of a smartphone app that is developed and
distributed as well, and that fits within the already existing app of the Hochbahn. There is still room for
improvement, but it can be regarded as a simplified MaaS, and as such it can be implemented into the
MATSim simulation. In essence, it lowers somewhat the costs of using such a mode.
Long distance travel information and booking system
This is similar to the Mobility platform, but it approaches a different segment of travel, that is the long-
distance travel that starts and ends in Hamburg. This once more is a MaaS system, however for a different
brand of customers, whose spatio-temporal distribution in Hamburg can be identified and then used as
input into the MATSim simulation.
Mobility budget
The mobility budget will be given to about 500 people in exchange for their company car. Of course,
to be of interest for a future mobility system, this approach has to be generalized to a mobility budget
given to a much wider range of people. The details of how this can be done are currently discussed in the
group of these authors, in the final scenarios we will come up with a reasonable choice about the group
of users enjoying such a mobility budget.
Autonomous shuttle service
At the light rail station Bergedorf, an autonomous shuttle service will be set up. It will run there for three
months (and especially during the World Congress), and it will use three autonomous shuttles that pick
people up near their home and transport them to the station, and vice versa. It is unlikely, that these three
vehicles can handle the complete demand of such a station, therefore additional simulations are needed
to determine the amount of vehicles needed.
This is then translated into the scenarios (and the simulation) as follows: for all the railway stations
around Hamburg, such a feeder service is set-up with sufficient capacity to serve the corresponding
demands. This is integrated into the simulation as a separate inter-modal mode of transport: before,
people mostly walked to the station (walk + public transport (PT), now they have an additional mode at
their disposal, feeder + PT. Of course, this new service has to have it own set of generalized costs and
cost-functions, which are determined by polls and can in principle estimated from the running service.
5REFERENCES
Shuttle services in rural areas
In three rural areas in the orbit of Hamburg (Ahrenburg, Harburg, Stormarn), a feeder shuttle has started
mid-December 2020. It consists of a small fleet of vehicles that could in principle transport six persons
(which has been halved to three during the Corona pandemic). They pick people up close to their home
and deliver them at the nearest rail-based public transport station, and vice-versa. No direct routes
between two destinations in the area are serviced, even if they were possible, and it is made sure that they
do not conflict with a regular bus service that runs at some places in parallel, but with a low frequency.
Each person who rides such a feeder shuttle is charged with 1 Euro in addition to the regular fare, she or
he needs to have a regular ticket as well.
Communication for VRU
Here, a communication will be established between motorized traffic and vulnerable road users such as
bicyclists, pedestrians, or scooter drivers. It serves two goals: (i) a collision warning application has been
created that samples the GNSS-data that are available from all the road-users subscribed to the service,
and computes possible collision probabilities. Once such a probability gets too large, a warning is issued
so that road-users can react to it. The second aim is to provide a kind of GLOSA (green-light optimized
speed advice) for bicycle drivers, by using in addition data provided by the traffic signals in a certain
test-field of Hamburg.
Of course, the idea is to improve the safety of the VRU, thereby increasing the motivation for citizens to
use a bike or to take a walk to their destination. Again, this will be distributed over the whole city, so in
the future scenario this in general will changed the cost function for these active modes of transport to
become more attractive.
Results and Discussion
So far, this paper presents what will be done on the simulation side in order to better understand how
future ITS-services may play together to improve the mobility of the people in Hamburg, while subse-
quently working toward the goal of decreasing CO2 .
At the time of writing, the project is still ongoing, so there are no results to be presented right now.
Acknowledgement
This work has been supported with a fund from the German Ministry of Traffic and Infrastructure, which
we gratefully acknowledge.
The German National Platform Future of Mobility, and there especially the Working Group 3 (Digitali-
sation for the mobility sector) has been instrumental for starting this project and is constantly monitoring
its progress.
The project would also not be possible without the great support by the City of Hamburg, which provided
data, opportunities, and information.
References
1. Hancock, P. A., Nourbakhsh, I. & Stewart, J. On the future of transportation in an era of automated
and autonomous vehicles. Proceedings of the National Academy of Sciences 116, 7684–7691. ISSN:
0027-8424. eprint: https : / / www . pnas . org / content / 116 / 16 / 7684 . full . pdf. https :
//www.pnas.org/content/116/16/7684 (2019).
2. Autonomous Driving: Technical, Legal and Social Aspects (eds Maurer, M., Gerdes, J., Lenz, B. &
Winner, H.) (Springer, 2016). ISBN: 978-3-662-48845-4. https://elib.dlr.de/108176/.
6REFERENCES
3. Morita, T. & Managi, S. Autonomous vehicles: Willingness to pay and the social dilemma. Trans-
portation Research Part C: Emerging Technologies 119, 102748. ISSN: 0968-090X. http://www.
sciencedirect.com/science/article/pii/S0968090X20306616 (2020).
4. Bensler, A., Goos, K., Rahn, S. & Dotzauer, M. Using participation and co-creation to shape future
mobility – furthering a user-centered perspective within Hamburg’s urban living lab ‘ReallabHH’
Submitted to the ITS WC 2021.
5. OpenStreetMap contributors. Planet dump retrieved from https://planet.osm.org https : / / www .
openstreetmap.org. 2021.
6. Lopez, P. A. et al. Microscopic Traffic Simulation using SUMO in The 21st IEEE International
Conference on Intelligent Transportation Systems (IEEE, 2018). https://elib.dlr.de/124092/.
7. Rakow, C., I. Kaddoura, I., Nippold, R. & Wagner, P. Investigation of the system-wide effects of
intelligent infrastructure concepts with microscopic and mesoscopic traffic simulation Submitted to
the ITS WC 2021.
8. Follmer, R. & Gruschwitz, D. Mobility in Germany – short report tech. rep. (accessed 27 May 2020)
(fas, DLR, IVT, infas 360 on behalf of the Federal Ministry of Transport, and Digital Infrastructure
(BMVI) (FE no. 70.904/15)., 2019). http : / / www . mobilitaet - in - deutschland . de / pdf /
MiD2017%5C_ShortReport.pdf.
9. Horni, A., Nagel, K. & Axhausen, K. W. The Multi-Agent Transport Simulation MATSim ISBN:
1909188751 (Ubiquity Press, London, GBR, 2016).
7You can also read