FY2020 Full year results presentation - JAPARA HEALTHCARE - Japara Investor Centre

Page created by Victor Sandoval
 
CONTINUE READING
FY2020 Full year results presentation - JAPARA HEALTHCARE - Japara Investor Centre
JAPARA HEALTHCARE
FY2020
Full year results presentation

26 August 2020
FY2020 Full year results presentation - JAPARA HEALTHCARE - Japara Investor Centre
Contents
01   Overview                             3

02   Financial and operational summary    9

03   Growth initiatives                  15

04   Industry observations               21

05   Summary and outlook                 25

06   Appendices                          27
FY2020 Full year results presentation - JAPARA HEALTHCARE - Japara Investor Centre
01
Overview
FY2020 Full year results presentation - JAPARA HEALTHCARE - Japara Investor Centre
FY2020 key metrics                                                                                                                                                                                             4

Solid cash flows with earnings reflecting ongoing industry pressures. Focus is on
managing the current COVID-19 crisis whilst trying to build a path to sustainable growth
                        STATUTORY REVENUE                                                             NON-CASH IMPAIRMENT                                               NET RAD AND ILU INFLOWS

                        $427.5m                                                                       $291.9m                                                           $55.8m
                        Up 6.9% on FY2019 due mainly                                                  Impairment of goodwill of $289.5m                                 $15.6m RAD uplift from mature homes
                        to additional development                                                     and Japara Wyong PP&E of                                          and $38.3m from new developments.
                        earnings and increased revenue                                                $2.4m.
                        per resident.

                        RECURRING EBITDA1                                                             OCCUPANCY                                                         DEVELOPMENTS

                        $36.9m                                                                        92.2%                                                             261 beds
                        Recurring EBITDA down                                                         FY2020 average occupancy2                                         261 net new operational places added
                        24.1% on FY2019.                                                              weaker than anticipated due                                       including two new homes.
                                                                                                      to COVID-19.
                                                                                                      Currently 89.4%3

                        STATUTORY NET LOSS4                                                           FINAL DIVIDEND                                                    NET DEBT

                        $(292.1)m                                                                     Nil                                                               $190.7m
                        Net loss of $0.2m prior to impairment                                         No final dividend to be paid.                                     $36.2m core debt at 30 June 2020
                        due to lower occupancy, higher staff                                                                                                            with $154m of available cash and
                        and other costs and increasing                                                                                                                  undrawn debt.
                        depreciation and interest expense on
                        developments in ramp up.
1.   Recurring EBITDA is a measure consisting of earnings before interest, tax, depreciation, amortisation and impairment of non-current assets as set out on page 10
2.   Average occupancy adjusts for places ramping up at new developments and places offline for refurbishment
3.   As at 21 August 2020
4.   Loss attributable to members of the Group
FY2020 Full year results presentation - JAPARA HEALTHCARE - Japara Investor Centre
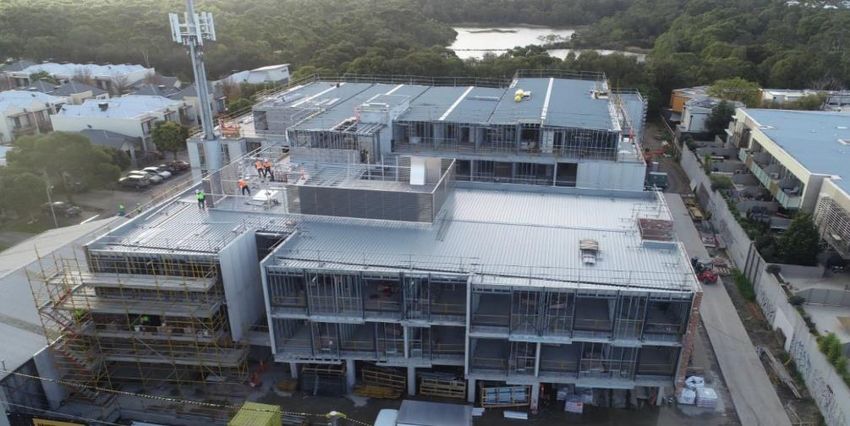
FY2020 business focus                                                                                                                                  5

Despite the immense challenges Japara and the broader sector have faced, focus has
remained on resident and staff wellbeing and long-term growth for shareholders
                          COVID-19
                          • The COVID-19 pandemic has been challenging for the aged care sector with over 100 Aged Care Homes in Australia,
                            including several Japara Homes, affected
                          • We acknowledge the deeply concerning outbreaks and the tremendous impact this has on residents, families and staff
                          • Our highest priority has been to keep our residents and our staff safe, supported and well
                          • Four of Japara’s 21 metropolitan Melbourne Homes have active COVID-19 outbreaks affecting residents and staff

                          People
                          • Japara’s ~6,000 dedicated and caring staff deserve recognition and thanks for the outstanding care they provide,
                            particularly during this time of significant change for, and demand on, the aged care workforce
                          • Chris Price appointed as CEO in March 2020 with new Chief Operations Officer, Chief Financial Officer and Chief Clinical
                            Governance and Risk Officer appointments made
                          • Over 3,300 staff participated in our annual engagement survey and indicated very strong engagement, a commitment to
                            outstanding care delivery and they would recommend their own families and friends for care and employment at Japara
                          • Extensive staff training undertaken including on emergency response and infection control

                          Homes
                          • Japara completed and opened The Regent in Mount Waverley, Victoria in April 2020, currently home to 331 residents
                          • Two further greenfield developments are currently under construction at Newport, Victoria and Belrose, New South Wales
                            (pictured left), with resident admissions expected in 2HFY2021
                          • Our brownfield development at Albury, New South Wales has recently completed with resident admissions expected in
                            September
                          • No further developments to commence construction until clinical and economic outlook becomes more certain
                          • A decision was made to close Japara’s Wyong Home due to ongoing operational challenges

1. As at 21 August 2020
FY2020 Full year results presentation - JAPARA HEALTHCARE - Japara Investor Centre
COVID-19 response framework                                                                                                                                     6

Japara began planning its pandemic response in February

Background
• Strict and early application of biosecurity measures enabled Japara to experience minimal impact from the COVID-19 pandemic until July
• The rapid escalation of community transmission cases in Victoria, and in particular Melbourne, in June saw a greater impact despite the tight biosecurity
  measures in place
• Japara has 33 Homes in Victoria
   ‒ 21 within the greater Melbourne metropolitan area
   ‒ 6 within Geelong and the surrounding area
• Global evidence has demonstrated residential care facilities are particularly vulnerable with COVID-19 impacting over one third of European and North American
  aged care facilities
• Japara remains focussed on organisational and clinical governance, infection control and staffing to ensure resident wellbeing

COVID-19 management framework and approach
• Japara’s response has been informed by expert advice, including:
   ‒ Advice from Commonwealth and State Departments of Health, the Aged Care Quality and Safety Commission and Government Coronavirus Health Alerts
   ‒ An expert infection control adviser who is a critical member of Japara’s Emergency Management Committee
   ‒ Internal expertise from Japara’s clinical care and quality team
• Initial Outbreak Preparedness and Response Committee, convened in February, initiated planning for a situation where residents, staff or Homes were impacted
  by COVID-19 including:
   ‒ COVID-19 preparedness desktop audits for all Homes
   ‒ Simulation training to prepare for outbreaks
   ‒ Certain access to PPE and other necessary essential items
• Escalation of the situation in July saw the Emergency Management Committee (EMC) convened with Site Emergency Response Teams (SERTs) managing site
  specific incidents
   ‒ A comprehensive emergency management plan, overseen by the EMC, is enacted immediately at Homes where residents or staff members test positive
• Regular internal compliance audits undertaken against key performance indicators including staff, resident and visitor screening and infection control measures
FY2020 Full year results presentation - JAPARA HEALTHCARE - Japara Investor Centre
COVID-19 initiatives                                                                                                                                           7

The safety and health of Japara’s residents and staff remains the top priority with
a range of specific measures undertaken to ensure wellbeing
Residents and relatives                                Staff                                                   Home access and infection control
• Frequent testing of residents and staff, as          • Primary worksite principles applied per               • Infection control training undertaken across all
  directed by health authorities’ guidelines, to         Government guidelines to limit cross-Home               ~6,000 staff
  detect new cases as early as possible                  working                                               • All non-essential Home visitations cancelled in
• Cohorting residents at a home level wherever         • Support / non-operational staff working remotely        at risk areas (with compassionate visitation,
  possible when there is an outbreak                   • All staff considered close contacts of COVID-19         under strict guidelines, maintained)
• Resident families provided with regular updates        positive individuals isolated                         • Staff masks compulsory at all Victorian Homes
  on conditions both in writing and via telephone      • Protocols to manage staff absence (eg.                  with protective equipment provided and worn at
  and video calls                                        additional staff from interstate flown in to assist     outbreak Homes
• Wellbeing initiatives including family and friends     with Victorian homes)                                 • Influenza vaccine compulsory and a condition of
  video calls and daily symptom and ‘how are you       • Employee Assistance Program to support staff            entry into Homes
  doing’ checks                                        • Initial aged care workforce retention bonus paid      • Screening for all Home entries including
• Dedicated support line (Japara Assist)                 to eligible staff in July 2020                          temperature checks
                                                       • Incentives for staff working in COVID-19              • Increased cleaning rosters
                                                         impacted Homes with accommodation offered             • Contact tracing if positive cases identified
                                                         for isolating staff if required
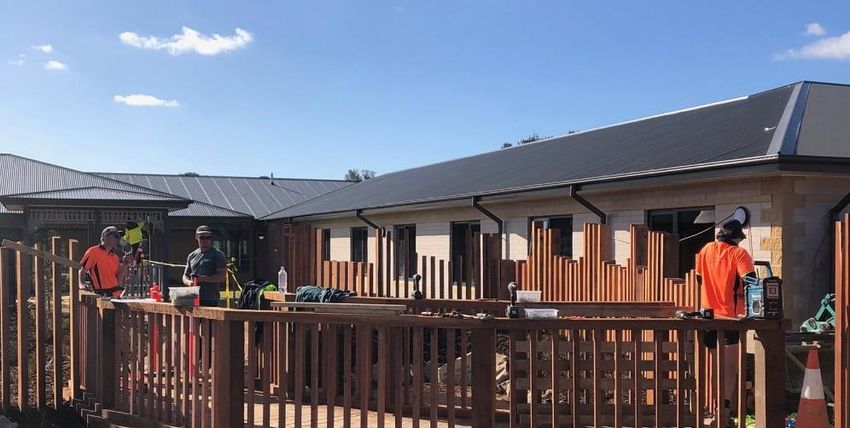
FY2020 Full year results presentation - JAPARA HEALTHCARE - Japara Investor Centre
COVID-19 impact                                                                                                                                                      8

Resident, families, staff and the overall business have been affected by COVID-19

                        • Minimal cases of COVID-19 until mid-July – currently four Homes greatly affected by outbreaks
                        • The Homes impacted by outbreaks are:
                           ‒ Goonawarra (Sunbury) – this Home currently subject to an Aged Care Quality and Safety Commission Notice to Agree relating
                              to the outbreak. Japara is fully compliant with the Notice to Agree
Outbreaks
                           ‒ Millward (Doncaster East)
                           ‒ Elanora (Brighton)
                           ‒ The Regent (Mount Waverley)

                        • Visitation restrictions to limit infection risk and restrictions on new resident admissions (eg isolation requirements) at all Victorian
Residents / relatives     Homes
                        • Alternate communication avenues facilitated (including regular video calls and ‘balcony’ visits)

                        • Significant numbers of staff required to isolate
Staff / workforce       • Primary worksite restrictions impacting rostering
                        • Added infection control protocols including PPE requirements

                        • Direct costs of ~$1m incurred in FY2020 on sourcing infection control and other related consumables (e.g. protective equipment)
Costs                   • Additional wage costs on increased infection control measures such as staff training and increased Home cleaning
                        • Government grants announced allowing Japara to claim certain qualifying expenses

                        • Difficult to quantify the ongoing financial impact of COVID-19 given the uncertainties around its future prevalence and the success of
Earnings impact           measures to control its spread
                        • Occupancy reduced due to limitations on tours and reduced consumer preference to enter residential aged care

Balance sheet /         • Undrawn debt and cash reserves of $154m at 30 June 2020. Banks remain supportive with regular management dialogue
liquidity impact        • Measures implemented to conserve liquidity including deferral of development projects and no final dividend proposed
FY2020 Full year results presentation - JAPARA HEALTHCARE - Japara Investor Centre
02
Financial and operational
summary
FY2020 Full year results presentation - JAPARA HEALTHCARE - Japara Investor Centre
FY2020 earnings                                                                                                                                                                           10

FY2020 earnings impacted by lower occupancy and revenue growth below cost inflation. Loss
from provision of care services subsidised by accommodation payments1 of $47.9m

     FY2020 EBITDA bridge ($m)

                                                                              2.6
                                                                3.4                         7.8
                                                  4.2
                       1.0                                                                                5.3
                                                                                                                    0.8
                                                                                                                                 3.4
                                                                                                                                              4.6
        49.6                        48.6
                                                                                                                                                                        4.0
                                                                                                                                                           36.9
                                                                                                                                                                                  32.9

      FY2019        Net non-       FY2019     Developments    COPO 3        Lease       Staff wage      Other    Pre-reform   Occupancy Support office    FY2020     Net non-    FY2020
      EBITDA        recurring     recurring                  increase     accounting     inflation      costs      run-off                staffing       recurring   recurring   EBITDA
                      items 2      EBITDA                                   impact                                                                        EBITDA       items 2

 Highlights
 • New developments and Homes significantly refurbished contributing as expected, underpinned by solid greenfield and brownfield developments’ occupancy
 • $5.5m of additional Government funding from the 1.23% temporary Aged Care Funding Instrument (ACFI) boost and the COVID-19 specific support package
 • Wage rate increases (of ~2.5%) exceeded annual Government funding growth via ACFI indexation (of 1.4%)
 • Lease accounting standard implementation contributed $2.6m to FY2020 EBITDA (with a $3.2m offsetting impact to depreciation and finance costs)
 • Other cost increases driven by higher utility, insurance, WorkCover and therapy expenditure and includes ~$1m of COVID-19 direct costs and costs incurred
   responding to the summer bushfires
 • Average FY2020 occupancy of 92.2%4 lower than expected on our mature portfolio and below FY2019 average occupancy of 93.0%2 with Daily Accommodation
   Payment revenues also lower than expected due to a lower than anticipated Maximum Permissible Interest Rate
 • Support office staff cost impacted by increased staff numbers, particularly in ICT and sales, COVID-19 employee expenditures (including infection control training
   and resident family liaison) and the expense of ICT wages previously capitalised into projects (of ~$0.9m)
 • Measures taken to reverse the FY2020 support office staffing cost increase include a restructure at the support office in June 2020 and a reduction in Board fees
1.   Daily Accommodation Payments, Accommodation Supplements and Accommodation charges
2.   Refer to Appendices for a reconciliation of net non-recurring items
3.   Commonwealth Own Purpose Outlays indexation
4.   Average occupancy adjusted for places ramping up at new developments and places offline for refurbishment
FY2020 financial result and position                                                                                                                                                            11

Moderate increase in net debt due to ongoing development expenditure with NPAT
impacted by impairment and lower operational earnings
Highlights
• FY2020 financial result1 of $(0.2)m excluding impairment (FY2019 profit of $16.4m)
• Previously disclosed review of the carrying value of assets in light of the impact of COVID-19 resulted in a non-cash impairment of $291.9m
• Financial result1 excluding impairment impacted by lower operational earnings and development activities which result in full depreciation and interest costs
  whilst EBITDA2 is still growing during initial occupation of new and redeveloped homes
• $81m capital investment on new Homes, land acquisitions, refurbishments and asset replacement and improvement
• Recent and near term developments expected to provide ~$160m in RAD inflows for future debt reduction and growth funding
• $345m loan facilities drawn to a net $190.7m
   ‒ Core net debt of $36.2m (1.1x FY2020 EBITDA)
   ‒ Available liquidity of $154m with a further inactive $45m accordion feature within the existing debt facilities

  FY2020 net bank debt movement ($m)
                                                                                                                                                     Development debt       Core net debt

                                                                                                                                                         14.3                   190.7
            179.0
                                         19.4

                                                                       55.8                                                     81.0
            134.5                                                                                                                                                               154.5
                                                                                                    8.3                                                  177.0
                                        160.0                                                                                             Development net debt largely
                                                                     104.0                                                             attributable to Robina Rise, The
                                                                                                   96.0                         96.0
                                                                                                                                        Regent, Trugo Place, Kingston
            44.5                                                                                                                             Gardens and land holdings           36.2

    Net bank debt as at         Cash from operating          Net RAD/ILU inflows           Net land & asset            Capital expenditure            Dividends           Net bank debt as at
      30 June 2019                   activities                                            purchases / sales                                                                30 June 2020

1. Loss attributable to members of the Group
2. EBITDA is a measure consisting of earnings before interest, tax, depreciation, amortisation and impairment of non-current assets
Key operational metrics                                                                                                                                                               12

Operational beds increased by 261 and average incoming contract values increased by
~8% underpinning solid net RAD cash inflows
 Highlights                                                                                               Operational place movement
 • Average FY2020 occupancy of               92.2%1
                                          below FY2019
    ‒ Occupancy at 30 June 2020 was 91.2%1                                                                                                              110       (21)   22
    ‒ Occupancy at 21 August 2020 was 89.4%1                                                                                                                                      4,496
                                                                                                                          146         4
       ‒ Victorian Homes occupancy 88.0%1
       ‒ Remaining portfolio 92.4%1                                                                                                            4,385
 • 2H cost to revenue ratio impacted by lower revenues from lower
   occupancy and higher costs                                                                                 4,235
 • Net RAD cash inflows in FY2020 supported by increased place numbers
   and increased contract prices
 • Wyong place numbers reduced by 21 (from 71 down to 50) with a further                                    Jun 19         Net  Sig Refurb Dec 19      Net     Wyong Sig Refurb Jun 20
   reduction in 1Q FY2021 due to closure of the Home                                                                  developments                developments

     Operational metrics                                                                       2H FY2020                        1H FY2020              2H FY2019              1H FY2019
     Number of homes                                                                                    51                             50                     49                     49
     Operational places (end of period)                                                              4,496                          4,385                  4,235                  4,125
     Average occupancy1                                                                             91.9%                          92.6%                  92.2%                  93.6%
     Average revenue Per Operating Bed Day2                                                         $291.9                         $284.4                 $279.6                 $276.6
     Average Government revenue Per Operating Bed Day2                                              $212.1                         $206.3                 $201.1                 $201.1
     Staff cost to   revenue2                                                                        74.2%                         72.4%                      72.6%              69.7%
     Non-wage costs to     revenue2                                                                  19.2%                         17.4%                      17.6%              17.3%
     Average concessional       residents3                                                           38.9%                         38.4%                      38.5%              39.3%
     Average incoming contract price (’000)                                                         $408.4                         $382.7                 $378.1                 $355.7
     Net RAD & ILU loan inflow (m)                                                                    $22.4                         $33.4                     $15.8               $28.9
1.   Occupancy adjusts for places ramping up at new developments and places offline for refurbishment
2.   Metrics shown exclude the impact of all non recurring items, Government temporary subsidies in FY2019 and greenfield developments in ramp up
3.   Calculated as the number of concessional residents / operational places
4.   As at 21 August 2020
Resident trends                                                                                                                                                13

Trend of increasing resident numbers over the first nine months of FY2020 impacted by
COVID-19 pandemic from April onwards
Highlights                                                                      Non-concessional portfolio mix (by number of residents)
• 4,102 residents as at 30 June 2020 with 3,977 residents as at 21 August      100%
  2020                                                                                 22.4%   24.2%   26.7%    26.2%     27.0%   26.5%    26.5%    29.3%   29.4%
                                                                                80%
   ‒ Increase in resident numbers of 173 from June 2019 to June 2020
                                                                                       18.8%   18.2%            17.3%
   ‒ Noticeable drop in respite residents in early April 2020 contributed to                           17.3%              17.6%   18.9%    17.7%    18.4%
                                                                                60%                                                                         19.0%
      decline in occupancy in 4Q FY2020
   ‒ Further decline since mid-July particularly in Metropolitan Melbourne      40%
• Average incoming place contract values increased mainly due to new                   58.8%   57.6%   56.0%    56.5%     55.4%   54.6%    55.8%    52.3%   51.6%
  premium rooms opening at new and redeveloped Homes                            20%

• Continuing slow trend in non-concessional resident preference towards          0%
  DAPs                                                                                 Jun 16 Dec 16 Jun 17 Dec 17 Jun 18 Dec 18 Jun 19 Dec 19 Jun 20
                                                                                                               RAD      Combination    DAP

 Monthly average incoming place contract price ($’000)                          Resident count
475                                                                            4,200                                                                          300
                                                                                                Total residents (LHS)
                                                                                                Respite residents (RHS)
425                                                                            4,100                                                                          250

375                                                                            4,000                                                                          200

325                                                                            3,900                                                                          150

275                                                                            3,800                                                                          100
  Jun 16         Jun 17           Jun 18           Jun 19          Jun 20          Jun 19       Sep 19          Dec 19            Mar 20           Jun 20
FY2020 RAD liability movement                                                                                                                                    14

RAD cash flows remained resilient with net inflows of ~$53.9m

RAD cash flow ($m)                                                                                                                           Probate liability

 800
                                                  175.2
                                                                                                              38.3                            584.5
 600                530.6
                                                                                 157.8
 400

 200

   0               58.0m                                                                                                                     59.8m
            RADs/Bonds at start        Incoming RADs - mature homes   RADs/Bonds Refunds and      Net RADs Greenfield/Brownfield   RADs/Bonds at end of period
                of period                                             Deductions - mature homes             Homes

Highlights
• Net RAD liability movement of $53.9m in FY2020 (excludes $1.9m of net ILU inflows)
   ‒   $15.6m from mature homes
   ‒   $38.3m from completed greenfield and brownfield developments
   ‒   Increase in probate liability of $1.8m

• Further ~$160m RAD uplift expected as new homes and extensions ramp up
   ‒   Robina Rise opened in July 2019, The Regent opened in April 2020 and Newport and Belrose are expected to open in early CY2021
   ‒   Brownfield extensions at Mirboo North, Brighton-Le-Sands and Kingston Gardens opened recently and are ramping up and the extension to Albury &
       District is opening shortly
03
Growth initiatives
Development pipeline of 656 new places                                                                                                                                                                    16

Recent pipeline changes include expected completion of some developments
extending as a result of delayed commencement due to the COVID-19 pandemic
Near-term development pipeline1 (net new places)

     Developments ramping up (100)                       Greenfield (533 new places)                                                                                            115

     Operational places (4,496)                          Brownfield (123 net new places)                                                                          90

                                                                                                                        38                     106
                                                                                                           27
                                                                                       30

                                                            102
                                           120
                           28
            100

                                           FY21                                                             FY22                                                  FY23

                                                                                                                                                                                              5,252
                                                                                                                                    4,941
                                                                          4,846
             4,496

                                        250 places                                                        95 places                                            311 places
                                     (in construction)                                                (not commenced)                                       (not commenced)
                                            Newport

                                                            Belrose
             June 2020

                            Albury

                                                                          June 2021

                                                                                                                                   June 2022

                                                                                                                                               Mitchelton
                                                                                                                        Brighton

                                                                                                                                                                  Lysterfield

                                                                                                                                                                                Hope Island

                                                                                                                                                                                              June 2023
                                                                                                           Kelaston
                                                                                       Lower Plenty

1. Refer Appendix for development pipeline details
Newport greenfield development case study                                                                    17

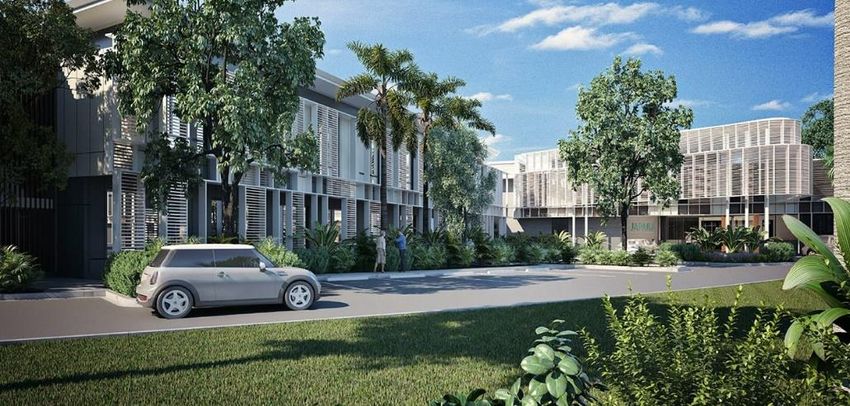
Trugo Place in Newport is Japara’s latest greenfield development and is due to open in
early 2021, offering 120 new premium rooms to the inner western Melbourne community
Trugo Place, Newport (VIC)
• Located in the inner west Melbourne suburb of Newport, this Home will
  offer best in market accommodation to residents with views of Newport
  Lakes and glimpses of Port Phillip Bay and the Melbourne CBD
• The four storey plus basement construction commenced in late 2018
• Total development costs (including land) of $46m expected
• The north south orientated home includes premium quality, single bed
  with ensuite, large rooms and a variety of amenities such as an in-
  house café & bar, expansive terraces, a cinema, a beauty, hair and
  nail salon and a gymnasium
                                                                          Newport Façade (render)

Newport Aerial (June 2020)                                                Platinum Resident Suite (render)
Recent developments                                                                                                                          18

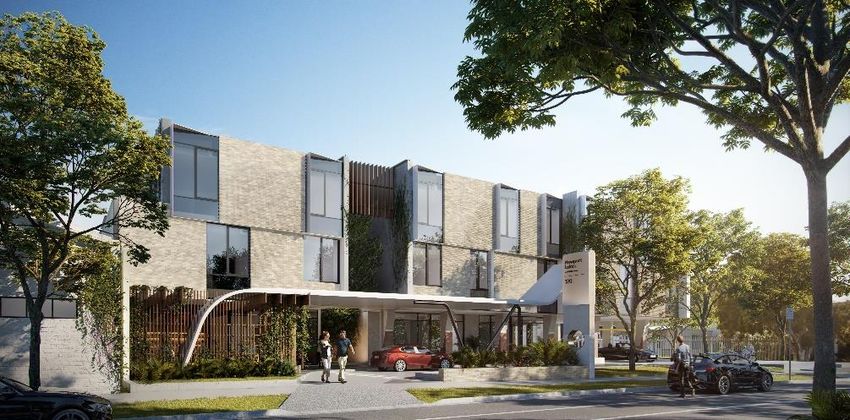
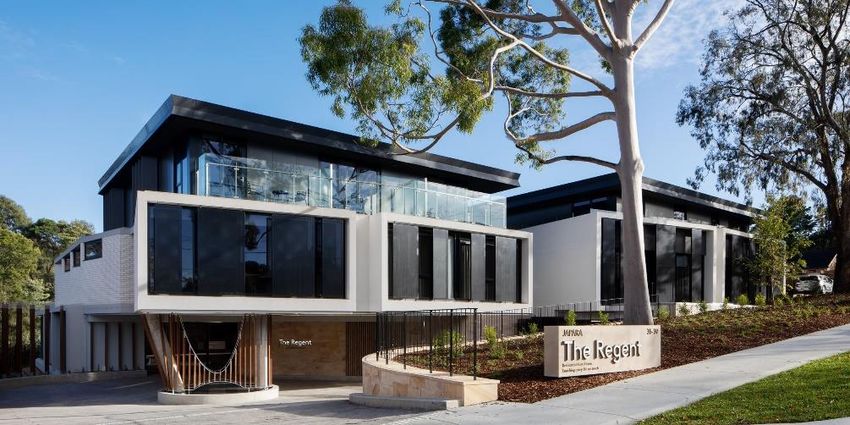
Japara has recently completed two major developments being The Regent greenfield in Mt
Waverley and Albury and District brownfield extension in NSW
The Regent (VIC)                                                       Albury & District (NSW)
• Located in the eastern Melbourne suburb of Mount Waverley            • Located in Glenroy, 5 minutes from Albury CBD
• The Regent has 105 places including a specialised dementia small     • This brownfield development adds 28 premium quality, private places
  home environment                                                       to the existing, strongly occupied 90 bed Home
• Construction commenced in late 2018 completing in February 2020      • The new dementia capable wing is connected to the existing home and
• Development costs (including land) totalled ~$41m                      split into two small households with separate dining, lounge, recreation
                                                                         and outdoor spaces
• The light filled home backs onto Valley Reserve with a variety of
  accommodation types complemented by an in-house café & bar,          • Key objectives of the project were to increase the capacity of a strong
  external terraces, balconies, cinema, beauty and wellbeing hub and     performing home in a regional market
  gymnasium                                                            • Opening to residents in September 2020, full ramp up is expected to
• The Regent opened in April 2020 and is currently home to 331           be achieved by December 2020
  residents

 Japara The Regent                                                      Japara Albury & District (under construction)

1. As at 21 August 2020
Recent real estate activity summary                                                                                            19

Key focus over FY2021 will be delivery of the Newport and Belrose greenfield developments
with other projects not yet in construction being paused prior to construction commencement

Active real estate projects update
•   Overall approach to real estate developments modified to reflect the impact of COVID-
    19, with any projects not yet in construction being paused once builder selected until the
    outlook becomes more certain
•   Japara Springvale, Melbourne
     ‒ Sale and leaseback of Japara Springvale completed in H2 FY2020
•   Highton, Geelong development site
     ‒ Licenses and site divested with the final settlement in April 2020

•   Belrose, Sydney
     ‒ Construction on schedule with resident admission forecast for H2 FY2021

•   Hope Island, Gold Coast
     ‒ Development application lodged in July 2020 for a new 115 place Home                      Japara Hope Island (render)

•   Kelaston, Ballarat
     ‒ Development approval recently received for 30 place extension with all required
        licenses currently held
•   Lower Plenty Garden Views, Melbourne
     ‒ Development application lodged for a 30 place extension

•   Japara Wyong
     ‒ Decision to close Home made with site to be divested

•   Japara Hallam and Japara Capel Sands significant refurbishment projects completed H2
    FY2020 (higher accommodation supplement being received)
•   Mount Eliza development application for additional senior living accommodation lodged
    in H2 FY2020
•   Town Planning Permit received on Kingston Way Estate (7,754 sq.m. of land owned
    adjacent to Japara Kingston Gardens) for 60 independent living apartments
                                                                                                 Japara The Regent
Development assets and funding                                                                                                                                                         20

Japara has future committed development capital expenditure of $34.5m with $154m in
cash and undrawn debt
Debt and development capital summary                                                                    Debt facility summary                         Drawn           Undrawn        Total
• Japara has $345m in committed debt facilities with cash and undrawn
  debt of $154m at 30 June 2020                                                                         General Purpose                              $83.0m            $82.0m     $165.0m
• Debt is allocated to general purpose and development sub-facilities as                                Development                                 $154.5m            $10.5m     $165.0m
  well as a multi-option working capital facility
                                                                                                        Multi-Option                                  $1.5m            $13.5m      $15.0m
• Development debt is excluded from certain debt covenant calculations
   ‒ June 2020 covenant debt / covenant EBITDA was 1.24x (against a
      covenant of less than 3.5x) and June 2020 covenant ICR1 was 5.23x                                 Sub-Total                                  $239.0m            $106.0m     $345.0m
      (against a covenant of greater than 3.0x)
• We are currently ramping up and/or completing 765 net new places with                                 Cash                                       $(48.3)m            $48.3m            -
  ~$34.5m in further capital expenditure required to complete delivery
• Together these 765 places are projected to generate a further ~$160m in                               Net debt / available                       $190.7m            $154.3m     $345.0m
  additional net RAD inflows2

 Developments                       New        Expected future                 Capex                    Land holdings                                        Net new            Book value
 ramping up / completing           places        RADs ($m)2            remaining ($m)                                                                         places
 Rye Sands (VIC)                     99                                             -                   Mitchelton (QLD)                                       106                  $7.2m
 The Highbury (VIC)                  60                                             -                   Lysterfield (VIC)                                       90                  $5.4m
 Brighton-Le-Sands (NSW)             85                                             -                   Reservoir (VIC)                                         90                  $7.7m
 Kingston Gardens (VIC)              60                                             -                   Hope Island (QLD)                                      115                  $4.6m
 Robina Rise (QLD)                  106                                             -                   Kingston Way Estate (VIC)                                -                  $5.5m
 The Regent (VIC)                   105                                             -                   Brighton (VIC)                                           -                  $8.5m
 Albury & District (NSW)             28                                        $1.1m                    Oaklands (SA)                                            -                  $1.0m
 Trugo Place (VIC)                  120                                       $12.8m                    Mt Eliza (VIC)                                           -                  $1.2m
 Belrose (NSW)                      102                                       $20.6m                    Glenning Valley (NSW)                                    -                  $1.3m
 Total                              765             ~$160m                    $34.5m                    Total                                                  401                 $42.4m
1. Interest Cover Ratio
2. Expected RAD inflows from the above 765 total places assume a ‘look through’ ~65% RAD preference for non-supported residents and a weighted average RAD to local
   house price ratio of 55%
04
Industry observations
Industry trends overview                                                                                                                                                    22

Whilst COVID-19 has dominated industry attention recently, underlying longer term
trends and the ongoing review of aged care continue to influence the sector

 Industry trends                                                                                       Occupancy
                                                                                                       95%
  • Occupancy – continued to decline over 2020, with the impact of
                                                                                                       94%
    COVID-19 particularly evident from mid April to mid June
       ‒   The ongoing oversupply of places, discussed further on page 23,                             93%
           continues to cause challenges in maintaining resident numbers at                            92%
           older style homes
                                                                                                       91%
  • Revenue – annual indexation of 1.6% for the Aged Care Funding
      Instrument from 1 July 2020 was announced in late June                                           90%
                                                                                                                        Mirus Australia monthly occupancy
  • Costs – the Fair Work Commission’s Annual Wage Review Decision                                     89%
    in June resulted in a 1.75% increase to the Age Care Award,                                                        Japara 6 monthly occupancy
    significantly lower than the 3% announced in 2019                                                  88%
                                                                                                          Jun 15       Jun 16       Jun 17        Jun 18       Jun 19    Jun 20
  • Influenza – measures implemented to mitigate the spread of COVID-
    19 have significantly reduced the prevalence of influenza with minimal
    cases detected since April 2020                                                                    Australian monthly laboratory confirmed influenza cases
                                                                                                        120,000
                                                                                                                        2009          2015
 Royal Commission into Aged Care Quality and Safety                                                     100,000         2016          2017
  • The date by which the Commissioners are required to provide a Final                                  80,000         2018          2019
    Report has been extended to 26 February 2021
                                                                                                                        2020
  • Hearings continue with Sydney Hearing 2 examining the response to                                    60,000
    COVID-19
                                                                                                         40,000
  • Upcoming Sydney Hearing on Funding, Financing and Prudential
    Regulation scheduled for mid-September                                                               20,000
  • Japara incurred direct costs relating to the Royal Commission of
                                                                                                             0
    $1.8m for FY2020 in addition to direct costs of $1.8m in FY2019                                                Jan Feb Mar    Apr May Jun       Jul   Aug Sep Oct Nov Dec

Source: Mirus Australia
        Australian Government Department of Health, National Notifiable Diseases Surveillance System
Residential aged care sector supply and demand                                                                                                                                                                                                                             23

Growth in the potential resident cohort has been offset by declining utilisation rates
resulting in net place additions exceeding annual increases in residents over recent years
Number of Australians aged 75+ years                                                                                             Residential aged care utilisation rates for 75+ age cohort
           2.0                                                                               4.5% p.a.                                                           11.0%
                                  ABS 75+ estimate resident population

                                                                                                                                  % of 75+ individuals in care
                                                                                              CAGR
                                  ABS 75+ population forecast
           1.8                                                                                                                                                   10.5%

                                                  2.7% p.a.                                                                                                                                                                                                     (1.2%) p.a.
 Million

           1.6                                     CAGR                                                                                                          10.0%                                                                                            CAGR

           1.4                                                                                                                                                   9.5%

           1.2                                                                                                                                                   9.0%
                  2009           2011        2013         2015           2017        2019         2021                                                                     2009                  2011               2013               2015              2017          2019

Annual increase in residential aged care residents                                                                               Aged care building approvals and vs net place additions
8,000                                                                                                                                                                        ABS Rolling Annual Aged Care Building
                                                                                                                                                                 2.5                                                                                                   8,000
                                                                                                                                                                             Approvals - advanced 18 mths (LHS)
                                                                                                                                                                             ACFA/AIHW Annual Net New Places
6,000                                                                                                                                                            2.0
                                                                                                                                                                             (RHS)                                                             6,450 6,255             6,000
                                                                                                                                                                 1.5

                                                                                                                                   $billion
4,000                                                                                                                                                                            4,520
                                                                                                                                                                                                                                       4,860
                                                                                                                                                                                                                                                                       4,000
                         4,077                                            4,156
                                                          3,681                                                                                                  1.0                                                           3,460
                                                                                  3,044                                                                                                                          3,010 3,090
                                  2,647                                                                                                                                  2,930
2,000                                                                                     2,523           2,435                                                                          2,550                                                                         2,000
                 2,025                    2,003   2,043                                           2,175                                                          0.5                             2,270
                                                                                                                                                                                                         1,710
                                                                  166
           0                                                                                                                                                     0.0                                                                                                   0
                 2009            2011             2013            2015            2017            2019                                                                 2009              2011            2013         2015             2017         2019        2021

Sources:         GEN Aged Care Data, Permanent and Respite Resident data and Aged Care Financing Authority & AIHW Residential Place data
                 Australian Bureau of Statistics, 3101 - Australian Demographic Statistics June 2019, Estimated Resident Population & 3222 - Population Projections, Australia, 2017 (base) – 2066, Series B
                 Australian Bureau of Statistics, 8731 - Building Approvals, Australia, Aged Care Building Approvals (Table 51)
Residential aged care sector profitability                                                                                                                                     24

Revenue and cost growth imbalance and declining occupancy has seen the sector show
decreasing EBITDA and margin from operations (excluding accommodation payments)
Sector EBITDA ($’000) and operating margin (EBITDA as % of revenue excluding accommodation payments)
 2,500                                                                                                                                                                     6.0%

                                                                                                                       1,770
                                                                                             1,792                                                                         5.0%
 2,000
                                                                     1,508
                                            1,406                                                                                            1,591               1,590     4.0%
                    1,284
 1,500
                                                                                                                                                                           3.0%

                                                                                                                      1.9%
 1,000                                                               1.8%                                                                                                  2.0%
                   1.5%                      1.3%
                                                                                              1.3%

   500                                                                                                                                                                     1.0%

                                                                                                                                                                           0.0%
     -
                                                                                                                                                                           -1.0%

  -500
                                                                                                                                             (1.6%)                        -2.0%

                                                                                                                                                                  (2.7%)
-1,000                                                                                                                                                                     -3.0%
                   FY13                     FY14                     FY15                     FY16                     FY17                  FY18                 FY19

                               Accommodation payments (LHS)                          Operational EBITDA (LHS)                       Operational EBITDA margin (RHS)

Source: Aged Care Financing Authority Annual reports on the funding and financing of the Aged Care Sector (June 2013 – June 2019)
05
Summary and outlook
FY2020 summary and FY2021 outlook                                                                                    26

FY2020 significantly impacted by the COVID-19 pandemic with the future outlook
difficult to estimate given numerous uncertainties
FY2020 Summary
•   FY2020 significantly impacted by the COVID-19 pandemic in the final
    quarter with occupancy and per resident revenues lower and costs higher
    than anticipated
•   Ongoing and increasing earnings contribution from recently completed
    greenfield and brownfield developments and refurbishments
•   Recurring EBITDA of $36.9m down by 24% on FY2019 largely due to
    lower occupancy and cost inflation greater than revenue escalation
•   Balance sheet strength maintained with net bank debt of $190.7m at 30
    June 2020 and available liquidity of $154m

FY2021 Outlook                                                                 Exercise class at Japara The Regent

•   Focus continues to be on management of COVID-19 to ensure resident
    and staff wellbeing
•   Guidance remains suspended
•   Cost and revenue implications from COVID-19 remain uncertain
•   The funding environment continues to present challenges and occupancy
    remains below historic levels
•   Recently completed developments expected to contribute to EBITDA
     ‒ Interest and depreciation expenses also expected to increase in
        FY2021 due to these recently completed developments
•   Strong RAD inflows expected from new Homes ramping up
•   Delivery of the developments currently under construction expected to be
    completed in FY2021 adding ~250 new places
     ‒ Decisions on future developments deferred until COVID-19 pandemic       Japara The Regent resident painting
        and economic outlook more certain
06
Appendices
Appendix 1: Japara portfolio overview                                                                                                                   28

Japara’s portfolio comprises over 5,000 existing or soon to be constructed aged care places
with several co-located senior living communities

Portfolio summary
• Japara’s aged care portfolio comprises 50 (excluding Japara’s Wyong Home)
  homes across five states
    ‒   Two further greenfield developments are under construction (Newport in
        Victoria and Belrose in NSW)
    ‒ 46 homes are owned freehold with the remaining four leased
• Japara has a further greenfield development portfolio comprising:
    ‒   Four owned sites (two with Development Approval) offering the opportunity
        for new Home developments
                                                                                                                                       Gympie
    ‒ Two further regions where licenses are held and sites are being sourced
• Japara also has a number of brownfield development opportunities
                                                                                                                                           Noosa
• Japara’s senior living portfolio comprises a total of 180 independent living units
  and apartments co-located with five of our aged care homes                                                                               Robina
    ‒   A further three sites with land already owned are in planning for additional                                                    Coffs Harbour
        senior living developments
                                                                                                                                        South West Rocks

                                                                                                              5                4      Sydney
                                                                                               Adelaide                            Albury
                                                                                                                   3
                                                                                                                       21 3        Gippsland
                                                                                       Victorian Goldfields        6
                                                                                                                         Melbourne
                                                                                                 Greater Geelong
                                                                                                                         2
                                                                                                                              Launceston
Appendix 2: Detailed Profit and Loss                                                                    29

                                                           FY2020      FY2019           Change
                                                            $'000       $'000                       $'000
 Revenue
 Government care and accommodation funding                 306,830     287,735         6.6%        19,095
 Resident fees                                             115,412     107,202         7.7%         8,210
 Other income                                                5,290       4,831         9.5%           459
 Total revenue & other income                              427,532     399,768         6.9%        27,764
 Expenses
 Employee benefits expense                                (315,064)   (277,563)       13.5%       (37,501)
 Resident costs                                            (39,074)    (34,225)       14.2%        (4,849)
 Other costs                                               (40,519)    (38,427)        5.4%        (2,092)
 Total expenses                                           (394,657)   (350,215)       12.7%       (44,442)
 EBITDA                                                     32,875      49,553      (33.7)%       (16,678)
 Impairment of non current assets                         (291,923)           -          n/a     (291,923)
 Depreciation and amortisation                             (26,441)    (19,995)       32.2%        (6,446)
 EBIT                                                     (285,489)     29,558    (1,065.9)%     (315,047)
 Net finance costs                                          (7,393)     (5,914)       25.0%        (1,479)
 Income tax credit / (expense)                                 795      (7,211)    (111.0)%         8,006
 NPAT1                                                    (292,087)     16,433    (1,877.4)%     (308,520)

1. Profit / (loss) attributable to members of the Group
Appendix 3: Detailed Cash Flow Statement                                         30

                                                              FY2020       FY2019
                                                                $'000        $'000
Cash flows from operating activities:
Receipts from customers                                        421,567      389,844
Payments to suppliers and employees                          (390,603)    (347,515)
Income taxes paid                                               (3,316)      (2,348)
Interest received                                                   231          414
Finance costs paid                                              (8,444)      (6,436)
Proceeds from RADs & ILU resident loans                        232,302      183,262
Repayment of RADs/accommodation bonds & ILU resident loans   (176,539)    (138,533)
Net cash provided by operating activities                       75,198       78,688
Cash flows from investing activities:
Purchase of land & buildings                                  (15,407)     (18,289)
Proceeds from sale of land & buildings                          19,009        1,671
Purchase of plant and equipment                                (6,458)     (29,687)
Capital works in progress                                     (71,006)     (78,387)
Proceeds from sale of surplus resident places                    4,690        3,416
Purchase of resident places                                          -      (3,423)
Deposits paid under land contracts                                   -        (960)
Net cash used in investing activities                         (69,172)    (125,659)
Cash flows from financing activities:
Proceeds from issue of share capital                                 -        1,733
Purchase of treasury shares                                      (617)            -
Dividends paid                                                (14,297)     (17,448)
Net proceeds from bank borrowings                               28,500       65,000
Repayment of lease liabilities                                 (2,798)            -
Net cash provided by financing activities                       10,788       49,285
Net increase in cash and cash equivalents held                  16,814        2,314
Cash and cash equivalents at beginning of the year              31,472       29,158
Cash and cash equivalents at end of the year                    48,286       31,472
Appendix 4: Balance Sheet                                     31
                                       30 June 20     30 June 19
                                            $'000          $'000
Assets
Current assets
Cash                                       48,286         31,472
Trade and other receivables                15,326         14,640
Non-current assets held for sale            2,261          2,192
Current tax receivable                      1,860              -
Other assets                                3,681          6,216
Total current assets                       71,414         54,520
Non-current assets
Trade and other receivables                  2,574          2,347
Right-of-use assets                         30,140              -
Property, plant and equipment              833,202        787,767
Investment property                         48,925         39,200
Intangible assets                          265,761        555,319
Total non-current assets                 1,180,602      1,384,633
Total assets                             1,252,016      1,439,153
Liabilities
Current liabilities
Trade payables and other liabilities       34,104         35,573
Borrowings                                 58,250         40,750
Current tax payable                             -            377
Other financial liabilities               609,526        554,649
Employee provisions                        42,954         36,645
Lease liabilities                           2,338              -
Total current liabilities                 747,172        667,994
Non-current liabilities
Borrowings                                 180,750       169,750
Deferred tax liabilities                    61,090        62,938
Employee provisions                          5,608         3,975
Other financial liabilities                  5,039         2,412
Lease liabilities                           29,390             -
Total non-current liabilities              281,877       239,075
Total liabilities                        1,029,049       907,069
Net assets                                 222,967       532,084
Equity
Issued capital                             524,285       524,695
Share based payment reserve                     304             -
Hedging reserve                             (5,039)       (2,412)
Retained earnings                        (296,583)          9,801
Total equity                               222,967       532,084
Appendix 5: Non-recurring earnings reconciliation                32

                                                  FY2020    FY2019
                                                     $m        $m
Non recurring items
Profit on sale of surplus bed licences                4.6       3.4
Fair value gain / (loss) on investment property     (2.4)       0.8
Profit on sale of land                                3.0       0.3
Royal Commission costs                              (1.8)     (1.8)
Greenfields start-up losses                         (1.8)     (1.0)
Redundancies / restructuring                        (1.2)     (0.7)
Long service leave assumption changes               (2.2)         -
Expected credit losses adjustment                   (1.9)         -
Revaluation of land                                 (0.3)         -
Total                                               (4.0)       1.0
Appendix 6: Portfolio Metrics                                                                         33

                                                           As at                 As at
                                                                                                Change
                                                    30 June 2020          30 June 2019
Resident mix
Concessional                                               1,771    43%          1,635    42%      8.3%
RAD                                                        1,105    27%          1,170    30%    (5.6)%
DAP                                                          630    15%            555    14%     13.7%
Combination                                                  408    10%            370     9%     10.1%
Pre-reform high-care places                                   16     0%             23     1%   (30.4)%
Respite                                                      155     4%            159     4%    (2.3)%
TCP / Other                                                   17     1%             17     0%          -
Total residents                                            4,102   100%          3,929   100%      4.4%
Staffing
Number of staff (including part time and casuals)          6,064                 5,628            7.7%
Places
Operational places                                         4,496                 4,235             6.2%
Non-operational places                                       459                   591          (22.3)%
Provisional ACAR allocations                                 750                   973          (22.9)%
Total places                                               5,705                 5,799           (1.6)%
Places (metro/major regional, regional split)
Metro/major regional                                       4,548    80%          4,558    79%    (0.2)%
Regional                                                   1,157    20%          1,241    21%    (6.8)%
Total places                                               5,705   100%          5,799   100%    (1.6)%
Geographic spread (places)
VIC                                                         66%                   67%
NSW                                                         13%                   14%
QLD                                                          9%                    7%
SA                                                           7%                    7%
TAS                                                          5%                    5%
Total                                                      100%                  100%
Funded bed days                                        1,466,831             1,391,966            5.4%
Appendix 7: Developments update                                                                                  34

Significant greenfield & brownfield aged care development program comprising 656
new places and additional senior living development opportunities

                                                                                                 Estimated resident
Greenfield developments               Program status       Total new places     Net new places           admission
Newport (Melbourne)                        Construction                 120                120           2H FY2021
Belrose (Sydney)                           Construction                 102                102           2H FY2021
Mitchelton (Brisbane)                            Tender                 106                106           1H FY2023
Lysterfield (Melbourne)                         Tender                   90                 90           2H FY2023
Hope Island (Gold Coast)                  Town planning                 115                115           2H FY2023
Total                                                                   533                533

                                                                                                 Estimated resident
Brownfield developments               Program status       Total new places     Net new places           admission
Albury & District (Albury)         Construction complete                28                  28           1H FY2021
Lower Plenty Gardens (Melbourne)          Town planning                 30                  30           2H FY2022
Kelaston (Ballarat)                      Detailed design                27                  27           2H FY2022
Brighton (Adelaide)                      Detailed design                38                  38           2H FY2022
Total                                                                  123                 123

Seniors living / co-located                                      Total new            Net new    Estimated stage 1
developments                          Program status          Seniors units   Aged Care places         completion
Mt Eliza (Melbourne)                     Town planning                   95                  0           1H FY2022
Launceston                              Concept design                  120                  0                 NA
Brighton (Melbourne)                    Concept design                   80                  8                  NA
Total                                                                   295                  8
Appendix 7: Developments update (cont.)                                                   35

Recent completed developments                 Total new places   Net new places   Completed
The Highbury, Glen Waverley (Melbourne)                    60                60   1H FY2019

Rye Sands, Rye (Victoria)                                  99                99   1H FY2019

Brighton-Le-Sands (Sydney)                                 60                60   1H FY2019

Kingston Gardens Stage 1 (Springvale South)                68               (4)    1H FY2019

Mirridong (Bendigo)                                        16                16    1H FY2019

Robina Rise (Gold Coast)                                   106              106    1H FY2020

Mirboo North (Gippsland)                                    18               18    1H FY2020

Kingston Gardens Stage 2 (Springvale South)                 60               64    1H FY2020

Brighton-Le-Sands Stage 2 (Sydney)                          25               25    1H FY2020

The Regent, Mt Waverley (Melbourne)                        105              105    2H FY2020

Total                                                      617              549
Disclaimer                                                                                                                                                           36

This presentation was prepared by Japara Healthcare Limited (ABN 54 168 631 052) (“the Company”) and was authorised for release by the Board of the Company.
Information contained in this presentation is current as at 26 August 2020. This presentation is provided for information purposes only and has been prepared without
taking account of any particular reader’s financial situation, objectives or needs. Nothing contained in this presentation constitutes investment, legal, tax or other
advice. Accordingly, readers should, before acting on any information in this presentation, consider its appropriateness, having regard to their objectives, financial
situation and needs, and seek the assistance of their financial or other licensed professional adviser before making any investment decision. This presentation does
not constitute an offer, invitation, solicitation or recommendation with respect to the subscription for, purchase or sale of any security, nor does it form the basis of
any contract or commitment.
Except as required by law, no representation or warranty, express or implied, is made as to the fairness, accuracy or completeness of the information, opinions and
conclusions, or as to the reasonableness of any assumption, contained in this presentation. By reading this presentation and to the extent permitted by law, the
reader releases the Company and its affiliates, and any of their respective directors, officers, employees, representatives or advisers from any liability (including,
without limitation, in respect of direct, indirect or consequential loss or damage or loss or damage arising by negligence) arising in relation to any reader relying on
anything contained in or omitted from this presentation.
The forward looking statements included in this presentation involve subjective judgment and analysis and are subject to significant uncertainties, risks and
contingencies, many of which are outside the control of, and are unknown to, the Company. In particular, they speak only as of the date of these materials, they
assume the success of Japara Healthcare Limited’s business strategies, and they are subject to significant regulatory, business, competitive and economic
uncertainties and risks. Actual future events may vary materially from forward looking statements and the assumptions on which those statements are based. Given
these uncertainties, readers are cautioned not to place reliance on such forward looking statements. Past performance is not a reliable indicator of future
performance.
You can also read