FY2022 Proposed Operational Budget - Housing Authority of Snohomish County Pam Frost, Finance Director - Housing Authority of ...
←
→
Page content transcription
If your browser does not render page correctly, please read the page content below

FY2022 Proposed Operational Budget

           Housing Authority of Snohomish County
                 Pam Frost, Finance Director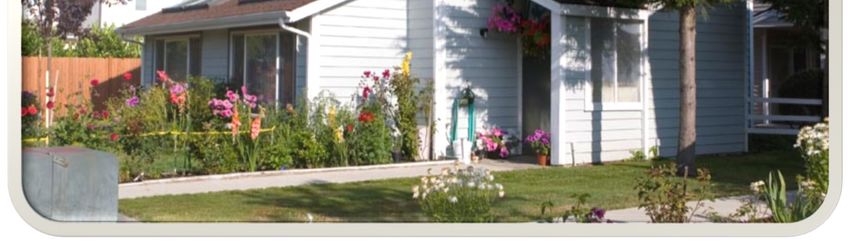
Presented to the Housing Authority of
Snohomish County’s Board of Commissioners
         • Joseph Alonzo, Chair
         • Gary Weikel, Vice Chair
         • Amy Rusko, Commissioner
         • Jeffrey Wallace, Commissioner
         • Maddie Metzger‐Utt, Commissioner
         • Kyoko Matsumoto Wright, Commissioner

Our mission is to meet the diverse needs of Snohomish County residents by expanding housing
opportunities that promote stability, strengthen community and provide affordability.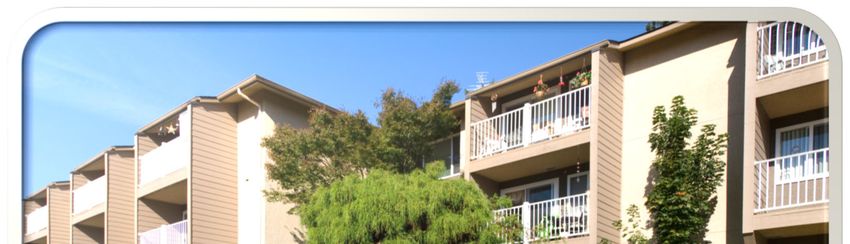
HASCO Agency Goals

• Property Acquisition and Program Expansion – Expand our reach physically
  and through influence/involvement with community and local governments.
• Invest in People – Attract and employ high quality experts in their fields and
  provide employee training and development to support professional growth.
• Increase Client Services – Expand client services and outreach with a focus
  on education, job and life skill development.

HASCO Core Values
• Diversity – We respect and encourage diversity in all its forms. We draw strength through
  our differences and actively seek out other perspectives.
• Integrity – We perform at a high level in support of our mission. We are honest in our
  communication. We follow through with our commitments. We fix our mistakes.
• Service – We exist to serve our community: families, landlords, and neighbors. We balance
  empathy and understanding with accountability in all our interactions.
• Stewardship – We take seriously our mission to maintain and expand housing as an asset to
  the community and to best use our financial resources to assist the greatest number.
• Team Work – We work best together – collaborating and creatively solving problems. We
  embrace the challenge of our work in a spirit of partnership.

Table of Contents

• Introduction                1
• Review of Key Objectives    6
• Organizational Overview    14
• Debt                       20
• Staffing                   27
• Budget Summaries           34
• Summary                    51

Review of Key Objectives

                           Westend
HOUSING AUTHORITY OF SNOHOMISH COUNTY
                                                                                    Consolidated Operating Budget Proposal
                                                                                 For the period July 1, 2021 through June 30, 2022

Enclosed is the proposed budget for fiscal year 2022 for your consideration.

Locally and worldwide the economic climate is in distress due to the COVID‐19 pandemic. Governor Inslee has prohibited property owners from increasing rents and has set a temporary moratorium on
evictions of tenants for non‐payment of rent through June 30, 2021, and it is unknown if this will be extended or if new conditions will be placed on the collection of past‐due rent. Vacancy rates are currently
very low, and if the unemployment rate continues to stabilize, we are hopeful that vacancy rates will remain low. Even considering the slowed increase in rental rates, housing prices and rents are still
unaffordable for many residents of our County. There will continue to be demand for our rental properties due to our rents being $200 ‐ $300 below market rates.

We are continuing to invest in technology to streamline and improve our processes. We replaced all office computers in fiscal year 2020 due to a Microsoft operating system upgrade and then had to scramble
to move all but essential personnel out of the main office in mid‐March due to the Pandemic. We’re in the process of purchasing laptops for many employees to make their working‐from‐home experience
better. We’re also continuing to research other paperless options.

                                                                                    HOUSING CHOICE VOUCHER PROGRAM

HUD’s published fair market rents (FMR’s) increased 11% from 2019 to 2020 yet decreased in 2021. We kept our same Payment Standards which put us closer to 100% of FMR instead of the previous
90%. We have remained in a positive cash flow position since the end of 2019 when we were in shortfall and continue to monitor HUD’s 2‐year tool as we balance our lease‐up rate against potential future
shortfalls. Increases in per unit costs (PUC) are anticipated after the Governor’s order on rent increases is lifted which could result in a possible reduction in the number of families that will get assistance. We
are currently leasing up targeted funding vouchers in the Emergency Housing Voucher (EHV) and Mainstream voucher programs. We received CARES Act Supplemental Admin Fees in May 2020 and
additional CARES Act funds in August 2020 and were allowed to use these funds, totaling nearly $1.6 million, for all currently eligible Housing Choice Voucher activities as well as newly eligible activities
related to COVID‐19.

As fiscal year 2021 draws to a close we have continued uncertainty. If rents increase as predicted once the Governor’s order is lifted, HAP may not be enough and may lead to another funding shortfall. We
currently have a total of 330 VASH vouchers, and our ACC total is 4,131, an increase of 315 vouchers, 220 of which are Mainstream, 25 VASH, and 70 EHV.

                                                                                              HOUSING PROGRAMS

We continue to utilize cash flow to upgrade our previous Public Housing units to compete in the marketplace although at a much slower pace in fiscal year 2021 due to lower vacancies. As units are rehabbed
we are able to charge market rents on those units. Our bond projects are our other work force housing. We have benefitted from a moderately strong rental market over the last few years yet are uncertain if
this will continue. Any modest rent increases will be delayed until the Governor’s order is lifted. We are forecasting a reduction in rental revenue due to unpaid rents and possible higher vacancies, however
it is difficult to predict with any certainty the impact that COVID‐19 will have on our bottom line. Our properties have recently benefitted from the US Treasury Department’s Emergency Rental Assistance
Program (ERAP) rental assistance provided through the VOA, and we are anticipating additional rental assistance soon. We continue to use conservative money‐management techniques and may delay non‐
critical maintenance projects to conserve cash if necessary.
Our remaining projects are our senior and disabled housing, some of which is subsidized through USDA ‐ Rural Development, and by project‐based vouchers. We hope to implement a rent increase at
these properties once we are allowed. This increase is primarily funded by USDA since most tenants are already paying 30% of their income for their rent portion. The subsidy attached to these units
provides a valuable resource to the community. We continue to accumulate reserve funds for long term improvements; however, we are also spending these funds for much‐needed capital improvements.

                                                                                             OTHER INITIATIVES

We continue to look for new opportunities to expand awareness of affordable housing issues in the County. As part of that goal we are proposing in this year’s budget to again contribute operating
funding to support the work of the Alliance for Housing Affordability (AHA). We believe this continues to be necessary to support the efforts of local jurisdictions to work together on regional housing
solutions. We are continuing in our role as the fiscal agent for AHA.

Transit‐oriented affordable housing development in south Snohomish County continues to be a priority of our real estate development activities, although we anticipate delays due to projects that are in
our existing pipeline. These are redevelopment of Whispering Pines in Lynnwood, rezone and redevelopment of Timberglen & Pinewood in Lynnwood, and building a 26‐unit complex on property that is
adjacent to Westend in Marysville.

                                                                                                   STAFFING

The FY 2021 budget includes 87 FTE’s, or full‐time equivalents, which is the total full‐time positions. This is a net increase of 8, as the Tenant Based Assistance division has been expanded to service the
increase in vouchers. There is one open position. Medical, retirement and other benefits have remained the same as last year. The employeeʹs participation rate for medical insurance premiums is
budgeted to remain at 20%.

The proposed budget includes merit pay increases as well as a proposed cost of living adjustment (COLA) of 1.6%, which was the percentage increase of the Consumer Price Index – Urban Wage Earners
and Clerical Workers index (CPI‐W) for the calendar year for the Seattle/Tacoma/ Bremerton area as published by the federal Bureau of Labor Statistics.

                                                                                  MANAGEMENT AND INSPECTION FEES

We continue to use the management fee approach recommended by HUD after the passage of the Quality Housing and Work Responsibility Act of 1998 (QHWRA). The recommendation was to adopt
asset management‐based model for property management whereby the manager/owner would charge various fees to the properties for the services they provide. HUD based its initial fees on the fees
established and used in its Multi‐family programs. HUD also encouraged adoption of a fee for service approach to the Housing Choice Voucher (Section 8) program.

USDA RD has also issued administrative notices indicating fee for service is the required approach. Rural Development fees are also established by regulations and are currently capped at $66 per unit per
month. Rather than allocating overhead costs to various projects, we accumulate these overhead costs in Local/Overhead and then bill out various fees to each project in order to recover our overhead
expenses. We also apply fees to our HASCO Communities and Fair Market Rental Programs and attempt to make up any shortfalls by adjusting the asset management fee where necessary. We increased
these fees by $5 per unit per month, or 7%, this year due to the anticipated sale of the scattered site duplexes and demolition of Whispering Pines prior to the rebuild, reducing the revenue needed to cover
overhead costs.

While we continue to use the management fee approach, we are consolidating the management fee, asset management fee, and the bookkeeping fee in a single $66‐$75 per unit month fee. We continue to
keep the inspection department under the management of the HCV department. The expenses related to inspections will be directly paid by the administration fee received from HUD rather than charging
an inspection fee as we did in past years.

Below is a summary of the fee estimates to be used for each project or program.
Management Fees by Property
             Program   Unit/Yr       Rate       Yr Fee                  Program         Unit/Yr     Rate       Yr Fee
 Willow Run                 1,008    $ 66   $      66,528   Alpine Ridge East                564   $ 50    $      28,200
 Hilltop House I               240   $ 66   $      15,840   Alpine Ridge South               552   $ 50    $      27,600
 Hilltop House II              120   $ 66   $       7,920   AIDS Units                        24   $ 75    $       1,800
 River Vista I                 240   $ 66   $      15,840   East Terrace III                 144   $ 75    $      10,800
 River Vista II                240   $ 66   $      15,840   Thomas Lake                      600   $ 75    $      45,000
 Wrobliski Manor               384   $ 66   $      25,344   Raintree                       1,344   $ 75    $    100,800
 Craigmont                     432   $ 66   $      28,512   Valley Commons                   612   $ 75    $      45,900
 Glenwood                      552   $ 66   $      36,432   Millwood Estates               3,600   $ 75    $    270,000
 Soap Suds                      48   $ 75   $       3,600   Edmonds Highlands              1,440   $ 75    $    108,000
 Trillium                      480   $ 75   $      36,000   Ebey Arms                        648   $ 75    $      48,600
 Woodlake Manor III            288   $ 75   $      21,600   Bristol Square                 1,152   $ 75    $      86,400
 Centerhouse                   528   $ 75   $      39,600   Autumn Chase                   1,440   $ 75    $    108,000
 Timberglen                    384   $ 75   $      28,800   Carvel Apartments              2,760   $ 75    $    207,000
 Robin Park                    360   $ 75   $      27,000   Aurora House                      12   $ 275   $       3,300
 North Terrace                 144   $ 75   $      10,800   Headstart                         12   $ 275   $       3,300
 Stevens Circle                228   $ 75   $      17,100
 Alderwood                     300   $ 75   $      22,500   Section 8 Bookkeeping Fee      45,265 $ 7.50 $      339,484
 Pinewood                      300   $ 75   $      22,500   Section 8 Management Fee    3,668,000    20% $      733,600
 Centerwood                    240   $ 75   $      18,000
 Maplewood                     180   $ 75   $      13,500   Total Management Fees                          $ 2,689,640
 East Terrace                  312   $ 75   $      23,400
 Cedar Grove                   336   $ 75   $      25,200
Basis of Budgeting
               vs. Basis of Accounting
HASCO uses the GAAP basis of accounting & budgeting with the following exceptions:

•   HASCO uses a modified accrual basis for budgeting
     • The budget does not include accounting adjustments necessary to meet reporting requirements.
        These include the timing recognition of certain accrued liabilities (such as accrued payroll
        compensation) ordinarily performed at fiscal year end.
     • Revenue is recognized in the period it becomes available and measurable; expenditures are reported
        when the liability is incurred, if measurable.
•   The budget document does not include any “below the line” expenses. Examples of those expenses are
    extraordinary maintenance and depreciation. We are including debt payments to illustrate cash flow.
•   The budget document does not include any of our tax credit properties.
•   Capital needs are not included in this operations budget.
Fiscal Year 2021 Highlights • Launched HASCO’s new website and hired a communications manager to help bring HASCO and its mission greater visibility. • Rolled out online application portal. • Successfully passed cyber security audit looking for vulnerabilities. • Remained 100% leased up with minimal vacancy loss at all properties. • Improved Resident relations as staff further engaged by listening and linking residents to outside resources. • Began preliminary site planning and design for development of 26 units on Cedar St in Marysville. • Engaged staff in racial equity training.
Fiscal Year 2021 Highlights
                (cont’d.)

•   Developed COVID resources page on HASCO Website.
•   Opened the online wait list lottery for Mainstream‐eligible voucher applicants.
•   Became a Family Community Supports certified provider.
•   Maintained our A+/Stable rating with S&P Global Ratings.
•   Paid off $4.6M Bristol Square FNMA loan.
•   Updated the Admin Plan to remove policies that have a disparate impact on people of color.
•   Shifted S8 inspections to an entirely paperless process.
•   Processed 7,555 Section 8 certifications.
•   Successfully passed annual financial audit.
•   Office entrance and front desk area have been remodeled for visitor and employee safety.
Budget Summary – Major Assumptions • HASCO operates on a fiscal year from July 1 through June 30. • COLA increase of 1.6% for all employees. • HASCO will administer 4,053 HAP vouchers based on a subsidy that is calculated by HUD based on CY2020 numbers. • HCV administrative fees are based on FY2020 rate levels prorated at 82% of projected eligibility, up from 81%. • HASCO projects continued near‐zero vacancy for all units. New vacancies will be made available to displaced tenants from Whispering Pines.
Organizational Overview

                          Stevens Circle
FUND DESCRIPTIONS AND FUND STRUCTURE
A fund is an independent fiscal and accounting entity with a self‐balancing set of accounts. Fund accounting distinguishes funds based on their intended purpose and assists
management to present and verify compliance regarding finance‐related legal and contractual provisions. While HASCO uses the enterprise fund type and its measurement
focus is generally the same as that used by commercial entities, it does maintain separate accounting for resources that have unique uses and reporting requirements. We have
updated the fund titles to match the website descriptions.
Housing Choice Vouchers: Commonly referred to as Section 8, HASCO administers the Federal Government’s primary program for assisting low‐income families, the elderly,
and the disabled. HASCO receives funds from HUD to pay housing subsidy directly to landlords on behalf of the participating resident. HUD provides two sources of funding
to HASCO:
Rental subsidy to be paid directly to landlords for rent, and directly to participating residents for utility subsidy. These are the only costs allowed to be paid from
HAP funds.
Administrative fees, which are used to pay the administrative costs of managing the program.
Fair Market Rental Properties: These communities the Housing Authority owns and contracts with third‐party property management companies to manage the day‐to‐day
operations. There are no subsidies attached to these communities. Restricted to 50% of the units must be occupied by tenants with less than 80% of median income.
Seniors and People with Disabilities Properties: Senior / young‐disabled properties owned by HASCO and operated by HASCO staff. Most of these communities are financed
through the USDA program; the rest are heavily subsidized by the PBV program.
HASCO Communities: Our formerly low‐income housing portfolio; we own and manage these properties. There are no subsidies attached to these communities. Restricted to
50% of the units must be occupied by tenants with less than 80% of median income.
Manufactured Homes: Manufactured homes within designated parks. Residents own their own home and are responsible for its care and maintenance and pay a monthly pad
rent. HASCO owns and manages the land and common structures. Alpine Ridge is an age‐restricted (55+) community.
Other Miscellaneous Funds: This category includes our local fund, used for operating the day‐to‐day operations of HASCO; funds that have singular purpose or are a joint
venture with another entity; and the management of the tax credit properties.A4
The greatest source of revenue for the
Housing Authority is the housing
assistance payments received from
HUD, which we estimate to exceed $56
million in FY2022. The Housing
Authority is also budgeting to receive
over $24 million in tenant rentals on our
affordable, rural development, and
market rate properties. The remaining
expected revenue streams will be the
monthly management fees received
from each of our properties, portability
reimbursements and fees,
miscellaneous tenant revenues such as
parking fees and utility reimbursements
on our market rate properties, and
interest on our investments.
On the expense side, lease payments
to Section 8 landlords account for
most of the total expenditures.
Salaries & benefits typically are the
second largest expenditure. We
expect to spend nearly $3.8 million on
maintenance and labor expenses for
our owned properties. The remaining
expenses are fees for management of
the properties, utilities, interest on
outstanding debt, and office and
professional services.
Debt

       Thomas Place
DEBT SERVICE SUMMARY
Housing Authority of Snohomish County
DEBT MANAGEMENT POLICY
Because the Authority has no taxing powers, each project for which debt is issued should be self‐supporting to the greatest extent possible. It is the Authority’s intention to underwrite
and issue debt for long‐term needs and specific projects with the intention that each project be self‐supporting, and to manage the use of debt so that debt service payments will be a
manageable part of each project’s operating budget.
In general, the Authority will attempt to raise capital at the lowest possible cost. This will be dependent on the fundamentals of the project and/or specific conditions of credit markets at
the time a project is financed.
DEBT SCHEDULES
The Housing Authority currently has eleven (11) revenue bond issues outstanding along with other notes and loans payable. Three (3) of these bond issues are conduit bond issues
whereby we have loaned the proceeds to private sponsors. The remaining eight (8) revenue bond issues are for projects owned directly by the Housing Authority.
I have included a chart that summarizes the debt service payments the Housing Authority anticipates making in fiscal year 2022. The second chart, below, outlines our anticipated debt
service for all Authority bond issues currently outstanding for the next 5 years.
This schedule does not include conduit financed projects. As you can see from the chart, annual debt service for our projects is approximately $6.3 million per year through 2027. In FY
2031 a balloon payment of approximately $6.7 million will be due for Autumn Chase unless the project is refinanced.
CONDUIT BOND ISSUES
From time to time the Authority has issued debt for the purpose of providing financing for projects owned by other sponsors in the County. The Housing Authority issues the debt and
loans the proceeds to the private sponsor. The private sponsor is then responsible for repayment of the debt through the terms of a loan and regulatory agreement.
There are three (3) such bond issues outstanding. One of these bond issues is for our own tax credit partnership, Olympic and Sound View. Another tax credit project where the Housing
Authority assisted with financing was the Avondale Village project for Housing Hope. The remaining projects were refinanced and were developed by the Snohomish Affordable
Housing Group, a non‐profit sponsor operating in the City of Snohomish.
It is important to remember that although we do not include these projects in our operating budgets, these outstanding bonds are liabilities of the Housing Authority, are reported on our
financial statements, and do contribute to our total outstanding liabilities. The outstanding balances are included in the debt schedule of our audited financial statements each year.SENIORS AND PEOPLE WITH DISABILITIES PROJECTS
The two revenue bond issues associated with Rural Development Projects were for the Pooled Project; where the proceeds were used to refinance Willow Run, Hilltop House 1 & 2, River
Vista 1 & 2, and Wrobliski Manor, and to complete the purchase of Fairview and Woodlake Manor III. We have since sold Fairview to Housing Hope and repaid that portion of the
revenue bond. The interest credit notes are federally subsidized loans which effectively reduce the interest rate of the loans to 1%.
FAIR MARKET HOUSING DEBT
Our remaining six (6) revenue bond issues were for acquisition of projects in our market rate housing portfolio. The Thomas Place and the Alpine Ridge (Squire and Kingsbury) Mobile
Home Parks also have several other deferred loans that were secured from the State or the County in order to acquire and develop the parks. These loans have unique deferral or
repayment features. We paid off the outstanding bond on Millwood Estates on July 9, 2018. On September 13, 2018, we acquired Carvel Apartments with a $70 million Revenue
Note. The Housing Authority issued refunding revenue bonds in the par amount of $68,290,000 on April 10, 2019, that were used to refund the $70 million interim loan with Key
Bank. We pledged the Housing Authority General Revenues when issuing these bonds rather than property deeds of trust and had S&P rate the bonds. We will continue to report our
General Revenues each year while this bond issue is outstanding. We paid off the debt for Bristol Square in February 2021 using interfund loans from Edmond Highlands and Westend.
MISCELLANEOUS DEBT
The Housing Authority also has several issues of miscellaneous debt. Several are deferred loans from the State for the Aids Housing facility and Ebey Arms. The others are recoverable
grants that eventually may be forgiven or are interest‐only notes, such as for Olympic and Sound View LLC, which provided long term bridge financing for the tax credit
partnership. Many of these loans and notes payable have unique repayment, deferral, or forgiveness features which are meant to further the long‐term affordability of the projects they
were awarded to. As reminder, the outstanding balances are included in the debt schedule of our audited financial statements each year and can be found on HASCO’s website.HASCO Property Valuation vs. Debt
Manufactured Homes HASCO Communitites Fair Market Properties Elderly & People with Disabilities HASCO Managed Local
Property Valuation DebtStaffing
CenterwoodHASCO Employee Attributes • Authentic – We are all unique individuals who seek to bring our full selves to work. We share our personalities and interests and celebrate each other’s successes and personal milestones. • Dedicated – We are fully committed to our mission and shared sense of purpose. We strive to continuously learn and grow in support of our work. • Kind and Compassionate – We care about the people we work for and work with. We demonstrate compassion, empathy and a desire to help. • Professional – We are confident, calm and consistent. We clearly communicate our policies and work with our clients to resolve problems. • Respectful – We treat all people with respect and dignity acknowledging them as individuals with unique circumstances and needs.
Staffing
        • Departments continue to be reorganized to bring staff
          responsibilities in line with work performed.
        • Employee tenure average is 8.4 years, and our longest‐
          tenured employee has worked with us 29 years.
        • Hired 13 new employees and promoted 10 employees.

Department                FY17 FTE   FY18 FTE   FY19 FTE   FY20 FTE   FY21 FTE   FY22 FTE
Administrative Services     10         11          12         16        15          18
Asset Management             24        25          27         27        27          27
Development and Policy       5          5          5          5          0          0
Executive                    7          7          7          2          3          4
Finance                      8          8          8          9          10         10
Tenant Based Assistance      14         16         17         21         23         28
Unassigned                                         1          1          1          1
Total                        68         72         77         81         79         88
Fiscal Year 2022 Budget Summaries
Olympic View
Consolidated by divisionFiscal Year 2022 Budget
Elderly & HASCO
Manufactured HASCO Fair Market People with Managed
Total Local Section 8 HCV Housing Communities Properties Disabilites Properties
Tenant Revenue 26,210,724 205,440 819,780 4,331,035 18,091,214 2,577,639 185,616
HUD PHA Operating Grants 56,577,276 56,577,276
Fee Revenue 2,702,996 2,702,996
Other Operating Revenue 3,633,540 12,100 3,621,440
Investment Income ‐ Unrestricted 38,200 1,500 500 8,490 24,010 3,000 700
Operating Revenue $ 89,162,736 $ 2,920,536 $ 60,200,216 $ 820,280 $ 4,339,525 $ 18,115,224 $ 2,580,639 $ 186,316
Wages & Benefits 10,080,879 2,910,445 2,784,953 178,948 979,635 2,129,941 770,930 97,249
Office Expenses 7,397,482 439,972 1,490,422 275,002 853,594 3,556,803 735,674 38,970
Maintenance Expenses 2,139,415 22,737 544 49,765 406,834 1,378,402 257,584 23,549
Housing Assistance Payments 56,055,000 110,000 55,945,000
Other Expenses 221,376 3,400 750 6,000 56,835 126,841 27,550
Operating Expense $ 75,894,152 $ 3,486,554 $ 60,221,668 $ 509,716 $ 2,296,898 $ 7,191,987 $ 1,791,737 $ 159,768
Net Income / (Loss) from Operations $ 13,268,584 $ (566,018) $ (21,452) $ 310,564 $ 2,042,627 $ 10,923,236 $ 788,902 $ 26,548
Required Annual Debt Principal 3,302,005 129,446 274,645 2,496,260 401,654
Interest Expenses & Amortization 3,904,085 128,743 122,792 3,583,920 68,630
Net Income / (Loss) $ 6,062,494 $ (566,018) $ (21,452) $ 52,376 $ 1,645,190 $ 4,843,056 $ 318,617 $ 26,548
*Totals may not sum across because tax credit properties are not included in the budget presentationFiscal Year 2022 Budgeted Cash Flow
Elderly & HASCO
Manufactured HASCO Fair Market People with Managed
By Properties Local Section 8 HCV Housing Communities Properties Disabilites Properties
Cash Receipts from Tenants 25,153,030 205,440 819,780 4,329,135 18,233,368 1,379,692 185,616
Cash Receipts from Govt Grants 56,477,276 56,477,276
Cash Receipts from Other Sources 6,436,536 2,715,096 3,721,440
Cash Payments to Suppliers for Goods & Services (15,369,871) (557,040) (1,392,884) (330,770) (1,315,626) (10,081,855) (1,624,651) (61,770)
Cash Payments for Housing Assistance (56,028,000) (56,028,000)
Cash Payments to Employees for Wages/Benefits (10,080,879) (2,910,445) (2,784,953) (178,948) (979,635) (2,129,941) (770,930) (97,249)
Net Cash Provided/(Used) by Operating Activities $ 6,588,093 $ (546,950) $ (7,121) $ 310,061 $ 2,033,874 $ 6,021,572 $ (1,015,889) $ 26,596
Cash Received from Grantors 1,105,133 1,105,133
Other non‐capital proceeds 64,200 64,200
Net Cash Provided/(Used) by Non‐Capital Financing $ 1,169,333 $ 64,200 $ 1,105,133
Purchase or Construction of Capital Assets 3,491,723 246,574 50,892 424,394 2,468,831 259,650 41,381
Proceeds from / (Repayment of) LT Debt or Loans (6,793,728) (246,574) (180,338) (699,039) (4,965,091) (661,305) (41,381)
Interest & Fees Paid on LT Debt or Loans (3,892,785) (127,243) (116,992) (3,579,920) (68,630)
Net Cash Provided/(Used) by Capital Financing $ (7,194,790) $ (0) $ (256,689) $ (391,637) $ (6,076,180) $ (470,285) $ (0)
Interest Received 38,200 1,500 500 8,490 24,010 3,000 700
Net Cash Provided/(Used) by Investing Activities $ 38,200 $ 1,500 $ 500 $ 8,490 $ 24,010 $ 3,000 $ 700
Net Increase/(Decrease) in Cash & Equivalents $ 600,835 $ (482,750) $ (5,621) $ 53,873 $ 1,650,727 $ (30,598) $ (378,041) $ 27,296Fiscal Year 2022 Budgeted EBITDA
(in millions)
Operating Revenue,
$89,163
Wages & Maint. Office Debt
Housing Assistance Payments, Benefits, Expenses, Expenses, Prin., EBITDA,
$56,055 $9,852 $7,877 $7,623 $3,302 $4,453A9
EBITDA Margin
The EBITDA Margin is a ratio that measures how our net position is measured against our revenue,
shown as a percentage. It can be seen as a more precise measure of operational efficiency. Because
the Section 8 program is designed to spend all of the funds it receives, its EBITDA Margin is 0.
HASCO
Communities, 41%
Manufactured
HASCO Managed
Housing, 22%
Properties, 14%
Fair Market
Properties, 18%
Elderly & Section 8 HCV, 0%
People with
Disabilites,
‐9%
Local, ‐19%HASCO Communities Alderwood – 25 units in Lynnwood Cedar Grove – 28 units in Marysville Center House – 44 units in Everett Centerwood – 20 units in Everett East Terrace – 40 units in Mountlake Terrace Maplewood – 15 units in Snohomish North Terrace – 12 units in Mountlake Terrace Pinewood – 25 units in Lynnwood Robin Park – 30 units in Lynnwood Stevens Circle – 19 units in Lake Stevens Timberglen – 32 units in Lynnwood Trillium – 40 units in Mountlake Terrace
A8

                                                            FY2022 HASCO Communities Budget by Property
                                              HASCO                                     Center                                                   North                                                   Aurora                                     Stevens
                                            Communities Alderwood       Cedar Grove     House       Centerwood      E. Terrace   Maplewood      Terrace       Pinewood     Robin Park      Trillium      House         Headstart    Timberglen       Circle
         Tenant Revenue                         4,331,035     348,774       387,906       537,870       276,640        389,499      182,688       135,264        349,902       424,160       566,280        12,060         10,776       460,800       248,416
         Investment Income ‐ Unrestricted           8,490         600                         225           325            500        1,200           125            425           800           450         2,400          1,440
       Operating Revenue                    $   4,339,525 $   349,374 $     387,906 $     538,095 $     276,965 $      389,999 $    183,888 $     135,389 $      350,327 $     424,960 $     566,730 $      14,460 $       12,216 $     460,800 $     248,416
         Wages & Benefits                        979,635       76,770       108,946        89,252        50,689         91,793       80,107        50,518         56,689        82,221       101,660           718            718       120,653        68,903
         Office Expenses                         853,594       54,736        75,386       109,856        51,080         97,356       38,952        32,001         57,876        74,406       107,717         4,823          4,040        86,730        58,352
         Maintenance Expenses                    406,834       26,404        45,578        50,260        29,660         44,406       16,797        15,623         30,923        38,768        39,203                          820        40,127        28,265
         Other Expenses                           56,835                     16,000        27,295         1,550                                                                  1,850           600                                                    9,540
       Operating Expense                    $   2,296,898 $   157,910 $     245,910 $     276,662 $     132,979 $      233,554 $    135,856 $      98,141 $      145,489 $     197,245 $     249,180 $       5,541 $        5,578 $     247,510 $     165,061

      Net Income / (Loss) from Operations   $   2,042,627 $   191,464 $     141,996 $    261,433 $      143,986 $      156,445 $     48,032 $      37,248 $      204,838 $    227,715 $      317,550 $       8,919 $        6,638 $     213,290 $      83,355
         Required Annual Debt Principal          274,645                                   87,645                                                                                             85,000                                    102,000
         Interest Expenses & Amortization        122,792                                   56,811                                                                                             65,981
     Net Income / (Loss)                    $   1,645,190 $   191,464 $     141,996 $     116,977 $     143,986 $      156,445 $     48,032 $      37,248 $      204,838 $     227,715 $     166,569 $       8,919 $        6,638 $     111,290 $      83,355
Seniors & People with
Disabilities
Craigmont – 36 Units in Lake Stevens
Glenwood – 46 Units in Lake Stevens
Hilltop House – 30 Units in Stanwood
River Vista – 40 Units in Arlington
Willow Run – 84 Units in Marysville
Wrobliski Manor – 32 Units in Arlington
PBV Units – 42 units in Snohomish & Mtlk TerraceFY2022 Elderly & People with Disabilities Budget by Property
Elderly &
People with Woodlake
Disabilites Craigmont Glenwood Hilltop River Vista Willow Run Wrobliski Soap Suds Manor
Tenant Revenue 2,577,639 318,532 429,498 243,908 311,122 664,653 267,022 55,145 287,760
Investment Income ‐ Unrestricted 3,000 500 1,500 100 900
Operating Revenue $ 2,580,639 $ 318,532 $ 429,998 $ 243,908 $ 311,122 $ 666,153 $ 267,022 $ 55,245 $ 288,660
Wages & Benefits 770,930 104,158 126,917 75,539 111,516 180,559 89,076 14,069 69,097
Office Expenses 735,674 115,399 156,525 82,949 88,664 155,205 77,446 11,580 47,906
Maintenance Expenses 257,584 33,454 32,398 31,438 31,477 66,487 33,360 8,253 20,717
Other Expenses 27,550 6,022 8,112 269 7,158 752 5,237
Operating Expense $ 1,791,737 $ 259,033 $ 323,953 $ 190,195 $ 238,815 $ 403,002 $ 205,118 $ 33,902 $ 137,720
Net Income / (Loss) from Operations $ 788,902 $ 59,499 $ 106,046 $ 53,713 $ 72,307 $ 263,150 $ 61,904 $ 21,343 $ 150,940
Required Annual Debt Principal 401,654 50,010 28,124 39,291 49,898 135,104 63,857 35,370
Interest Expenses & Amortization 68,630 9,210 7,550 10,050 21,140 8,160 12,521
Net Income / (Loss) $ 318,617 $ 9,489 $ 68,711 $ 6,873 $ 12,359 $ 106,906 $ (10,112) $ 21,343 $ 103,049Market Rate Rentals
Autumn Chase – 120 Units in Bothell
Bristol Square – 96 Units in Lynnwood
Carvel – 230 Units in Mukilteo
Ebey Arms – 54 Units in Marysville
Edmonds Highlands – 120 Units in Edmonds
Millwood Estates – 300 Units in Lynnwood
Raintree Village – 112 Units in Everett
Valley Commons – 51 Units in Marysville
We are not budgeting Whispering Pines due to pending demolition.FY2022 Fair Market Properties Budget by Property
Fair Market Edmonds Millwood Raintree Valley
Properties Autumn Chase Bristol Square Carvel Ebey Arms Highlands Estates Village Commons
Tenant Revenue 18,091,214 2,314,871 1,489,706 4,509,172 618,284 2,062,410 4,968,969 1,359,612 748,254
Investment Income ‐ Unrestricted 24,010 5,000 2,500 1,460 700 4,800 3,200 5,350 1,000
Operating Revenue $ 18,115,224 $ 2,319,871 $ 1,492,206 $ 4,510,632 $ 618,984 $ 2,067,210 $ 4,972,169 $ 1,364,962 $ 749,254
Wages & Benefits 2,129,941 283,930 173,051 482,359 93,564 263,895 589,136 153,068 71,872
Office Expenses 3,556,803 484,060 320,194 761,899 200,447 374,755 980,136 274,678 158,759
Maintenance Expenses 1,378,402 192,952 120,925 287,465 58,065 158,658 398,353 92,881 69,103
Other Expenses 126,841 7,539 4,700 4,811 15,470 11,651 15,475 38,866 28,329
Operating Expense $ 7,191,987 $ 968,481 $ 618,870 $ 1,536,534 $ 367,546 $ 808,959 $ 1,983,100 $ 559,494 $ 328,063
Net Income / (Loss) from Operations $ 10,923,236 $ 1,351,390 $ 873,336 $ 2,974,098 $ 251,438 $ 1,258,251 $ 2,989,069 $ 805,468 $ 421,191
Required Annual Debt Principal 2,496,260 237,110 482,220 671,280 80,430 295,000 528,720 117,800 83,700
Interest Expenses & Amortization 3,583,920 308,371 1,579,106 34,825 246,944 1,244,425 99,510 70,739
Net Income / (Loss) $ 4,843,056 $ 805,909 $ 391,116 $ 723,712 $ 136,183 $ 716,307 $ 1,215,924 $ 588,158 $ 266,752Manufactured Homes Alpine Ridge – 93 Homes in Lynnwood Thomas Place – 50 Homes in Everett
FY2022 Manufactured Housing
       Budget by Property
                                       Manufactured
                                         Housing       Alpine Ridge   Thomas Place
    Tenant Revenue                           819,780        571,380        248,400
    Investment Income ‐ Unrestricted             500                           500
  Operating Revenue                    $     820,280 $      571,380 $      248,900
    Wages & Benefits                         178,948        117,119         61,829
    Office Expenses                          275,002        170,565        104,436
    Maintenance Expenses                      49,765         36,777         12,988
    Other Expenses                             6,000                         6,000
  Operating Expense                    $     509,716 $      324,461 $      185,254

 Net Income / (Loss) from Operations   $     310,564 $      246,919 $       63,646
    Required Annual Debt Principal           129,446        125,000          4,446
    Interest Expenses & Amortization         128,743        128,240            503
Net Income / (Loss)                    $      52,376 $        (6,321) $     58,697
HCV Program (Section 8)
# of Hshlds
in Avg Avg Tenant
Bdrm Bedroom Contract Tenant Portion of
HASCO HCV Demographics Size Size Rent Rent Rent
Total Number of Households Evaluated 4,089 0 34 $1,037 $206 20%
Total Number of Family Members 8,855 1 1,379 $1,144 $220 19%
Avg Annual Income $16,802 2 1,512 $1,364 $251 18%
% of Households with Disabled Member 60% 3 820 $1,756 $382 22%
% of Households with Non-Elderly Disabled 36% 4 290 $2,173 $454 21%
% of Disabled Seniors 23% 5 45 $2,446 $387 16%
% Non-Disabled Senior Households 11% 6 6 $2,024 $331 16%
% Families with Children 37% 7 3 $2,420 $198 8%FY2022 Housing Choice
Vouchers Budget
HUD PHA Operating Grants 52,500,000
Housing Assistance Payments 52,400,000
Net Restricted Position $ 100,000
Unrestricted Income Received $ 7,700,216
Wages & Benefits 2,784,953
Office Expenses 1,408,716
Ports & Related Expenses 3,628,000
Expenses Paid from Admin Fees $ 7,821,668
Unrestricted Net Position $ (121,452)Local Operations Local Operations funds the research of projects under consideration, office management, and the administration of the tax credit properties. We intend to make significant investments in fiscal year 2022 to improve office technology, provide staff with appropriate training and support, and continue to participate in housing advocacy efforts. Because local operations will no longer be receiving management fees from Whispering Pines and the scattered sites, we anticipate a net loss in operations in fiscal year 2022. We will monitor local’s financial position and take appropriate steps to minimize or defer anticipated expenditures.
FY2022 Local
  Operations Budget
    Tenant Revenue                      205,440
    Fee Revenue                       2,702,996
    Other Operating Revenue              12,100
  Operating Revenue               $ 2,920,536
    Wages & Benefits                  2,910,445
    Office Expenses                     439,972
    Maintenance Expenses                 22,737
    Housing Assistance Payments         110,000
    Other Expenses                        3,400
  Operating Expense               $ 3,486,554

Net Income / (Loss)               $   (566,018)
Goals for Fiscal Year 2022
Willow RunPriorities for the coming year
• Lease up to 70 EHV vouchers.
• Analyze and execute technology solutions.
• Move accounts payable to a web‐based, paperless portal.
• Sell the scattered sites duplexes to fund new developments.
• Begin the demolition process for Whispering Pines.
• Offer a safe office‐based work environment for employees who plan to
return to the building. Continue to support employees working
remotely.Summary • The Housing Authority will continue to renovate our properties as funds allow to provide safe, comfortable, and affordable housing within the community. • Management will collaborate with community partners in order to find opportunities to support housing programs throughout the county. • Our staff is dedicated to helping individuals find resources to thrive in economical, clean, and secure homes, and to fairly administer those resources to ensure we meet all statutory and recommended reporting requirements. • Information technology will implement solutions to ensure we maximize our efficiency and financial stewardship. • The Housing Authority would like to thank the Board of Directors for their support of our vision and goals.
You can also read