Geographic barriers to achieving universal health coverage: evidence from rural Madagascar
←
→
Page content transcription
If your browser does not render page correctly, please read the page content below
Health Policy and Planning, 36, 2021, 1659–1670 DOI: https://doi.org/10.1093/heapol/czab087 Advance access publication date: 31 July 2021 Original Article Geographic barriers to achieving universal health coverage: evidence from rural Madagascar Andres Garchitorena1,2,* , Felana A Ihantamalala2 , Christophe Révillion3 , Laura F Cordier2 , Mauricianot Randriamihaja2,4 , Benedicte Razafinjato2 , Feno H Rafenoarivamalala2 , Karen E Finnegan2,5 , Jean Claude Andrianirinarison6,7 , Julio Rakotonirina6,8 , Vincent Herbreteau9 and Matthew H Bonds2,5 1 MIVEGEC, University Montpellier, CNRS, IRD, 911 Avenue Agropolis, 34394 Montpellier, Montpellier, France 2 NGO PIVOT, BP23 Ranomafana, 312 Ifanadiana, Madagascar 3 Université de La Réunion, UMR 228 Espace-Dev (IRD, UA, UG, UM, UR), 40 Av De Soweto, 97410 Saint-Pierre, Réunion, France 4 School of Management and Technological innovation, University of Fianarantsoa, BP 1135 Andrainjato, 301 Fianarantsoa, Madagascar 5 Department of Global Health and Social Medicine, Harvard Medical School, 641 Huntington Avenue, Boston, Massachusetts 02115, USA 6 Ministry of Public Health, Ambohidahy, 101 Antananarivo, Madagascar 7 National Institut of Public Health, Befelatanana, 101 Antananarivo, Madagascar 8 Faculty of Medicine, BP. 375, 101 Antananarivo, Madagascar 9 Institut de Recherche pour le Développement, UMR 228 Espace-Dev (IRD, UA, UG, UM, UR), B.P. 86, Phnom Penh, Cambodia *Corresponding author. Institut de Recherche pour le Développement, UMR MIVEGEC, 911 Avenue Agropolis, Montpellier 34394, France. E-mail: andres.garchitorena@gmail.com Accepted on 16 July 2021 Abstract Poor geographic access can persist even when affordable and well-functioning health systems are in place, limiting efforts for universal health coverage (UHC). It is unclear how to balance support for health facilities and community health workers in UHC national strategies. The goal of this study was to evaluate how a health system strengthening (HSS) intervention aimed towards UHC affected the geographic access to primary care in a rural district of Madagascar. For this, we collected the fokontany of residence (lowest administrative unit) from nearly 300 000 outpatient consultations occurring in facilities of Ifanadiana district in 2014–2017 and in the subset of community sites supported by the HSS intervention. Distance from patients to facilities was accurately estimated following a full mapping of the district’s footpaths and residential areas. We modelled per capita utilization for each fokontany through interrupted time-series analyses with control groups, accounting for non- linear relationships with distance and travel time among other factors, and we predicted facility utilization across the district under a scenario with and without HSS. Finally, we compared geographic trends in primary care when combining utilization at health facilities and community sites. We find that facility-based interventions similar to those in UHC strategies achieved high utilization rates of 1–3 consultations per person year only among populations living in close proximity to facilities. We predict that scaling only facility-based HSS programmes would result in large gaps in access, with over 75% of the population unable to reach one consultation per person year. Community health delivery, available only for children under 5 years, provided major improvements in service utilization regardless of their distance from facilities, contributing to 90% of primary care consultations in remote populations. Our results reveal the geographic limits of current UHC strategies and highlight the need to invest on professionalized community health programmes with larger scopes of service. Keywords: Community health, geographical information systems, healthcare utilization, health systems research, inequality Introduction to focus on financial coverage, such as through health insur- Despite considerable progress on the health-related develop- ance, in order to reduce out-of-pocket payments at health ment goals, every year five million children under 5 years die facilities, which are known to be barriers to care (Sachs, 2012; of treatable illnesses such as malaria, diarrhoea and respira- Garchitorena et al., 2017; Dhillon et al., 2011; Langlois tory infections. More than three and a half billion people lack et al., 2016; Zombré et al., 2017; Lagarde and Palmer, 2011; access to essential health services (The World Bank, 2017; Johri et al., 2014). However, there is growing recognition Fullman et al., 2017). At the recent 40-year anniversary of the that among the greatest challenges to accessing health care Alma Ata Declaration, 134 countries signed on to a renewed are geographic barriers: terrain, waterways and other factors commitment to universal health coverage (UHC) based on associated with physical distance between the patient and the a shared vision that primary health care and health services service (Feikin et al., 2009; McLaren et al., 2014; Gething be ‘high quality, safe, comprehensive, integrated, accessible, et al., 2012; Noor et al., 2003; Stock, 2012). The use of available, and affordable for everyone everywhere’ (World primary care decreases exponentially for populations living Health Organization, 2018a). In practice, UHC policies tend at increasing distance of primary healthcare centres (PHCs), © The Author(s) 2021. Published by Oxford University Press in association with The London School of Hygiene and Tropical Medicine. This is an Open Access article distributed under the terms of the Creative Commons Attribution License (https://creativecommons.org/licenses/by/4.0/), which permits unrestricted reuse, distribution, and reproduction in any medium, provided the original work is properly cited.
1660                                                                                 Health Policy and Planning, 2021, Vol. 36, No. 10

                                                                     international policies for UHC and community health to
  Key messages                                                       the national level in a context of limited resources. This
                                                                     island nation is one of the poorest countries in the world,
    • Limited geographic access to primary care is one of the        with among the least well-funded health systems (World
      most important and hardest challenges for achieving UHC        Bank, 2019). In 2014, Madagascar had less than three doc-
      and improving population health in developing countries.       tors, nurses and midwives per 10 000 people (World Health
    • There is little evidence on how health system change linked    Organization, 2019), with a lower concentration in rural
      to UHC affects the geography of health access, leaving open    areas, where over three-quarters of the population live
      questions about their effects on remote populations.           (Institut National de la Statistique, 2009). Access to health
    • We combined geographic data from hundreds of thousands         care is particularly low for the majority of the population liv-
      of patient records from a rural district’s health system to    ing more than 5 km away from a PHC (Garchitorena et al.,
      identify the impact of a HSS intervention on geographic        2017; World Health Organization, 2019; Kashima et al.,
      trends in access to care.                                      2012). To address this, the country has significantly increased
    • Our results provide evidence of the substantial gaps in care   health spending in recent years and, in 2015, it signed a
      that persist unless health systems integrate professional      national policy for UHC that is currently in its pilot phase
      community health programmes with an expanded scope of          (Government of Madagascar, 2015). Yet, the contribution of
      services.                                                      CHWs to improving primary care access in Madagascar is lim-
                                                                     ited, since CHWs work on a voluntary basis, manage mostly
                                                                     illnesses of early childhood, and significant challenges remain
known as the ‘distance decay’ effect (Feikin et al., 2009;           to support their activities (e.g. supervision and procurement).
McLaren et al., 2014; Gething et al., 2012; Noor et al., 2003;           Here, we take advantage of a natural experiment in
Stock, 2012). Distance decay in health access is equivalent to       global health, where an integrated, district-level health system
the effect of user fees (Bates et al., 2012), which can be more      strengthening (HSS) intervention aimed at achieving universal
directly reduced or eliminated (Sachs, 2012; Garchitorena            coverage at the local level was implemented in a rural district
et al., 2017; Dhillon et al., 2011; Langlois et al., 2016;           of Madagascar, ahead of the national scale up of the UHC
Zombré et al., 2017; Lagarde and Palmer, 2011; Johri et al.,         strategy. Starting in 2014, a non-governmental organization
2014).                                                               (NGO), partnered with the Government of Madagascar to
    While there is a considerable body of evidence on the rela-      establish a model health system in the southeastern district of
tionship between health system access and user fees, there is        Ifanadiana (∼200 000 people). A range of HSS programmes
surprisingly little evidence on the relationship between health      were initiated in a third of the district (see Supplementary
system change and the geography of health access. Studies            Table S1), removing user fees at health facilities, ensuring
suggest that geographic barriers to PHC persist even when            health system readiness (infrastructure, personnel and supply
user fees have been removed, making these approaches insuf-          chain), improving clinical programmes (maternal and child
ficient to reach full population coverage of primary care ser-       health) and supporting integrated information systems at all
vices (Nguyen et al., 2018; De Allegri et al., 2011; Mills et al.,   levels of care (community health, primary care facilities and
2008). The leading policy strategy for addressing geographic         the district hospital). Early results showed improved qual-
barriers is through community health workers (CHWs); i.e.            ity of primary care (Ezran et al., 2019), a tripling of facility
lay people who are trained to treat a subset of clinical cases       utilization rates (Garchitorena et al., 2018), and declines in
(World Health Organization, 2018b; 2010). Yet, little is             under-five and infant mortality rates in the first 2 years of
known about the effects of community health systems on               intervention (Garchitorena et al., 2018). Later, in 2016, these
the geography of health access or about their contribution           programmes were extended to include strengthened CHWs—
towards the realization of universal access to primary health        who were trained, supervised and equipped (Cordier et al.,
care. Can the leading policies designed to improve healthcare        2020; Bonds et al., 2017).
coverage—UHC and community health—actually overcome                      With a unique geographically explicit patient-level data
these key barriers?                                                  set encompassing all health centre visits in the district dur-
    In most developing countries, national policies consider         ing 4 years, the aim of this study was to examine the effect
CHWs as local volunteers, with minimum requirements of               of increasing financial coverage and strengthening the public
formal education. Compensation for CHWs is well below                health system on the geographic access (community vs facility-
the national minimum wage and is frequently based on a               based) to primary health care. The ultimate goal was to pro-
social marketing strategy, where CHWs earn a markup for the          vide evidence, via this district-level pilot, on the contribution
sale of medicines. Community-based diagnosis and treatment           and limitations of broader policies for UHC and community
is generally restricted to malaria, pneumonia and diarrhoea          health towards the realization of universal access to primary
for children under five (Ahmed et al., 2010). The burden of          health care in rural settings of developing countries.
disease thus remains unmet for the large majority of the pop-
ulation, even when community health systems are fully func-
tioning. New World Health Organization (WHO) guidelines,             Methods
not yet fully adopted by most countries, recommends paying           Study site
CHWs minimum wage, removing use fees and providing ded-              Ifanadiana is a rural health district of approximately 200
icated supervision (World Health Organization, 2018b), but           000 people located in the region of Vatovavy-Fitovinany, in
there remains debate on how to optimize community health.            Southeastern Madagascar. As per Ministry of Health (MoH)
    The situation of Madagascar is illustrative of the chal-         norms, Ifanadiana district has one reference hospital, one
lenges of many low-income countries attempting to translate          main primary care health centre (PHC2) for each of its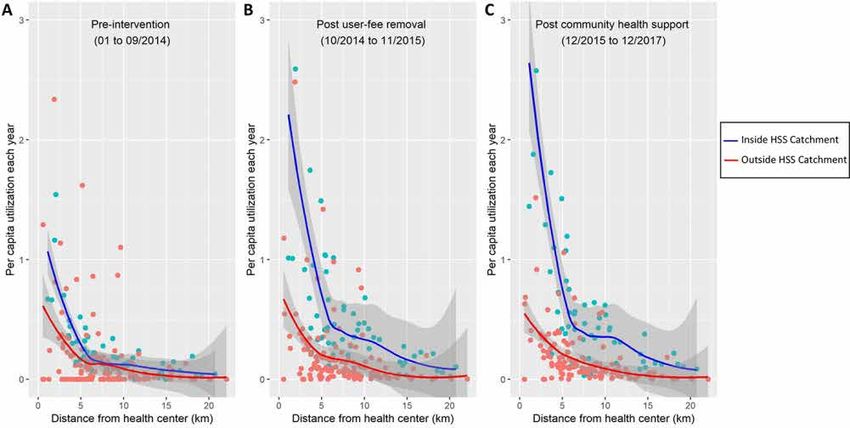
Health Policy and Planning, 2021, Vol. 36, No. 10                                                                              1661

13 communes (subdivision of a district with ∼15 000 people),        period from January to December 2017, we also collected
six additional basic health centres for its larger communes         consultation data from the community health sites supported
(PHC1), and one community health site with two CHWs                 by the MoH–NGO partnership at this time (four out of five
for each of its 195 fokontany (subdivision of a commune             communes in the intervention area and 43 fokontany with
with ∼1000 population). The integrated HSS intervention             an estimated population of about 55 000). This informa-
carried out by the MoH–NGO partnership (summarized in               tion, which was already available at the fokontany level, was
Supplementary Table S1) began in 2014, is guided by exist-          obtained from the monthly report to the district and was ver-
ing MoH policies, covers all six WHO building blocks of             ified for data quality and corrected where necessary by the
HSS and is implemented across all three levels of care in           NGO’s monitoring and evaluation team.
the district (community, health centre and hospital). This              Population data for each fokontany was obtained from the
intervention is structured through the integration of hori-         MoH. Consistent with MoH estimates, the population of chil-
zontal improvements in system ‘readiness’, vertically aligned       dren under 5 years was set at 18% of the total catchment
clinical programmes and information systems. Readiness              population. Although official population data are sometimes
includes infrastructure and sanitation, staffing and equip-         deemed inaccurate, we previously showed that estimating
ment to improve the quality of care; procurement systems; an        catchment populations using available data for our district
ambulance network; the removal of user fees and provision           from other recognized sources such as WorldPop (2017) did
of social support to patients; trainings and frequent super-        not change the results of per capita utilization rates analyses
vision of health staff. The clinical programmes include mal-        (Garchitorena et al., 2017). Information about key dates of
nutrition and integrated management of child illness through        the HSS intervention, especially the beginning of the user-fee
strengthened community health programmes, PHCs and hos-             exemption programme and the community health programme
pital (details can be found in Garchitorena et al., 2018; Bonds     for each supported commune, were obtained from internal
et al., 2017). The core activities in the first years (2014–2017)   records within the NGO. Number of health professionals at
covered approximately one-third of the population of Ifana-         each PHC per month were obtained from district’s records and
diana (referred to as ‘HSS catchment’), with some activities        Service Availability and Readiness Assessments (Ezran et al.,
such as medical staff recruitments spanning the whole district      2019).
(Supplementary Table S1).
   In addition to the HSS intervention, the population of
                                                                    Geographic information system
Ifanadiana benefited from two other notable programmes that
covered both the HSS catchment and the rest of the dis-             We gathered geographic information from multiple sources in
trict (RoD) in this period. The PAUSENS project, funded             order to estimate the distance and travel time from each house
by the World Bank and implemented in 2013–2017, pro-                in Ifanadiana district to the nearest PHC. First, we mapped
vided a basic package of services free of charge in all 13          all footpaths, residential areas, houses and rice fields in the
PHC2 for every woman attending the health centre for ante-          district using very-high-resolution satellite images available
natal, delivery or postnatal care (first 6 weeks) and children      through OpenStreetMap (OSM). For this, we implemented a
under age five with any illness (The World Bank, 2012).             participatory approach in collaboration with the non-profit
The project also included training, support for child vacci-        organization Humanitarian OpenStreetMap Team (HOT).
nation in remote areas and some equipment to health centres.        The district was divided in tiles of 1 km by 1 km and a request
The Mikolo project, funded by U.S. Agency for International         for mapping them was made publicly available through the
Development and implemented in 2012–2017, provided sup-             HOT website (Humanitarian OpenStreetMap Team, 2019).
port to a network of 150 CHWs in the remote fokontany               Mapping was carried out in a two-stage process, where tiles
(further than 5 km from a health centre) of eight communes in       that had been mapped had to be validated by a separate
Ifanadiana, four of which were in the HSS catchment and four        contributor. Most tiles were mapped and validated by a ded-
in RoD. The project organized annual trainings and periodic         icated team hired through the project to ensure data quality
supervision and provided some equipment, supplies and an            and completion within the project deadlines. When mapping
initial stock of medicines to each CHWs. The main difference        was completed, we used the Open Source Routing Machine
between HSS catchment and RoD (our control group) was the           (OSRM) engine to query our OSM data and accurately esti-
implementation of the HSS intervention by the MoH–NGO               mate the shortest path between each house in the district and
partnership.                                                        the nearest PHC.
                                                                       Second, to estimate travel speed by foot under different ter-
                                                                    rain and environmental conditions, we conducted field global
Health system utilization data                                      positioning system (GPS) tracking between September 2018
From January 2014 to December 2017, we obtained data                and April 2019 in a sample of itineraries in Ifanadiana. A
from the registries on all individuals attending any PHC for        total of 168 itineraries by foot amounting to nearly 1000 km
an outpatient consultation in the district. The data were col-      were collected by the NGO’s community and research teams,
lected via regular visits to each PHC in the district by the        in collaboration with CHWs. For this, we used the android
NGO staff every 3–4 months, in agreement with the head of           mobile app ‘OSMAnd’ installed in tablets (Samsung Galaxy
each PHC and the district medical inspector. This allowed for       A10.1) and we recorded every 10 s the GPS coordinates, time
the creation of a patient-level, de-identified digital database.    and altitude.
For each patient (new visits; follow-up excluded), informa-            Third, we built remotely sensed land cover maps com-
tion included the age, name of the fokontany of residence           bining information from Sentinel-2 satellites and OSM. We
and malaria status. Fokontany are the smallest administrative       integrated land cover maps with the rest of graphical infor-
units, composed of one or several villages, and are located at      mation system (GIS) data (climate, elevation, etc.) to statisti-
varying distances from the nearest PHC (0–20 km). For the           cally model travel speed and estimate terrain characteristics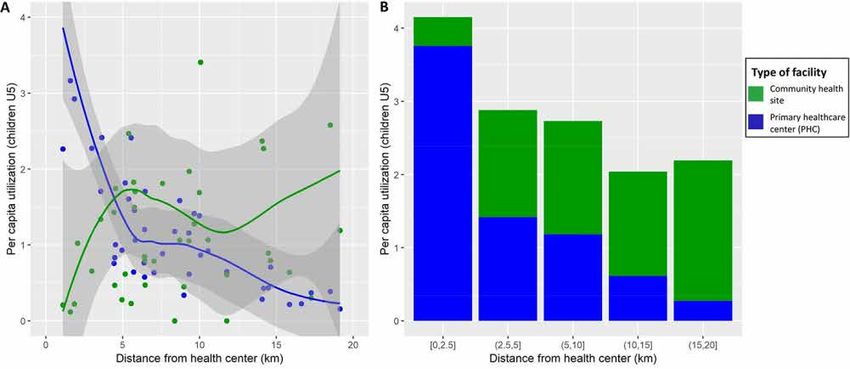
1662                                                                                                Health Policy and Planning, 2021, Vol. 36, No. 10

associated with higher or lower speed using a generalized                        in the type of PHC (PHC1 or PCH2); and for the number of
additive mixed model. We finally combined model results, GIS                     health staff over time in the closest PHC for each fokontany.
data and the shortest paths estimated by OSRM in order to                           Per capita utilization rates at PHC were modelled for each
predict travel time to seek care at the nearest PHC for every                    fokontany using binomial regressions in generalized linear
house in Ifanadiana. The aggregated distance and travel time                     mixed models, with a random intercept introduced for the
for a fokontany was the average of all houses in the fokon-                      closest PHC. All other variables were introduced as fixed
tany. A detailed description of the methods used to estimate                     effects. Each explanatory variable was studied through uni-
distance and travel time to PHC is available in Ihantamalala                     variate analyses and those with P-values below 0.1 were
et al. (2020).                                                                   included in multivariate models. Orthogonal polynomial
                                                                                 terms of degree 2 were included to account for the non-linear
Data analysis of health system data                                              relationship of per capita utilization with travel distance/time
The impact of the HSS intervention on utilization rates at each                  to the PHC. We included interaction terms between the HSS
fokontany was modelled using interrupted time-series analy-                      programmes and the travel distance/time to the PHC in the
ses with control groups (Kontopantelis et al., 2015). For this,                  multivariate model to test whether these programmes had a
we first aggregated health centre patient-level information to                   different effect on remote populations. Model selection was
estimate per capita utilization rates per month for each Fokon-                  performed through step-wise procedures based on Akaike
tany in Ifanadiana district (Figure 1). We studied the linear                    information criterion (AIC), by selecting the reduced model
and non-linear effect of travel distance and travel time from                    with the lowest AIC. Model assumptions in the final model
each fokontany to the nearest PHC on utilization rates. We                       were verified, including violations to homogeneity and inde-
assessed the impact of two programmes designed to reduce                         pendence of residuals. We introduced a 1-month utilization
financial barriers (i.e. user-fee exemption) and to reduce geo-                  lag in the final models to remove temporal autocorrelation in
graphic barriers (i.e. community programme) by assessing                         the residuals. To facilitate interpretation of results, we report
the level of change in utilization (immediate impact) associ-                    exponentiated model coefficients, which reflect the ratio of
ated with each programme (Kontopantelis et al., 2015). We                        change (odds ratio, OR) in utilization rates associated with
hypothesized that the community programme could have a                           each explanatory variable. Several sets of analyses were car-
positive impact on facility-based PHC utilization via increased                  ried out in order to study PHC utilization separately in the
sensitization, awareness and referrals by CHWs, especially for                   general population, in specific age groups (children under
the 82% of the population over 5 years of age that is beyond                     five), and including or excluding malaria cases from the anal-
the scope of CHWs work. We also controlled for linear and                        yses. Using the final model for the general population, we
seasonal trends in utilization rates in the absence of the pro-                  predicted PHC utilization for every Fokontany in Ifanadi-
grammes; for baseline differences in HSS-supported PHC and                       ana under a scenario without HSS programmes (no user-fee

Figure 1. Geographic origin of patients from the 19 PCH in Ifanadiana district, 2014–2017. (A) Origin of all patients attending each of the 19 health centers
in Ifanadiana district. For improved visualization, lines between Fokontany and PHC are included only when they represent over 100 patients, with line
transparency inversely proportional to the logarithm of the number of visits. These data were aggregated to obtain a total number of per-capita visits per
month for each Fokontany (lowest administrative unit, comprising one or several villages). (B) Average number of PHC visits per capita-year for each
Fokontany during the study period.
Health Policy and Planning, 2021, Vol. 36, No. 10 1663
exemption, no community health support and three health
74 738 (0.38)
13 453 (0.38)
61 285 (0.38)
42 344 (0.15)
15 601 (0.17)
26 743 (0.15)
staff per PHC) and with HSS programmes (user-fee exemp-
tion, community health support and seven health staff per
2–5 h
0.16
0.33
0.12
PHC). Finally, we compared geographic trends in primary
care when combining utilization at both PHC and commu-
nity health sites in the subset of 43 fokontany where the
74 169 (0.37)
13 350 (0.37)
60 818 (0.37)
83 154 (0.31)
31 356 (0.34)
51 798 (0.29)
community health programme had been strengthened by the
Time to PHC
MoH–NGO partnership. Analyses were performed with R
software (R Development Core Team, 2011) and R packages
1–2 h
0.32
0.67
0.24
‘lme4’, ‘gstat’, ‘rgdal’ and ‘ggplot2’.
145 249 (0.54)
Results
49 269 (0.25)
40 400 (0.25)
45 576 (0.49)
99 673 (0.56)
8868 (0.25)
PHC utilization by geographic proximity
Of the 314 443 patients who attended a PHC for an outpa-
0–1 h
0.84
1.46
0.70
tient visit, 276 865 patients had a known geographic location
and 99.25% of these (274 798) came from within the dis-
trict (Supplementary Figure S1). Table 1 presents summary
53 573 (0.27)
43 930 (0.27)
23 424 (0.09)
14 960 (0.08)
statistics of the patient population based on these geographic
9643 (0.27)
8464 (0.09)
10–22 km
analyses. Although more than two-thirds of the population
lived further than 5 km from a PHC (5–22 km) and 27%
0.12
0.25
0.1
lived further than 10 km (10–22 km), these populations rep-
resented only 40% and 9% of all patient visits, respectively.
Only a fourth of the population lived within 1 h of a PHC.
Distance to PHC
80 790 (0.41)
14 542 (0.41)
66 248 (0.41)
83 667 (0.31)
31 308 (0.34)
52 359 (0.29)
Average annual PHC utilization per capita rates were nearly
triple inside the HSS intervention catchment (0.64) than in
5–10 km
the RoD (0.23) for all ages and more than double for children
0.29
0.22
0.6
under 5 years. Utilization rates more than halved for every
5 km and every hour of travel from a PHC for every age group
considered (Table 1).
110 895 (0.62)
63 811 (0.32)
11 486 (0.32)
52 325 (0.32)
163 656 (0.6)
52 761 (0.57)
Spatial analyses revealed that utilization rates increased
Table 1. Geographic distribution of populations and PHC outpatient visits in Ifanadiana district, 2014–2017
over time in the HSS intervention catchment but declined dra-
0–5 km
matically as distance increased within the first 5 km from a
0.74
1.33
0.61
PHC, especially after the system was strengthened at the facil-
ity level (Figure 2). The HSS intervention exacerbated the
impact of geography on utilization (Figure 2b and c), but the
126 023 (0.64)
103 338 (0.64)
22 684 (0.64)
97 250 (0.36)
40 293 (0.44)
56 957 (0.32)
ratio in PHC utilization between populations living in close
proximity (10 km)
remained the same at over 10 times higher. Following user-
HSS Catchment
RoD
0.23
0.53
0.16
fee exemptions, the HSS intervention catchment experienced
a substantial increase in utilization, from 1 to nearly 3 vis-
its per capita year for populations living in close proximity
173 497 (0.64)
121 257 (0.68)
to a PHC and from 0.25 to about 0.5 visits per capita
72 152 (0.36)
12 987 (0.36)
59 164 (0.36)
52 240 (0.56)
year for populations living 5–10 km from a PHC (Figure 2b
and c).
Inside
0.64
1.07
0.54
Despite strong seasonal variation in utilization rates, par-
ticularly for populations living close to a PHC, trends
remained unchanged in the RoD during the study period
198 175
162 503
270 747
178 214
(Figure 3). Compared with the RoD, HSS activities in the
District
35 671
92 533
intervention catchment resulted in a shift by 5 km in PHC
0.39
0.74
0.31
utilization patterns so that populations living 5 km further
from a strengthened PHC accessed care at rates comparable
to those living 5 km closer to a facility that did not receive
Total number of patients (prop.)
Per capita utilization per year
the intervention (Figure 3). We also observed seasonality in
the average distance patients travelled to access a PHC during
the year (Supplementary Figure S2). Overall, 50% of out-
patient visits seen in the intervention catchment came from
Under 5 years old
Under 5 years old
Under 5 years old
Population (prop.)
Over 5 years old
Over 5 years old
Over 5 years old
localities within 2 km of a PHC and over 75% from local-
ities within 4 km, but in the months of May through July
(dry season) patients came from further away. These sea-
All ages
All ages
All ages
sonal patterns were not observed in the RoD (Supplementary
Figure S2).1664 Health Policy and Planning, 2021, Vol. 36, No. 10 Figure 2. Average PHC per capita utilization by distance of Fokontany to PHC. Colors represent the HSS intervention catchment (blue) and the rest of Ifanadiana district (blue). Each dot represents one of the 195 Fokontany in Ifanadiana, solid lines are the respective non-linear smooth (local regression, LOESS method) and grey shades are the 95% confidence intervals around each smooth. A clear distance decay pattern can be observed, accentuated for the HSS intervention catchment due to a larger increase in utilization near PHC following the HSS intervention (B and C). To improve visualization, one dot from the HSS intervention catchment post intervention (4.5 per capita-year) was removed. Figure 3. Time-series of PHC per capita utilization by distance of Fokontany to PHC, inside and outside the HSS intervention catchment. (A) Heat map of observed monthly PHC utilization, where grey color scale is proportional to average per capita values at each distance. (B) Model predictions of PHC per capita utilization for Ifanadiana, aggregated by intervention catchment area and distance to PHC. Both graphs show that implementation of HSS activities in the intervention catchment resulted in a shift by 5km of PHC utilization patterns (e.g. those living 5-10km from a PHC in the intervention catchment, have similar utilization rates than those within 5km outside the catchment). Utilization rates were annualized to improve comparability of results. Impact of HSS programmes on PHC utilization cases (because of their influence on PHC utilization season- Our models confirmed the exponential decrease in PHC ality), as well as for populations of all ages or only children utilization due to geographic distance after accounting for under 5 years. In every model, a non-linear relationship with programme implementation, health system factors and under- distance to PHC best explained utilization patterns (better lying temporal trends (Table 2, Supplementary Figure S3). than using a linear relationship with distance or using travel We carried out several models to understand the consis- time as the explanatory variable), and this was the most tency of associations when including or excluding malaria important variable associated with PHC utilization trends
Health Policy and Planning, 2021, Vol. 36, No. 10 1665
Table 2. Multivariate model results (generalized linear mixed models with random intercept at the PHC closest to the fokontany of residence)
Outpatient visits for
Outpatient visits for Outpatient visits for Outpatient visits for all children under age 5,
all ages children under age 5 ages, excluding malaria excluding malaria
Variable OR (95% CI) OR (95% CI) OR (95% CI) OR (95% CI)
Intercept (visits per capita 0.02 (0.011–0.037) 0.032 (0.019–0.054) 0.015 (0.008–0.03) 0.024 (0.013–0.043)
month)
Geographic factors
Network distance to PHC 0.126 (0.121–0.131) 0.228 (0.212–0.244) 0.095 (0.091–0.1) 0.141 (0.13–0.154)
(10 km, linear)a
Network distance to PHC 1.102 (1.076–1.13) 0.898 (0.862–0.937) 1.261 (1.226–1.297) 1.07 (1.018–1.126)
(10 km, quadratic)a
Health system factors
Number of health staff 1.042 (1.037–1.048) 1.032 (1.023–1.041) 1.043 (1.037–1.049) 1.039 (1.029–1.048)
Major PHC (vs basic PHC) 3.238 (1.5–6.993) 3.449 (1.764–6.744) 3.16 (1.421–7.024) 3.634 (1.762–7.493)
HSS catchment (vs outside) 0.663 (0.636–0.69) 0.637 (0.597–0.68) 0.641 (0.611–0.672) 0.634 (0.587–0.684)
Impact of HSS programmes
User-fee exemption 1.09 (1.063–1.118) 0.946 (0.908–0.987) 1.18 (1.145–1.215) –
programme
Interaction with distance 1.454 (1.433–1.476) 1.416 (1.385–1.448) 1.44 (1.415–1.466) 1.361 (1.328–1.394)
to PHC (10 km)a
Community health 1.147 (1.125–1.17) 1.148 (1.118–1.179) 1.112 (1.087–1.137) 1.081 (1.039–1.125)
programme
Interaction with distance 1.095 (1.08–1.111) – 1.127 (1.109–1.145) 1.052 (1.02–1.085)
to PHC (10 km)a
Underlying trends
Linear trend (year) 0.968 (0.962–0.973) 0.968 (0.959–0.977) 0.988 (0.981–0.995) –
Seasonal trendb 1.204 (1.197–1.211) 1.212 (1.199–1.225) 1.031 (1.024–1.038) 1.127 (1.114–1.141)
Lagged trend (1-month lag)c 1.473 (1.466–1.48) 1.304 (1.297–1.311) 1.65 (1.637–1.663) 1.363 (1.352–1.375)
a
The variable network distance represents tens of kilometres (distance in km × 10−1 ) to facilitate interpretation of coefficients and enable model convergence.
b
Seasonal trend was constructed as [sin(2π(Monthi + θ/12], where θ was the horizontal shift that best fit the data of each model.
c
Lagged trend transformed into visits per capita year to allow interpretation of results.
(Supplementary Table S2). After controlling for time trends HSS scenarios that included hiring additional health staff at
and baseline differences in health system factors, patterns of PHC, removing user fees and strengthening community health
geographic utilization of healthcare services were also highly (Supplementary Figure S5).
sensitive to HSS programmes implemented in this period,
especially the fee-exemption programme to increase financial
access to PHC and the community program to address geo- Utilization for children under 5 years when
graphic barriers (Table 2). Both programmes had a positive combining PHC and community health
impact on PHC utilization rates for all ages (OR = 1.09 consultations
and OR = 1.14, respectively), with a higher relative increase To reduce geographic barriers to care, CHWs (two per fokon-
for those populations living further away (OR = 1.45 and tany) can manage childhood illnesses such as malaria, diar-
OR = 1.09, respectively, every 10 km from a PHC). These rhoea or pneumonia for children under 5 years of age. Data
results were consistent regardless of the age group considered from community health sites in four communes of the HSS
or whether malaria cases were included in the model (Table 2). intervention area revealed that when combining outpatient
Our models accurately explained spatial and temporal uti- visits from both PHC and community health sites for chil-
lization patterns at PHC (Supplementary Figure S4), allowing dren under five, utilization of primary care in this period
us to predict dynamics of PHC geographic utilization in the exceeded one visit per child for 39 of the 43 fokontany
district (S2 Video). (94% of under-five population), regardless of the distance
Predictions from the model for all ages suggested that in of the population to a PHC (Figure 5a). On average, com-
the absence of these programmes, only 1% of the population bined utilization exceeded two visits per child per year in
in Ifanadiana district would have per capita PHC utilization all distance groups from a PHC (Figure 5b). Average uti-
of one visit or more per year and 12% would have 0.5 visits or lization at community health sites substantially increased at
more per year. If these programmes were implemented every- further distances from a PHC: annual utilization was less
where in the district, nearly one-quarter of the population than 0.5 at 2.5 km from a PHC and nearly two at fokon-
(23%) would have a PHC utilization of at least one visit and tany more than 15 km from a PHC. As a result, visits at
nearly half (47%) would have at least 0.5 visits per capita community health sites accounted for 90% of total pri-
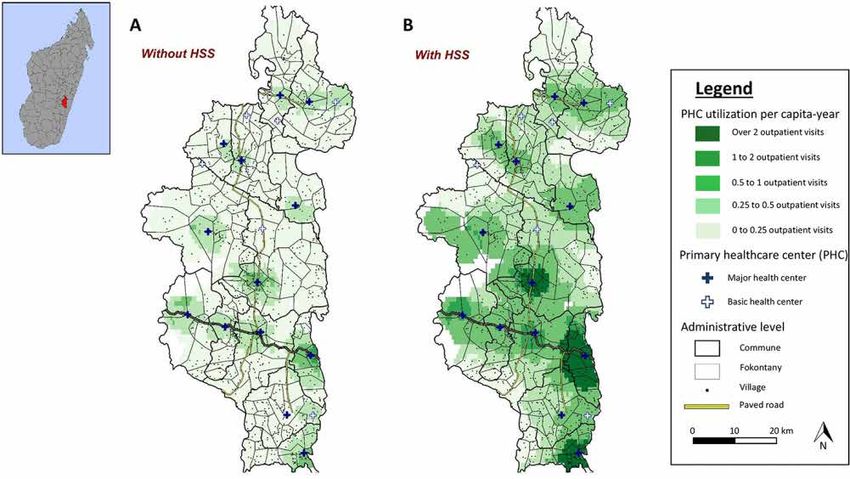
year. Maps in Figure 4 show predictions of the geographic mary care visits in fokontany further than 15 km from a
distribution of PHC utilization with and without implemen- PHC, while they accounted for only 10% of total visits at
tation of HSS programmes, revealing substantial gaps in 2.5 km or less from a PHC (Figure 5b). Combined utiliza-
health system coverage for remote populations. PHC utiliza- tion of primary care was still lower for children living further
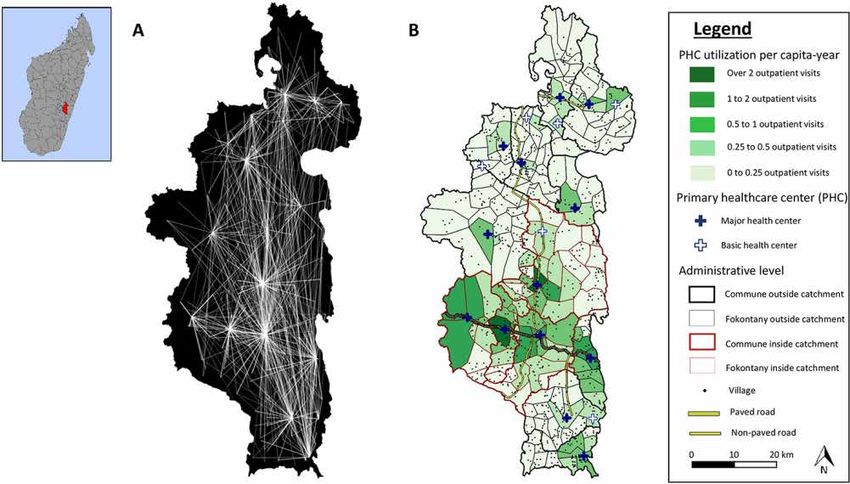
tion remained low for remote populations under a variety of away from a PHC, but the effect of distance was much less1666 Health Policy and Planning, 2021, Vol. 36, No. 10 Figure 4. Predictions of geographic distribution of PHC per capita utilization in Ifanadiana district according to scenarios of HSS intervention implementation. Color shades represent predictions of annual PHC per capita visits in (A) a scenario where no HSS activities are implemented, and (B) a scenario where HSS are implemented in the whole district. Maps reveal that despite improvements, even if HSS were implemented across the district, a large proportion of the population would remain with very low levels of realized access to facility-based primary care. Figure 5. Annual utilization rates of primary care (PHC and community health sites) per capita by children under 5 years in the HSS intervention catchment, 2017. Graphs show per capita utilization at different distances to the nearest PHC, disaggregated by PHC and community health visits. It reveals that utilization at community health sites compensates the distance decay observed for PHC use, with higher community health site utilization at further distance to PHC and reaching over 2 visits per capita-year for all distance groups. To improve visualization, four dots were removed in the left graph (utilization over 4 per capita-year). pronounced due to the exponential increase in community Discussion health site utilization at higher distances from PHC A renewed commitment to strengthening primary healthcare (Figure 5a), which essentially compensated for the distance systems and ensuring UHC is essential to meet the health- decay. related Sustainable Development Goals (United Nations
Health Policy and Planning, 2021, Vol. 36, No. 10                                                                                1667

General Assembly, 2015), but enormous questions remain              with doctors, 2018). This suggests that UHC policies can be
on how to do this (World Health Organization, 2018b;                effective at increasing healthcare use to internationally accept-
Stenberg et al., 2017; Giedion et al., 2013; Atun et al.,           able levels for some populations. Yet, although distance to
2008; Hatt et al., 2015). Here, we analysed geographic data         PHC is not always associated with lower utilization or worse
from hundreds of thousands of patients in a rural district          outcomes (Munyaneza et al., 2018; Lankowski et al., 2014;
of Madagascar undergoing health system transformation to            Gething et al., 2004), we observed a similar distance decay
understand how facility- and community-based interventions          in utilization as previously described in other settings (Feikin
contribute to health system coverage. Our results reveal that       et al., 2009; McLaren et al., 2014; Gething et al., 2012;
facility-based primary care has limited geographic coverage,        Noor et al., 2003; Stock, 2012; Kelly et al., 2016). Moreover,
even when it is free of charge at the point of service and of       we show that this decay can be even more pronounced once
improved quality, the focus of most national UHC policies           interventions aimed at increasing healthcare access have been
(Garchitorena et al., 2017; Ezran et al., 2019). Communities        implemented. We found that the median distance of patients
that lived within 5 km of a supported PHC exceeded one visit        to PHC following the HSS was 2 km, similar to results found
per person year, but the intervention accentuated the distance      in a rural area of Western Kenya (Feikin et al., 2009). Our
decay (exponential decrease) in PHC utilization and widened         results are also consistent with evidence from Burkina Faso
the gap with remote populations, which exacerbated dispar-          and Ghana, where user-fee exemptions and HSS strategies
ities. We predict that scaling up PHC interventions alone           achieved greater equity across socio-economic groups but did
(removing user fees and improving health system readiness)          not overcome geographic barriers (Langlois et al., 2016; De
would only achieve modest increases in geographic coverage,         Allegri et al., 2011; Mills et al., 2008; De Allegri et al., 2015;
with three-fourths of the population consulting at facilities       Hounton et al., 2008). This puts into question the assumption
less than once per person year. Strengthening community             that UHC policies alone, when they are in place and effective,
health can have substantial impacts on the geographic reach         can ensure the provision of primary healthcare services ‘for
of the health system. The effect of geography on primary care       everyone, everywhere’.
access was greatly reduced for children under 5 years when              Using geographic information from nearly 300 000 pri-
considering community health consultations, reaching over           mary care visits to PHC, we show that health system data
two consultations per child year regardless of distance. CHWs       can allow for powerful studies of spatio-temporal changes
were the main source of healthcare delivery for children in         in healthcare access and for drawing key insights to improve
remote populations, representing 90% of primary care visits         UHC strategies. Previous studies that combined measures of
for those living further than 15 km from a PHC.                     geographic access with healthcare utilization or service cover-
    Research on geographic accessibility to care has generally      age have been restricted to discrete services or conditions such
focused on characterizing either potential access (population       as obstetric care, tuberculosis, malaria and HIV (Noor et al.,
within a certain distance from a PHC) or realized access            2003; 2006; Munyaneza et al., 2018; Lankowski et al., 2014;
(actual utilization at different distances to a PHC) (Yao and       Ebener et al., 2015; Kuupiel et al., 2019). Electronic health
Agadjanian, 2018; Chukwusa et al., 2019). In terms of poten-        management information system (HMIS) data currently avail-
tial access, a travel time of 1 or 2 hours to health services is    able rarely include a low level of geographic disaggregation,
a typically accepted measure of accessibility to health services    so studies typically use information from national surveys or
(Gething et al., 2012; Pilcher et al., 2014; Noor et al., 2006;     restrict the extraction of HMIS geographic information to
Juran et al., 2018; Bailey et al., 2011). We estimated distance     particular conditions (Langlois et al., 2016; McLaren et al.,
to PHC using a complete district mapping of over 20 000 km          2014; De Allegri et al., 2011; 2015; Buor, 2003; Rosero-
of footpaths and 100 000 houses. We then parametrized travel        Bixby, 2004; Ruktanonchai et al., 2016) or to small samples
time with hundreds of hours of fieldwork and remote sensing         of patients (Stock, 2012; Gething et al., 2004). One of the
analyses. This approach allowed us to improve on previous           most precise studies linked over 3000 paediatric health vis-
methods in developing countries that use either Euclidean dis-      its in seven clinics in Kenya to individual identifiers from a
tances, friction surfaces (Stock, 2012; Makanga et al., 2016;       demographic surveillance system (Feikin et al., 2009). How-
Munyaneza et al., 2018) or self-reported answers in surveys         ever, a push for electronic data collection to improve health
(Gething et al., 2012; Noor et al., 2003; Al-Taiar et al., 2010).   information systems is underway in many developing coun-
We found that the majority of the population in Ifanadiana          tries, thanks to the scale up of the open source DHIS2 (District
district (75%) lived more than 1 h from primary care at a PHC       Health Information Software) among other platforms, which
and over one-third (38%) lived further than 2 h. These figures      can be combined with community-based mobile tools for reg-
are significantly worse than regional estimates of primary          istering cases and track patient-level data at different levels
healthcare access in sub-Saharan Africa (Weiss et al., 2020)        of care (Dehnavieh et al., 2018). The level of granularity and
and more comparable to estimated access to secondary care at        timeliness of data of these e-health platforms will open new
hospitals in the region (Juran et al., 2018; Ouma et al., 2018).    possibilities for integration of feedback loops between spatial
This may suggest that either access to care in Ifanadiana is        modelling approaches in local planning and implementation
indeed far worse than average or multi-country approaches           of health strategies to maximize geographic access.
tend to underestimate the proportion of the population with             Our study had several limitations. First, our estimates of
poor access to care, or both.                                       travel time were based on speeds recorded in fieldwork done
    When user fees were removed and HSS activities were in          by health workers and community members, so they represent
place, we found that utilization rates reached between one and      local travel time for healthy individuals. Other groups such
three consultations per person year for populations in close        as ill individuals, pregnant women or the elderly likely take
proximity to PHC, similar to findings in other studies in Africa    longer to reach health facilities, and factors such as break time
(Zombré et al., 2017), and close to utilization rates in many       during a route that were not considered here could be partic-
OCDE countries with lower disease burdens (Consultations            ularly relevant for long distances. As a result, even our locally
1668 Health Policy and Planning, 2021, Vol. 36, No. 10
calibrated results on travel time may be underestimating true teams for their support during data collection. Thanks are due
travel time for certain vulnerable groups. Second, in this study to Benjamin Andriamihaja and Tanjona Andréambeloson for
we assessed aggregate changes in per capita utilization by their help at different stages of the project.
fokontany and compared differences between catchment areas
rather than evaluating individual patient itineraries. A study Ethical approval Use of MoH data for this study was autho-
on prenatal care in Mozambique showed that although most rized by the Secretary General of the MoH, by the Medical
women living near a PHF used the closest facilities, those Inspector of Ifanadiana district and by Harvard’s Institutional
who lived more than 5.5 km away could travel to a further Review board (IRB20-1247).
PHF to seek better services (Yao and Agadjanian, 2018). If
patients from outside the HSS catchment preferred to attend
a HSS-supported PHC despite further distance, this could Author contributions
have resulted in an underestimation of the intervention effects.
Third, studies in Ghana and Nigeria found that the distance Conceived and designed the experiments: A.G., C.R., L.F.C.,
decay was more important for illiterate, low-income, women, V.H. and M.H.B. Performed the analysis: A.G., F.A.I., C.R.,
children and elderly populations (Stock, 2012; Buor, 2003), M.R., V.H. and M.H.B. Contributed reagents/materials/
but we could only test for the decay in different age groups analysis tools: A.G., C.R., V.H. and M.H.B. Wrote the paper:
because it was the only demographic information collected. A.G., F.A.I., C.R., L.F.C., M.R., B.R., F.H.R., K.E.F., J.C.A.,
Finally, like for any local study, the generalizability of results J.R., V.H. and M.H.B.
presented here may be limited to other rural, low-income set- Conflict of interest statement Some authors are current or for-
tings with similar characteristics as Ifanadiana in terms of mer employees of institutions discussed in this article, includ-
geography, socio-economic level and health system factors. ing the NGO PIVOT and the Government of Madagascar.
Further research is needed to assess whether similar effects of These affiliations are explicitly listed in the article.
UHC and community health policies on primary care access
are observed elsewhere.
In conclusion, the results from this study have important
implications for the UHC strategy in Madagascar and other References
low-income countries, suggesting that wider support to com- Ahmed HM, Mitchell M, Hedt B. 2010. National implementation
munity health may be necessary to achieve universal access to of Integrated Management of Childhood Illness (IMCI): policy
primary care. Although there remains debate on how to opti- constraints and strategies. Health Policy 96: 128–33.
mize community health, a greater ability for populations to Al-Taiar A, Clark A, Longenecker JC, Whitty CJM. 2010. Physical
reach facilities is critical in order to directly address the geo- accessibility and utilization of health services in Yemen. Interna-
graphic burden of disease, and professionalized CHWs could tional Journal of Health Geographics 9: 1–8.
Atun RA, Bennett S, Duran A. 2008. When do vertical (stand-alone)
contribute to this by expanding the scope of primary care ser-
programmes have a place in health systems? WHO European Min-
vices they provide across a greater range of clinical cases and isterial Conference on Health Systems: 1–28. https://apps.who.int/
demographic groups. More generally, we show how a model iris/handle/10665/107977.
system in global health—based on the dynamic integration of Bailey PE, Keyes EB, Parker C et al. 2011. Using a GIS to model inter-
data and services at multiple levels of the health system in geo- ventions to strengthen the emergency referral system for maternal
graphically constrained areas—can help address fundamental and newborn health in Ethiopia. International Journal of Gynecol-
questions on key global health policy issues. ogy & Obstetrics 115: 300–9.
Bates MA, Glennerster R, Gumede K, Duflo E The price is wrong. Field
Actions Science Reports 2012. Special issue 4. http://factsreports.
Supplementary data revues.org/1554.
Supplementary data are available at Health Policy and Bonds MH, Garchitorena A, Cordier L et al. 2017. Advancing a sci-
Planning online. ence of sustaining health: a new platform for a model district in
Madagascar. bioRxiv: 141549.
Buor D. 2003. Analysing the primacy of distance in the utilization
Data availability statement of health services in the Ahafo-Ano South district, Ghana. The
Data are available upon request to the address International Journal of Health Planning and Management 18:
293–311.
research@pivotworks.org.
Chukwusa E, Verne J, Polato G et al. 2019. Urban and rural differences
in geographical accessibility to inpatient palliative and end-of-life
Funding (PEoLC) facilities and place of death: a national population-based
study in England, UK. International Journal of Health Geographics
This work was supported by a grant from Institut de
18: 8.
Recherche pour le Developpement (Project IRD Coup de Consultations with doctors. 2018. Health at a Glance 2017: OECD
Pouce ‘MAGIE’) and internal funding from PIVOT. Indicators. Paris: OECD Publishing, 168–9.
Cordier LF, Kalaris K, Rakotonanahary RJL et al. 2020. Networks of
Acknowledgements care in rural Madagascar for achieving universal health coverage in
Ifanadiana district. Health Systems & Reform 6: 2–e1841437.
We are grateful to everyone who contributed to the partici- De Allegri M, Ridde V, Louis VR et al. 2011. Determinants of utilisation
patory mapping of Ifanadiana, especially Jérémy Commins, of maternal care services after the reduction of user fees: a case study
and Blake Girardot for setting the HOT projects online. We from rural Burkina Faso. Health Policy 99: 210–8.
thank the staff of the local Ministry of Health team in Ifana- De Allegri M, Tiendrebéogo J, Müller O et al. 2015. Understanding
diana district as well as PIVOT’s monitoring and community home delivery in a context of user fee reduction: a cross-sectionalHealth Policy and Planning, 2021, Vol. 36, No. 10 1669 mixed methods study in rural Burkina Faso. BMC Pregnancy Child- Kashima S, Suzuki E, Okayasu T et al. 2012. Association between birth 15: 330. proximity to a health center and early childhood mortality in Dehnavieh R, Haghdoost AA, Khosravi A et al. 2019. The District madagascar. PLoS One 7: e38370. Health Information System (DHIS2): a literature review and meta- Kelly C, Hulme C, Farragher T, Clarke G. 2016. Are differences in travel synthesis of its strengths and operational challenges based on the time or distance to healthcare for adults in global north countries experiences of 11 countries. Health Information Management Jour- associated with an impact on health outcomes? A systematic review. nal 48: 62–75. BMJ Open 6: 1–9. Dhillon RS, Bonds MH, Fraden M, Ndahiro D, Ruxin J. 2011. Kontopantelis E, Doran T, Springate DA, Buchan I, Reeves D. 2015. The impact of reducing financial barriers on utilisation of a pri- Regression based quasi-experimental approach when randomisation mary health care facility in Rwanda. Global Public Health 2007: is not an option: interrupted time series analysis. BMJ 350: h2750. 1–16. Kuupiel D, Adu KM, Apiribu F et al. 2019. Geographic accessibility Ebener S, Guerra-Arias M, Campbell J et al. 2015. The geography of to public health facilities providing tuberculosis testing services at maternal and newborn health: the state of the art. International point-of-care in the upper east region, Ghana. BMC Public Health Journal of Health Geographics 14: 19. 19: 1–12. Ezran C, Bonds MH, Miller AC et al. 2019. Assessing trends in the con- Lagarde M, Palmer N. 2011. The impact of user fees on access to health tent of maternal and child care following a health system strength- services in low- and middle-income countries. Cochrane Database of ening initiative in rural Madagascar : a longitudinal cohort study. Systematic Reviews. PLoS Medicine 16: 1–23. Langlois ÉV, Karp I, De Dieu Serme J, Bicaba A. 2016. Effect of a pol- Feikin DR, Nguyen LM, Adazu K et al. 2009. The impact of distance of icy to reduce user fees on the rate of skilled birth attendance across residence from a peripheral health facility on pediatric health util- socioeconomic strata in Burkina Faso. Health Policy and Planning isation in rural western Kenya. Tropical Medicine & International 31: 462–71. Health 14: 54–61. Lankowski AJ, Siedner MJ, Bangsberg DR, Tsai AC. 2014. Impact of Fullman N, Barber RM, Abajobir AA et al. 2017. Measuring progress geographic and transportation-related barriers on HIV outcomes in and projecting attainment on the basis of past trends of the health- sub-saharan Africa: a systematic review. AIDS and Behavior 18: related Sustainable Development Goals in 188 countries: an anal- 1199–223. ysis from the Global Burden of Disease Study 2016. Lancet 390: Makanga PT, Schuurman N, Von Dadelszen P, Firoz T. 2016. A scop- 1423–59. ing review of geographic information systems in maternal health. Garchitorena A, Miller AC, Cordier LF et al. 2018. Early changes in Int J Gynecol Obstet. International Federation of Gynecology and intervention coverage and mortality rates following the implemen- Obstetrics 134: 13–7. tation of an integrated health system intervention in Madagascar. McLaren Z, Ardington C, Leibbrandt M. 2014. Distance decay and BMJ Global Health 3: e000762. persistent health care inequality in South Africa. BioMed Cent 14: Garchitorena A, Miller AC, Cordier LF et al. 2017. In Madagascar, use 541. of health care services increased when fees were removed: lessons Mills S, Williams JE, Adjuik M, Hodgson A. 2008. Use of health pro- for universal health coverage. Health Affairs 36: 1443–51. fessionals for delivery following the availability of free obstetric Gething PW, Johnson FA, Frempong-Ainguah F et al. 2012. Geograph- care in Northern Ghana. Maternal and Child Health Journal 12: ical access to care at birth in Ghana: a barrier to safe motherhood. 509–18. BMC Public Health 12: 1. Munyaneza F, Ntaganira J, Nyirazinyoye L et al. 2018. Community- Gething PW, Noor AM, Zurovac D et al. 2004. Empirical modelling based accompaniment and the impact of distance for HIV patients of government health service use by children with fevers in Kenya. newly initiated on antiretroviral therapy: early outcomes and Acta Tropica 91: 227–37. clinic visit adherence in rural Rwanda. AIDS and Behavior 22: Giedion U, Alfonso EA, Díaz Y. 2013. The Impact of Universal Cov- 77–85. erage Schemes in the Developing World: A Review of the Existing Nguyen HT, Zombré D, Ridde V, De Allegri M. 2018. The impact Evidence. Washington, DC: UNICO Studies Series. of reducing and eliminating user fees on facility-based delivery: Government of Madagascar. 2015. Strategie Nationale sur la Couver- a controlled interrupted time series in Burkina Faso. Health Policy ture Sante Universelle, Madagascar. Antananarivo: Government of and Planning 33: 948–56. Madagascar. Noor AM, Amin AA, Gething PW et al. 2006. Modelling distances trav- Hatt L, Johns B, Connor C et al. 2015. Impact of Health Systems elled to government health services in Kenya. Tropical Medicine and Strengthening on Health. Bethesda, MD: Health Finance and Gov- International Health 11: 188–96. ernance Project, Abt Associates Inc. Noor AM, Zurovac D, Hay SI, Ochola SA, Snow RW. 2003. Defin- Hounton S, Chapman G, Menten J et al. 2008. Accessibility and utilisa- ing equity in physical access to clinical services using geographical tion of delivery care within a Skilled Care Initiative in rural Burkina information systems as part of malaria planning and monitoring in Faso. Tropical Medicine & International Health 13: 44–52. Kenya. Tropical Medicine and International Health 8: 917–26. Humanitarian OpenStreetMap Team. 2019. www.hotosm.org, Ouma PO, Maina J, Thuranira PN et al. 2018. Access to emergency accessed 1 December 2019. hospital care provided by the public sector in sub-Saharan Africa in Ihantamalala FA, Herbreteau V, Revillion C et al. 2020. Improving geo- 2015: a geocoded inventory and spatial analysis. The Lancet Global graphical accessibility modeling for operational use by local health Health 6: e342–50. actors. Int J Health Geogr. 19: 27. Pilcher J, Kruske S, Barclay L. 2014. A review of rural and remote Institut National de la Statistique. 2009. Enquête Démographique health service indexes: are they relevant for the development of an et de Santé, Madagascar. Antananarivo: Institut National de la Australian rural birth index? BMC Health Services Research 14: Statistique. 1–8. Johri M, Ridde V, Heinmüller R, Haddad S. 2014. Estimation of mater- R Development Core Team. 2011. R: A Language and Environment nal and child mortality one year after user-fee elimination: an impact for Statistical Computing. Vienna: R Foundation for Statistical evaluation and modelling study in Burkina Faso. Bulletin of the Computing. World Health Organization 92: 706–15. Rosero-Bixby L. 2004. Spatial access to health care in Costa Rica and its Juran S, Broer PN, Klug SJ et al. 2018. Geospatial mapping of access to equity: a GIS-based study. Social Science & Medicine 58: 1271–84. timely essential surgery in sub-Saharan Africa. BMJ Global Health Ruktanonchai CW, Ruktanonchai NW, Nove A et al. 2016. Equality 3: e000875. in maternal and newborn health: modelling geographic disparities
You can also read